This article offers a thorough comparison of SLAY and ARB tokens concerning their long-term investment potential within the Arbitrum ecosystem. It evaluates historical price trends, supply mechanisms, market adoption, and risks, addressing which token might be a better buy. Suitable for both novice and experienced investors, the analysis highlights the strengths and risks associated with each token, providing actionable insights for investment strategies. Detailed projections till 2030 are included, alongside risk management and asset allocation suggestions, ensuring a comprehensive understanding for informed decision-making.
Introduction: SLAY vs ARB Investment Comparison
In the cryptocurrency market, comparing SLAY vs ARB has become an unavoidable topic for investors. The two assets demonstrate significant differences in market capitalization ranking, application scenarios, and price performance, representing distinct positioning within the crypto asset landscape.
SatLayer (SLAY): Launched recently, it positions itself as Bitcoin's economic layer, transforming BTC into a productive and programmable asset for AI, DeFi, RWA, stablecoins, and traditional finance applications.
Arbitrum (ARB): Since its introduction, ARB has been recognized as a technology suite designed to scale Ethereum, enabling cheaper and faster transactions while inheriting Ethereum-level security through its Optimistic rollup protocol.
This article will comprehensively analyze the investment value comparison between SLAY vs ARB across historical price trends, supply mechanisms, ecosystem adoption, and technological foundations, while attempting to address the question most investors are concerned with:
"Which is the better buy right now?"
I. Price History Comparison and Current Market Status
SatLayer (SLAY) and Arbitrum (ARB) Historical Price Trends
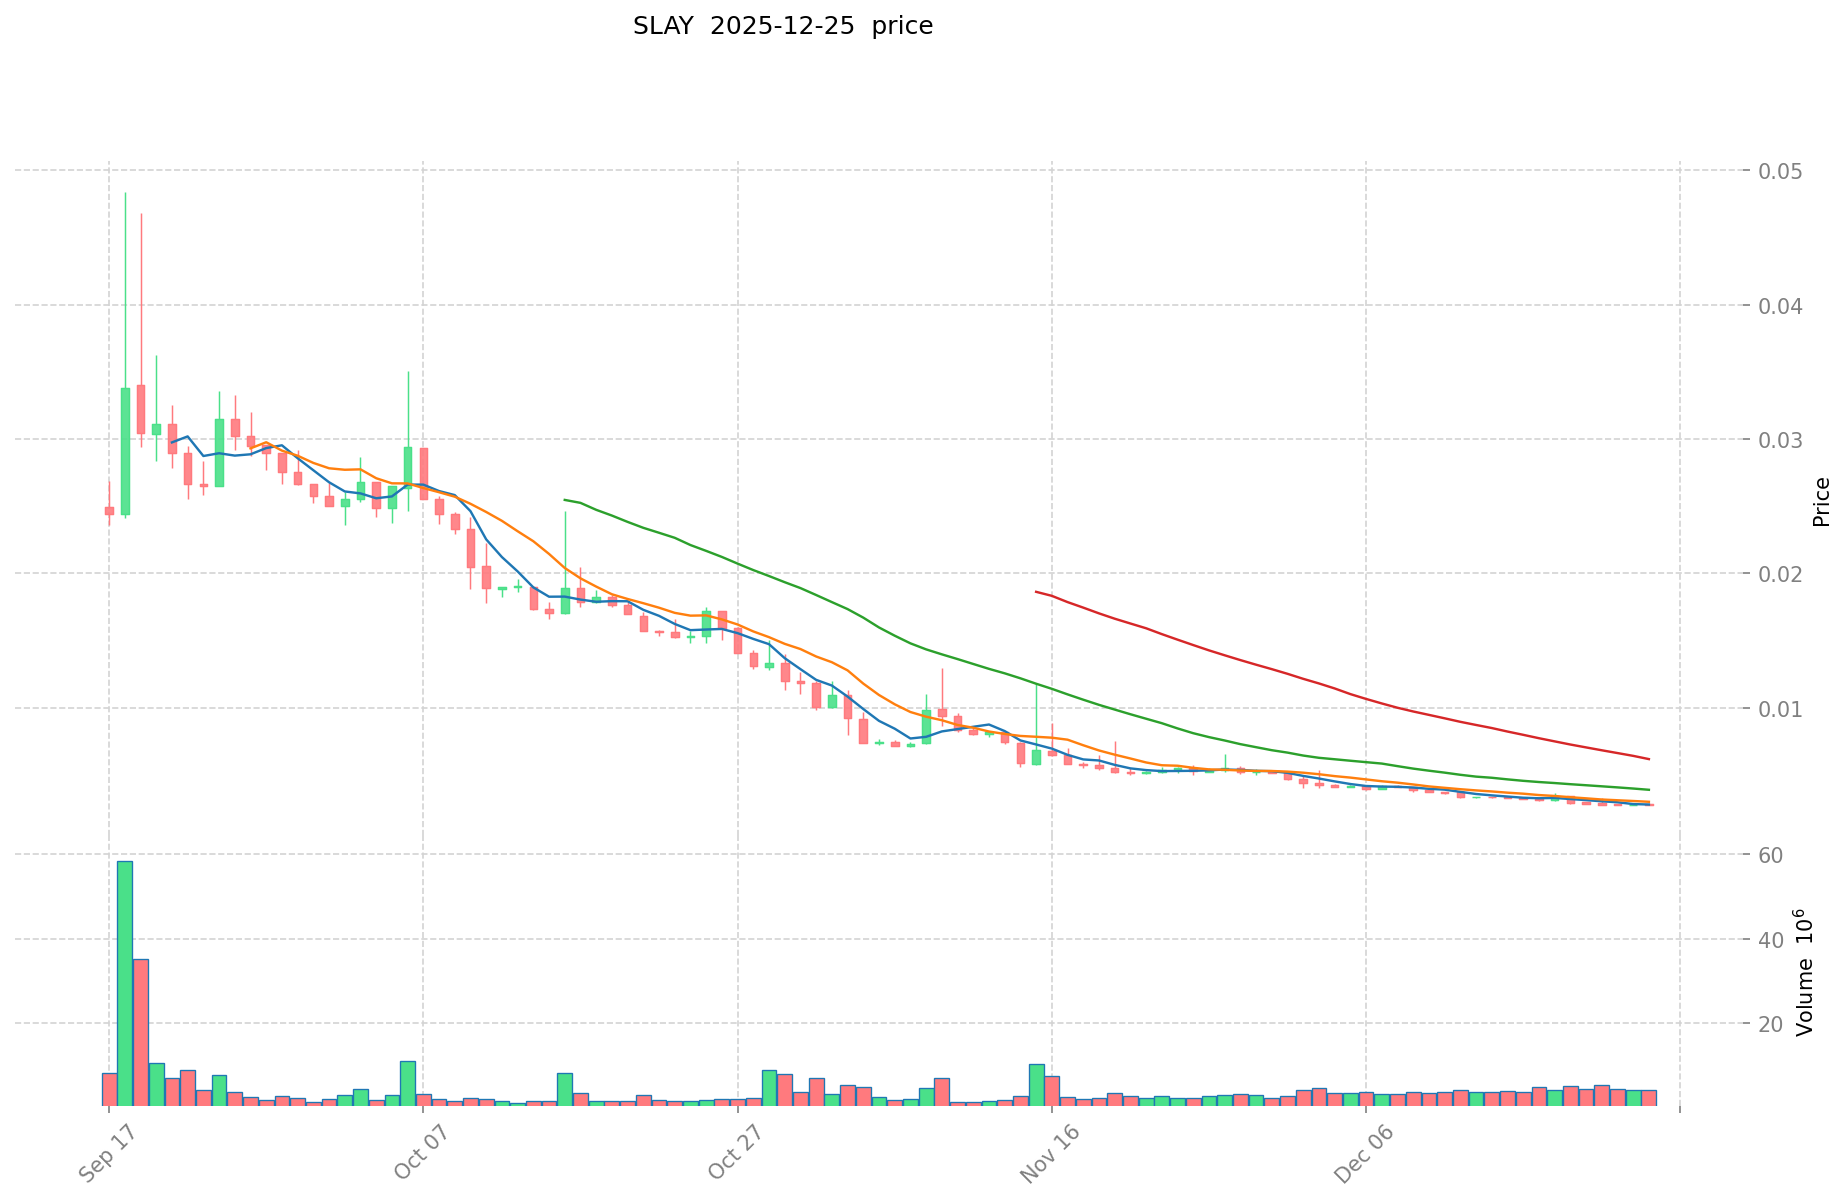
- August 2025: SLAY reached its all-time high of $0.13933 on August 11, 2025, driven by early project momentum and market enthusiasm.
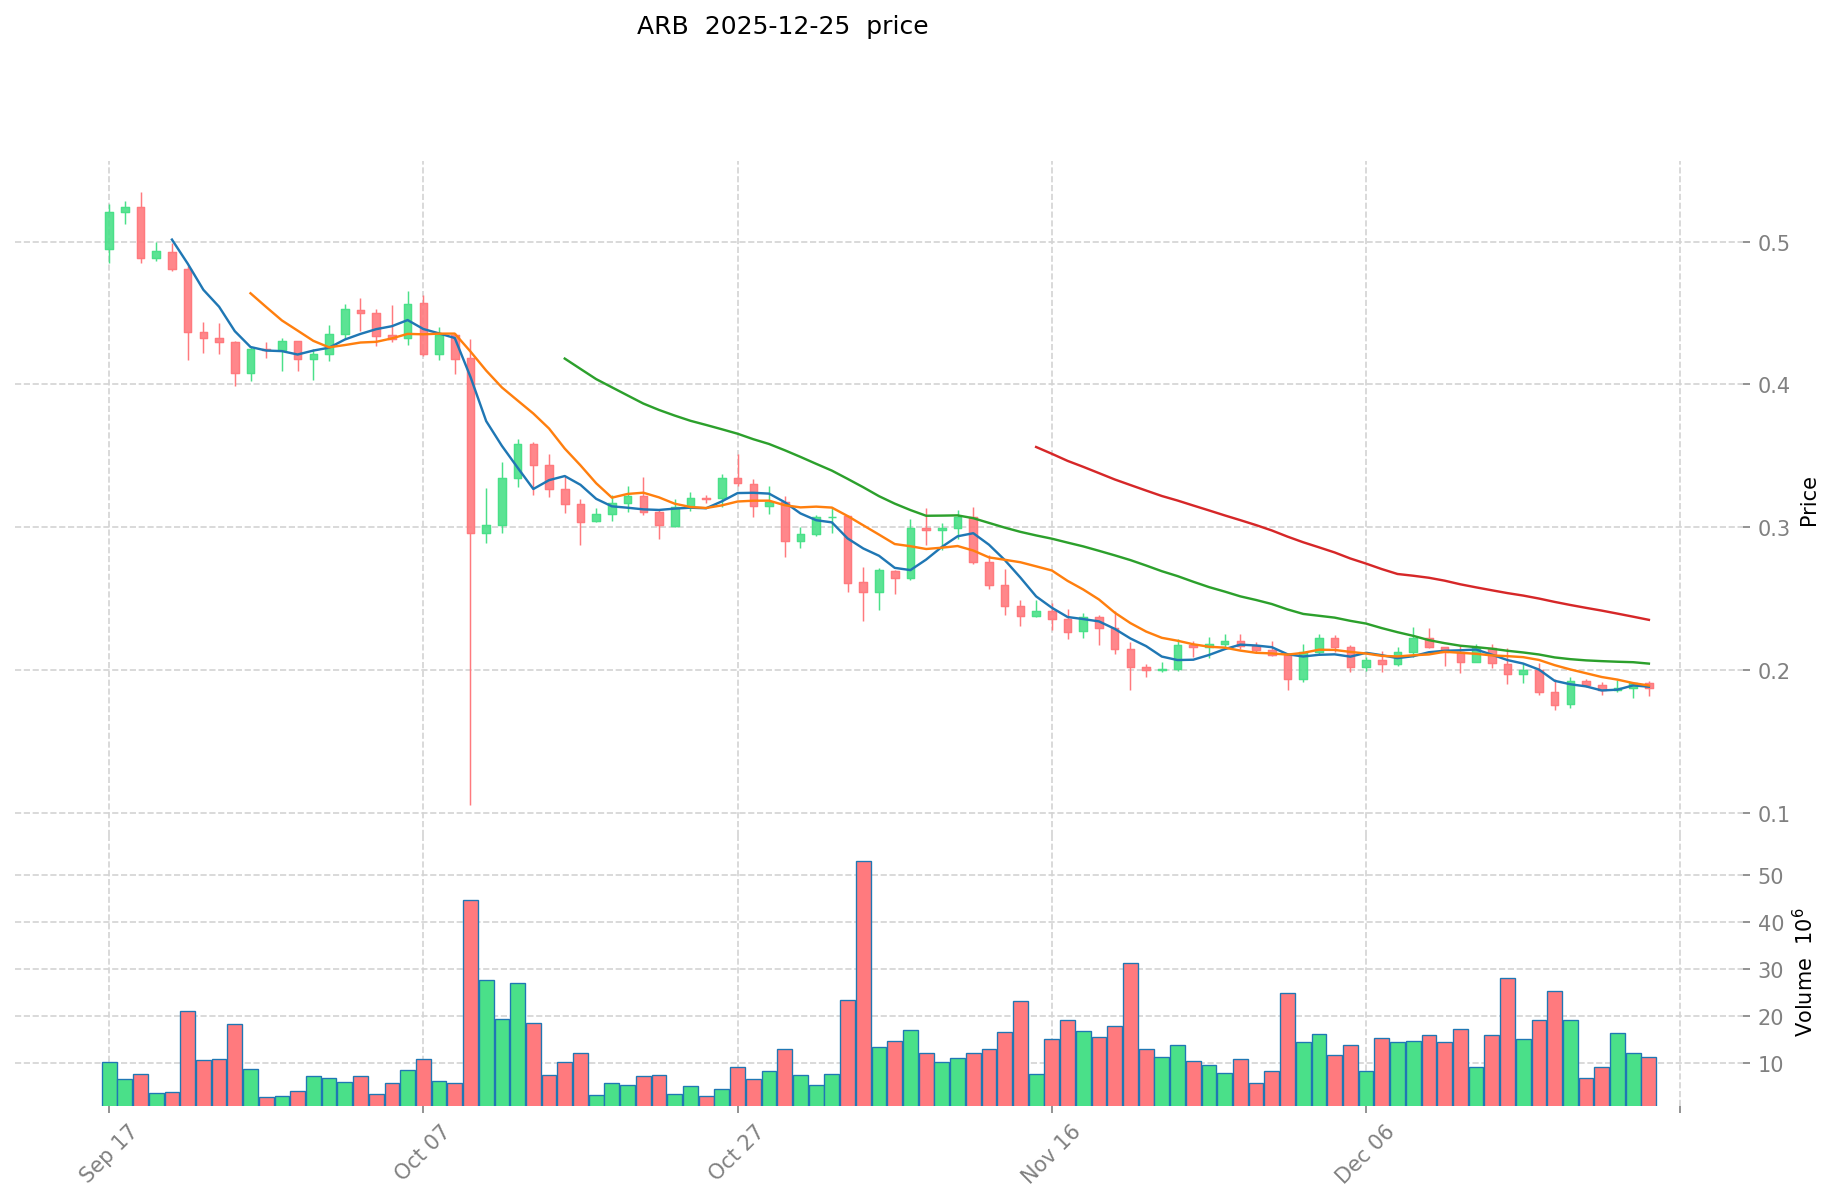
- January 2024: ARB reached its all-time high of $2.39 on January 12, 2024, reflecting strong market adoption of Ethereum's Layer 2 scaling solution.
- Comparative analysis: In the period from August 2025 to December 2025, SLAY declined from $0.13933 to $0.002711 (a 97.38% decrease), while ARB decreased from approximately $0.25 to $0.1909 (approximately 24% decline from mid-year levels), demonstrating significantly higher volatility in SLAY.
Current Market Status (December 26, 2025)
- SLAY current price: $0.00279
- ARB current price: $0.1909
- 24-hour trading volume: SLAY at $12,635.446441 vs ARB at $1,335,820.751289
- Market Emotion Index (Fear & Greed Index): 23 (Extreme Fear)
Click to view real-time prices:
- View SLAY current price Market Price
- View ARB current price Market Price
二、影响 SLAY vs ARB 投资价值的核心因素
供应机制对比(Tokenomics)
Based on the reference materials provided, specific tokenomic details for SLAY and ARB are not available in the search results. The available information only references supply mechanisms for other tokens such as LightLink (LL) with a 1 billion token cap.
To provide accurate tokenomic comparisons between SLAY and ARB, including their supply mechanisms, emission schedules, and scarcity characteristics, additional reference materials specific to these tokens would be required.
机构采用与市场应用
The reference materials do not contain specific information regarding institutional holdings, enterprise adoption, or regulatory treatment of SLAY and ARB tokens across different jurisdictions.
技术发展与生态建设
Information about SLAY and ARB's technical upgrades, development roadmaps, DeFi integration, NFT capabilities, smart contract functionality, and broader ecosystem development is not available in the provided reference materials.
宏观经济与市场周期
The reference materials do not provide comparative analysis of how SLAY and ARB perform under various macroeconomic conditions, including inflation environments, monetary policy changes, interest rate impacts, US dollar index effects, or geopolitical considerations affecting cross-border transactions.
III. 2025-2030 Price Forecast: SLAY vs ARB
Short-term Forecast (2025)
- SLAY: Conservative $0.00240026–$0.002791 | Optimistic $0.00407486
- ARB: Conservative $0.118544–$0.1912 | Optimistic $0.275328
Mid-term Forecast (2026-2028)
- SLAY could experience consolidation and gradual accumulation phases, with projected price range of $0.0026433561–$0.00528539052195
- ARB could enter growth and expansion phases, with projected price range of $0.12362992–$0.30100940562
- Key drivers: institutional capital inflows, ETF listings, ecosystem development
Long-term Forecast (2029-2030)
- SLAY: Base case $0.003049342555008–$0.004691296238475 | Optimistic scenario $0.005488816599015–$0.006362570523431
- ARB: Base case $0.2135509847394–$0.35928510270345 | Optimistic scenario $0.4299877935969–$0.413177868108967
View detailed price predictions for SLAY and ARB
SLAY:
| 年份 |
预测最高价 |
预测平均价格 |
预测最低价 |
涨跌幅 |
| 2025 |
0.00407486 |
0.002791 |
0.00240026 |
0 |
| 2026 |
0.004119516 |
0.00343293 |
0.0026433561 |
23 |
| 2027 |
0.00441818091 |
0.003776223 |
0.00279440502 |
35 |
| 2028 |
0.00528539052195 |
0.004097201955 |
0.0025402652121 |
46 |
| 2029 |
0.005488816599015 |
0.004691296238475 |
0.003049342555008 |
68 |
| 2030 |
0.006362570523431 |
0.005090056418745 |
0.003359437236371 |
82 |
ARB:
| 年份 |
预测最高价 |
预测平均价格 |
预测最低价 |
涨跌幅 |
| 2025 |
0.275328 |
0.1912 |
0.118544 |
0 |
| 2026 |
0.2449272 |
0.233264 |
0.12362992 |
22 |
| 2027 |
0.313215236 |
0.2390956 |
0.184103612 |
25 |
| 2028 |
0.30100940562 |
0.276155418 |
0.2623476471 |
44 |
| 2029 |
0.4299877935969 |
0.28858241181 |
0.2135509847394 |
51 |
| 2030 |
0.413177868108967 |
0.35928510270345 |
0.219163912649104 |
88 |
四、投资策略对比:SLAY vs ARB
长期 vs 短期投资策略
- SLAY:适合关注比特币生态创新、寻求高成长潜力的风险承受能力强的投资者,主要用于中长期配置和生态应用前景挖掘
- ARB:适合寻求相对稳定、已验证生态基础的投资者,主要用于短期交易和中期持有策略
风险管理与资产配置
- 保守型投资者:SLAY 5% vs ARB 95%
- 激进型投资者:SLAY 30% vs ARB 70%
- 对冲工具:稳定币配置、期权价差策略、跨币种组合对冲
五、潜在风险对比
市场风险
- SLAY:市场流动性严重不足(24小时交易量仅$12,635),价格波动剧烈,2025年8月至12月跌幅高达97.38%,存在严重的滑点风险和流动性风险
- ARB:交易量相对充足(24小时交易量$1,335,820),但作为以太坊Layer 2解决方案,其表现与以太坊主网状态关联紧密,存在协议级别的系统性风险
技术风险
- SLAY:作为新兴项目,技术架构验证周期短,Bitcoin经济层协议稳定性尚需长期观察,智能合约审计风险不明确
- ARB:Optimistic rollup协议需依赖验证者网络,存在验证者集中度风险和挑战期机制的潜在漏洞
监管风险
- 全球监管政策对两者的不同影响:ARB作为成熟的Layer 2解决方案,已获得更多监管部门的关注和规范框架;SLAY作为新兴比特币应用层项目,面临更多政策不确定性,特别是在涉及DeFi、RWA等创新应用时的监管变化
六、结论:Which Is the Better Buy?
📌 投资价值总结
- SLAY 优势:定位于比特币生态创新,覆盖AI、DeFi、RWA、稳定币等多个应用场景,极低的当前价格提供高倍数增长空间,预测2030年增幅达82%
- ARB 优势:以太坊Layer 2成熟解决方案,已建立稳定生态基础,交易流动性充足,价格相对稳定,预测2030年增幅达88%,风险可控性更强
✅ 投资建议
- 新手投资者:优先选择ARB,其市场流动性充足、生态成熟、风险可预期,适合建立初始仓位;建议采用定投策略降低价格波动风险
- 有经验投资者:可构建SLAY与ARB的组合策略,SLAY作为高风险高收益品种配置20-30%,ARB作为稳定品种配置70-80%,根据市场周期动态调整
- 机构投资者:ARB更适合作为主要配置对象,其流动性充足、可进行大额交易,SLAY可作为创新赛道的小额探索性投资
⚠️ 风险提示:加密货币市场波动性极高,本文不构成投资建议。SLAY当前极端流动性不足可能导致严重滑点,投资者应谨慎评估自身风险承受能力,合理配置仓位。
FAQ
SLAY和ARB分别是什么?各自的核心功能和定位有什么区别?
SLAY是杀敌策略型代币,专注市场差异化盈利。ARB是套利型代币,通过多链部署实现跨交易平台价差收益。两者定位差异在于SLAY强调市场狙击,ARB专注流动性套利。
SLAY和ARB在技术架构上有什么差异?分别采用了什么共识机制?
ARB基于Arbitrum二层方案,采用断言验证机制,继承以太坊安全性实现高效交易。SLAY具体共识机制信息有限,两者在架构设计和验证方式上存在差异。
SLAY和ARB的生态应用场景分别有哪些?哪个生态更成熟?
ARB是以太坊Layer2解决方案,生态成熟,应用涵盖DeFi、NFT、游戏等。SLAY相关信息有限。ARB生态规模更大,用户基数和项目数量均远超其他新兴项目,生态成熟度更高。
SLAY和ARB的代币经济模型如何?供应量、分配方案有什么不同?
ARB初始供应量100亿枚,年通胀率最高2%,分配多样化支持去中心化。SLAY具体经济模型数据有限,但两者均采用通胀机制平衡激励与稀缺性。
投资SLAY和ARB各自的风险是什么?哪个更适合长期持有?
SLAY处于早期阶段,流动性与生态不确定性高;ARB作为主流L2虽相对稳定,但仍面临技术迭代风险。长期持有需评估个人风险承受力,ARB生态更成熟相对更适合长期配置。
SLAY和ARB在市场表现和流动性上有什么区别?哪个更容易交易?
ARB市场流动性更强,交易额更大,价格波动相对稳定,更容易交易。SLAY交易额较小,流动性相对较弱,但作为新兴代币,增长潜力更大。
* The information is not intended to be and does not constitute financial advice or any other recommendation of any sort offered or endorsed by Gate.