Explore the rivalry between THORWallet (TITN) and BasicAttentionToken (BAT) within China's digital space. The article compares their investment value, covering historical price trends, technical ecosystems, and institutional adoption. It addresses investor concerns about which token offers better current buy opportunities while analyzing future price predictions. Suitable for new and experienced investors, it highlights potential risks and provides strategies for managing volatility. Keep informed on market status with real-time updates from Gate and evaluate the suitability of each token for your portfolio strategy.
Introduction: TITN vs BAT Investment Comparison
In the cryptocurrency market, the comparison between THORWallet (TITN) vs BasicAttentionToken (BAT) has always been an unavoidable topic for investors. The two not only have significant differences in market cap ranking, application scenarios, and price performance, but also represent different cryptocurrency positioning.
THORWallet (TITN): Since its launch, it has gained market recognition for its non-custodial DeFi wallet features and cross-chain mobile interface.
BasicAttentionToken (BAT): Introduced in 2017, it has been hailed as a solution for digital advertising, aiming to improve the efficiency of online advertising.
This article will comprehensively analyze the investment value comparison between TITN and BAT, focusing on historical price trends, supply mechanisms, institutional adoption, technological ecosystems, and future predictions, attempting to answer the question investors care about most:
"Which is the better buy right now?"
I. Price History Comparison and Current Market Status
THORWallet (TITN) and BasicAttentionToken (BAT) Historical Price Trends
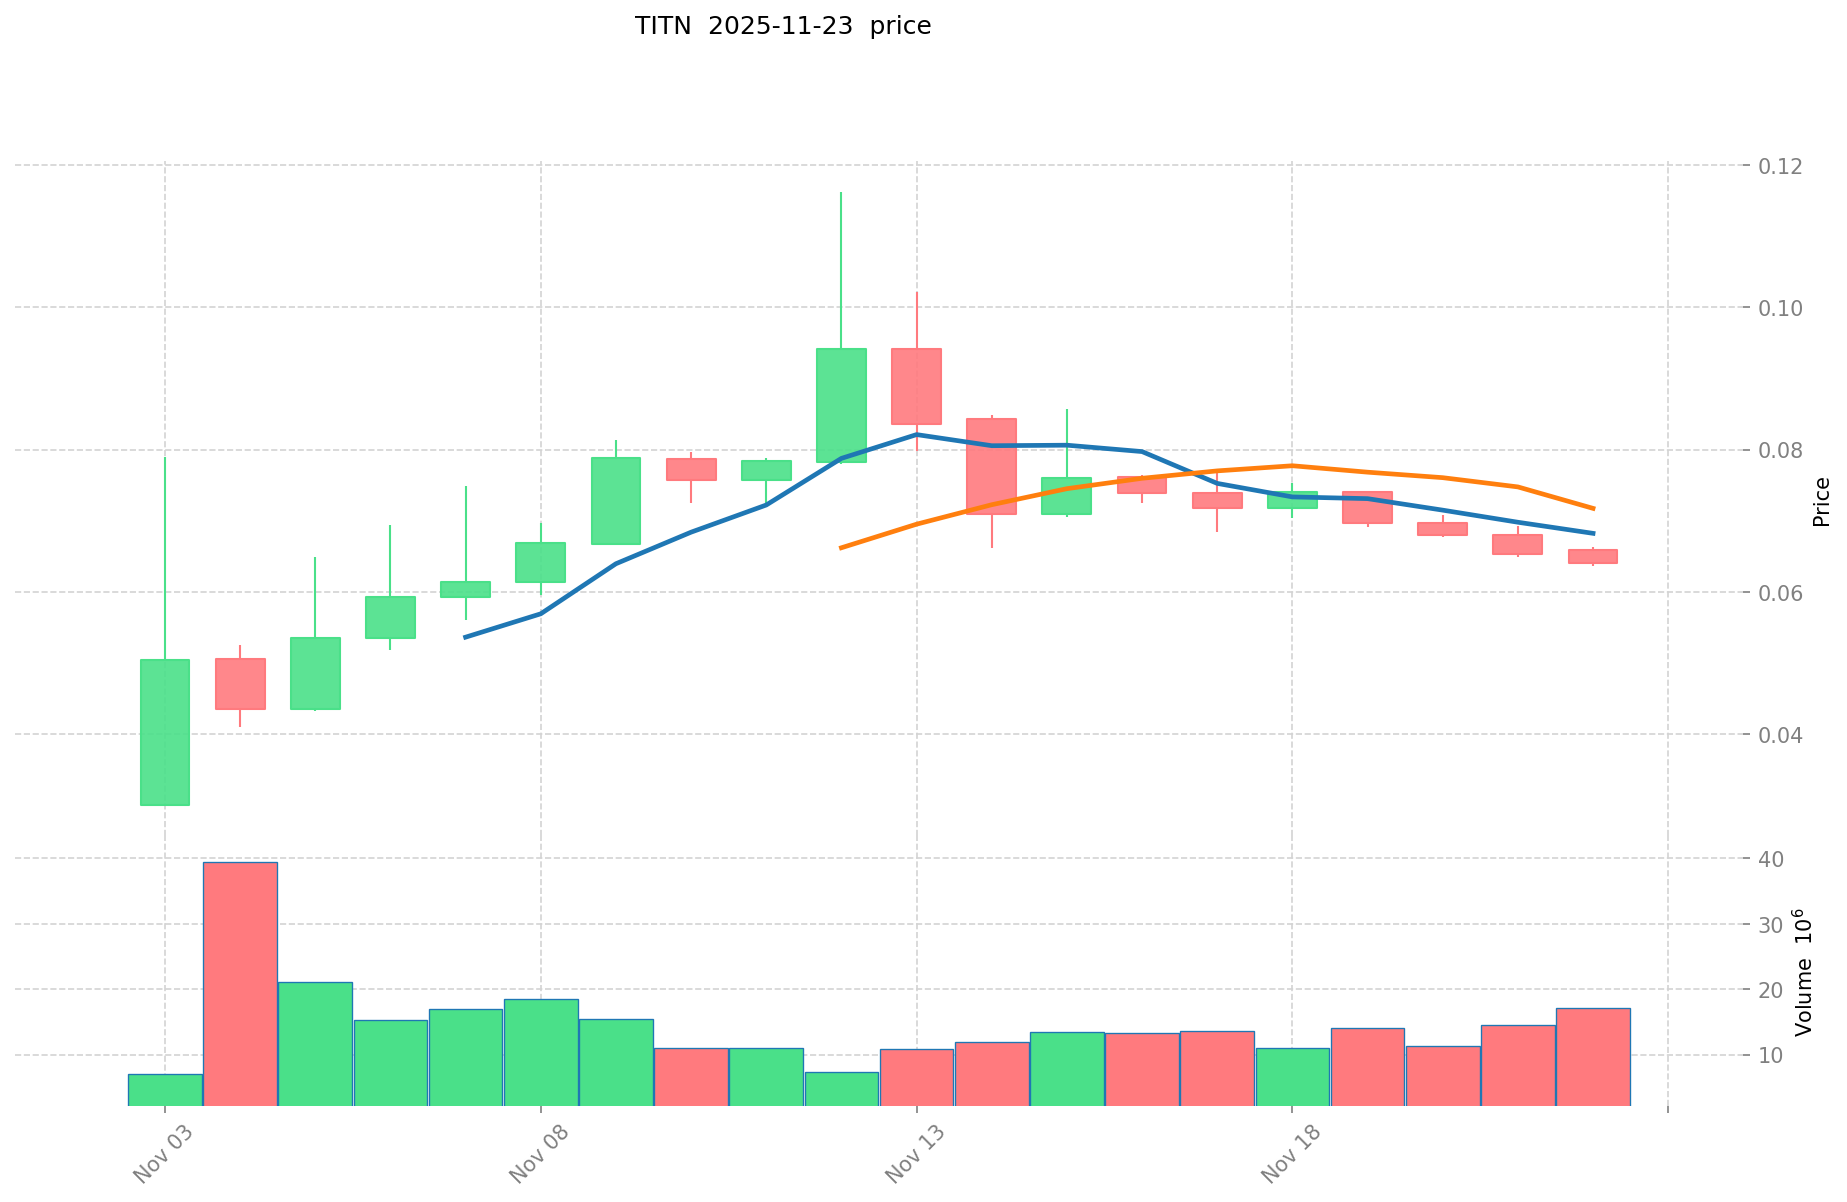
- 2025: TITN reached its all-time high of $0.11622 on November 12, and its all-time low of $0.03 on November 3.
- 2021: BAT reached its all-time high of $1.9 on November 28.
- Comparative analysis: In recent market cycles, TITN has shown significant volatility within a short period, while BAT has demonstrated a longer-term price history with its all-time high dating back to 2021.
Current Market Situation (2025-11-24)
- TITN current price: $0.06321
- BAT current price: $0.1906
- 24-hour trading volume: TITN $1,088,698.54 vs BAT $168,177.41
- Market Sentiment Index (Fear & Greed Index): 13 (Extreme Fear)
Click to view real-time prices:
- Check TITN current price Market Price
- Check BAT current price Market Price

II. Core Factors Affecting TITAN vs BAT Investment Value
Supply Mechanism Comparison (Tokenomics)
- TITAN: Fixed supply of 10,000 tokens with a deflationary model through token burns
- BAT: Total supply of 1.5 billion BAT tokens with no new tokens being created
- 📌 Historical pattern: Deflationary mechanisms like TITAN's token burns have historically driven price appreciation, while BAT's fixed but larger supply provides stability for its utility ecosystem.
Institutional Adoption and Market Applications
- Institutional holdings: BAT has gained more institutional recognition through Brave browser integration
- Enterprise adoption: BAT demonstrates stronger real-world utility in digital advertising, while TITAN has focused on DeFi applications
- Regulatory attitudes: Both tokens face varying regulatory scrutiny, with BAT's utility token status providing potentially clearer regulatory positioning
Technical Development and Ecosystem Building
- TITAN technical upgrades: Recent implementation of cross-chain integration enhancing interoperability
- BAT technical development: Continuous improvements to the Brave browser ecosystem and expansion of rewards system
- Ecosystem comparison: BAT has established a stronger foothold in digital advertising, while TITAN is positioning within DeFi applications
Macroeconomic Factors and Market Cycles
- Performance in inflationary environments: TITAN's deflationary mechanism theoretically provides better inflation resistance
- Macroeconomic monetary policy: Both tokens show correlation to broader crypto market reactions to interest rate changes
- Geopolitical factors: BAT's browser-based ecosystem offers more resilience to cross-border restrictions
III. 2025-2030 Price Prediction: TITN vs BAT
Short-term Prediction (2025)
- TITN: Conservative $0.0328 - $0.0632 | Optimistic $0.0632 - $0.0846
- BAT: Conservative $0.1120 - $0.1899 | Optimistic $0.1899 - $0.2260
Mid-term Prediction (2027)
- TITN may enter a growth phase, with an estimated price range of $0.0617 - $0.1051
- BAT may enter a consolidation phase, with an estimated price range of $0.2226 - $0.2822
- Key drivers: Institutional capital inflow, ETFs, ecosystem development
Long-term Prediction (2030)
- TITN: Base scenario $0.0614 - $0.1076 | Optimistic scenario $0.1076 - $0.1195
- BAT: Base scenario $0.2502 - $0.3427 | Optimistic scenario $0.3427 - $0.4010
View detailed price predictions for TITN and BAT
Disclaimer: The above predictions are based on historical data and market analysis. Cryptocurrency markets are highly volatile and unpredictable. These projections should not be considered as financial advice. Always conduct your own research before making investment decisions.
TITN:
| 年份 |
预测最高价 |
预测平均价格 |
预测最低价 |
涨跌幅 |
| 2025 |
0.0846478 |
0.06317 |
0.0328484 |
0 |
| 2026 |
0.078343434 |
0.0739089 |
0.037693539 |
16 |
| 2027 |
0.10505411046 |
0.076126167 |
0.06166219527 |
20 |
| 2028 |
0.0942137442792 |
0.09059013873 |
0.0860606317935 |
43 |
| 2029 |
0.122894582201118 |
0.0924019415046 |
0.057289203732852 |
46 |
| 2030 |
0.119489570656673 |
0.107648261852859 |
0.061359509256129 |
70 |
BAT:
| 年份 |
预测最高价 |
预测平均价格 |
预测最低价 |
涨跌幅 |
| 2025 |
0.225981 |
0.1899 |
0.112041 |
0 |
| 2026 |
0.309831345 |
0.2079405 |
0.19546407 |
9 |
| 2027 |
0.282185655525 |
0.2588859225 |
0.22264189335 |
35 |
| 2028 |
0.39498225195825 |
0.2705357890125 |
0.21642863121 |
41 |
| 2029 |
0.352724561714497 |
0.332759020485375 |
0.272862396798007 |
74 |
| 2030 |
0.401007895586925 |
0.342741791099936 |
0.250201507502953 |
79 |
IV. Investment Strategy Comparison: TITN vs BAT
Long-term vs Short-term Investment Strategies
- TITN: Suitable for investors focused on DeFi potential and cross-chain interoperability
- BAT: Suitable for investors interested in digital advertising ecosystems and browser-based utility tokens
Risk Management and Asset Allocation
- Conservative investors: TITN: 30% vs BAT: 70%
- Aggressive investors: TITN: 60% vs BAT: 40%
- Hedging tools: Stablecoin allocation, options, cross-token portfolio diversification
V. Potential Risk Comparison
Market Risks
- TITN: Higher volatility due to smaller market cap and newer ecosystem
- BAT: Dependency on Brave browser adoption and digital advertising market fluctuations
Technical Risks
- TITN: Scalability, network stability in cross-chain operations
- BAT: Brave browser security, token distribution system vulnerabilities
Regulatory Risks
- Global regulatory policies may have differing impacts on TITN's DeFi focus versus BAT's browser-based utility token status
VI. Conclusion: Which Is the Better Buy?
📌 Investment Value Summary:
- TITN advantages: Deflationary model, cross-chain DeFi potential, higher growth potential
- BAT advantages: Established ecosystem, real-world utility in digital advertising, broader institutional recognition
✅ Investment Advice:
- New investors: Consider a balanced approach, leaning towards BAT for its more established ecosystem
- Experienced investors: Explore a diversified portfolio with both tokens, adjusting based on risk tolerance
- Institutional investors: Evaluate BAT for its utility token status and TITN for potential DeFi sector growth
⚠️ Risk Warning: Cryptocurrency markets are highly volatile. This article does not constitute investment advice.
None
VII. FAQ
Q1: What are the main differences between TITN and BAT?
A: TITN is a non-custodial DeFi wallet token with cross-chain functionality, while BAT is a utility token for digital advertising integrated with the Brave browser. TITN has a smaller market cap and higher volatility, whereas BAT has a more established ecosystem and broader institutional recognition.
Q2: Which token has shown better price performance recently?
A: As of November 24, 2025, TITN has shown significant volatility, reaching an all-time high of $0.11622 on November 12, 2025. BAT's all-time high of $1.9 was reached earlier, on November 28, 2021. Recent performance should be evaluated in the context of broader market conditions.
Q3: How do the supply mechanisms of TITN and BAT differ?
A: TITN has a fixed supply of 10,000 tokens with a deflationary model through token burns. BAT has a total supply of 1.5 billion tokens with no new tokens being created. TITN's deflationary mechanism may potentially drive price appreciation, while BAT's larger fixed supply provides stability for its ecosystem.
Q4: What are the key factors affecting the investment value of TITN and BAT?
A: Key factors include supply mechanisms, institutional adoption, technical development, ecosystem building, and macroeconomic factors. BAT has stronger institutional recognition and real-world utility, while TITN focuses on DeFi applications and cross-chain integration.
Q5: What are the long-term price predictions for TITN and BAT?
A: By 2030, TITN is predicted to reach $0.0614 - $0.1195 in various scenarios, while BAT is expected to reach $0.2502 - $0.4010. However, these predictions are speculative and should not be considered financial advice.
Q6: How should investors approach risk management when investing in TITN and BAT?
A: Conservative investors might consider allocating 30% to TITN and 70% to BAT, while aggressive investors might opt for 60% TITN and 40% BAT. Diversification, stablecoin allocation, and options can be used as hedging tools.
Q7: What are the potential risks associated with investing in TITN and BAT?
A: TITN faces higher volatility due to its smaller market cap and newer ecosystem, as well as potential scalability issues. BAT's risks include dependency on Brave browser adoption and vulnerabilities in its token distribution system. Both tokens are subject to regulatory risks, which may impact them differently due to their distinct use cases.
* The information is not intended to be and does not constitute financial advice or any other recommendation of any sort offered or endorsed by Gate.


