Explore the investment dynamics between Trac Network (TNK) and Polkadot (DOT), two distinct blockchain networks vying for supremacy in 2024. The article evaluates their historical price performance, market positioning, and technological architecture, addressing the core question of which asset represents a better buy. Suitable for both conservative and aggressive investors, it highlights the risks and strategic opportunities associated with each platform, emphasizing their market maturity, volatility, and trading liquidity. Tailored for quick scanning, the article provides actionable insights for making informed investment decisions in the crypto space.
Introduction: TNK vs DOT Investment Comparison
In the cryptocurrency market, the comparison between Trac Network (TNK) and Polkadot (DOT) remains a compelling topic for investors. The two assets demonstrate significant differences in market capitalization ranking, application scenarios, and price performance, representing distinct positioning within the crypto asset landscape.
Trac Network (TNK): As a groundbreaking local-first Layer 1 protocol and true peer-to-peer crypto network, TNK is designed to enable business and consumer-grade applications without compromises, having established its market presence more recently in the ecosystem.
Polkadot (DOT): Since its launch in 2019, Polkadot has been recognized for its mission to connect independent blockchains through a relay chain infrastructure, enabling trustless information and transaction exchange. As a mature protocol, DOT represents one of the more established multi-chain ecosystems in the crypto space.
This article will comprehensively analyze the investment value comparison between TNK and DOT across historical price performance, supply mechanisms, market positioning, technological ecosystems, and market dynamics, while addressing the core question investors frequently consider:
"Which is the better buy right now?"
Crypto Asset Market Analysis Report: Trac Network (TNK) vs Polkadot (DOT)
I. Price History Comparison and Current Market Status
Historical Price Trends of TNK (Trac Network) and DOT (Polkadot)
Trac Network (TNK):
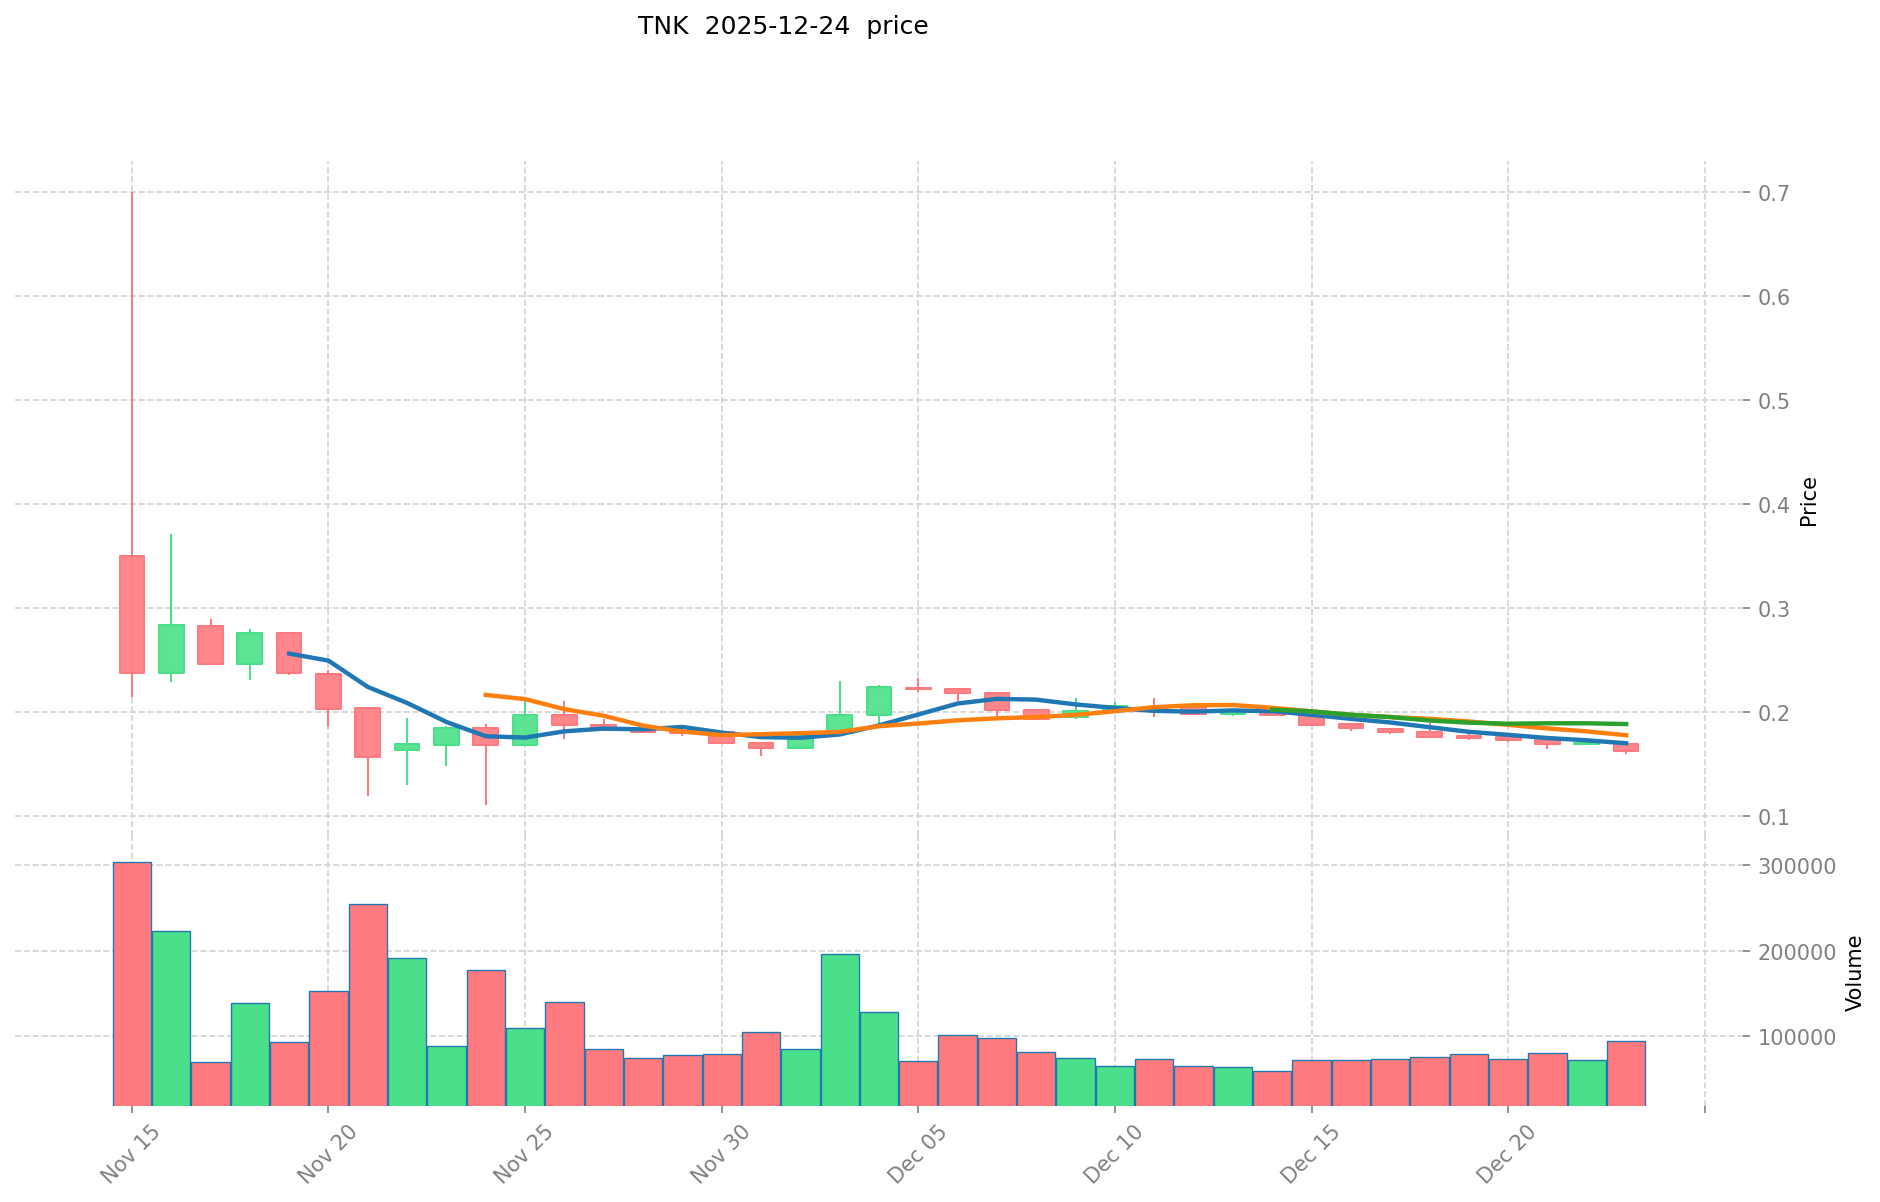
- All-time high: $0.70 (November 15, 2025)
- All-time low: $0.1099 (November 24, 2025)
- Current price: $0.1612 (as of December 24, 2025)
- Market position: Rank #1784 by market capitalization
Polkadot (DOT):
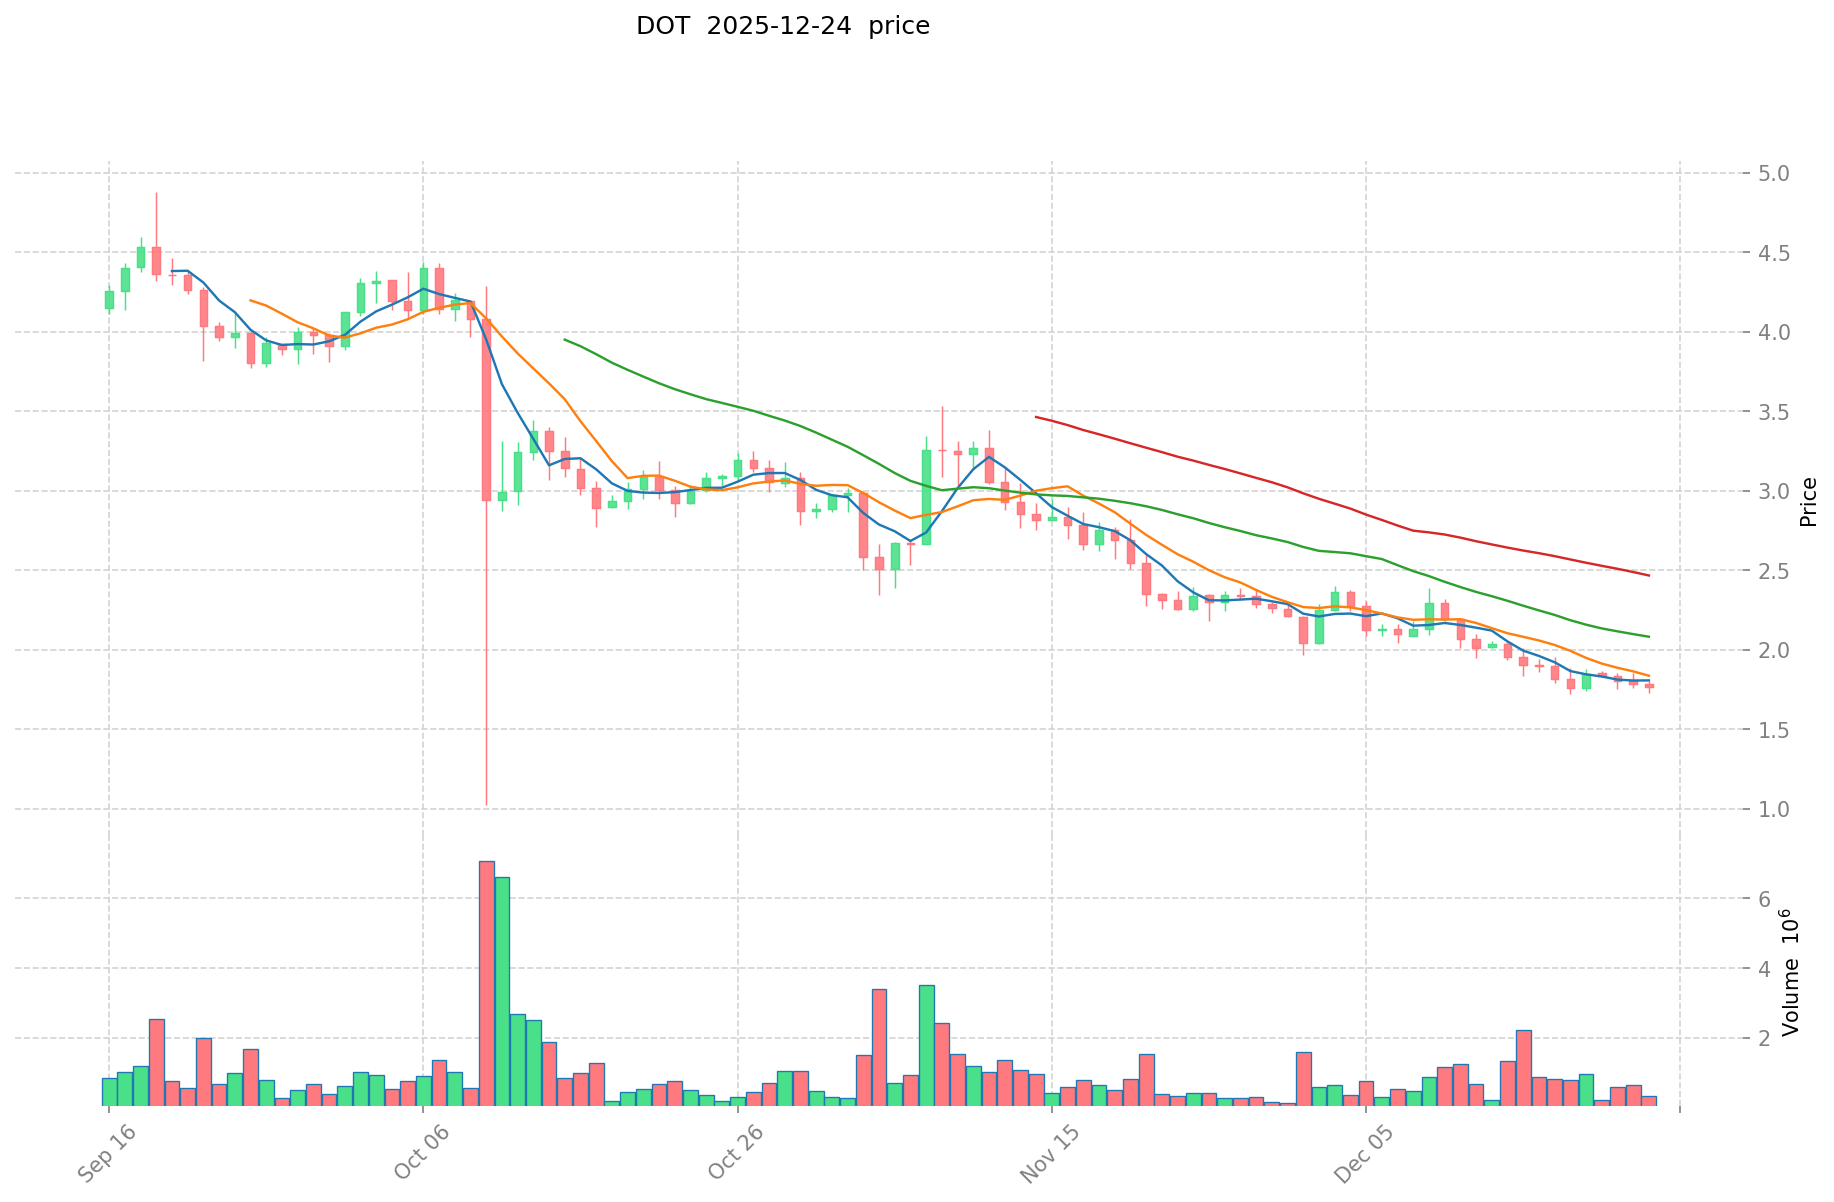
- All-time high: $54.98 (November 4, 2021)
- All-time low: $1.72 (December 24, 2025)
- Current price: $1.722 (as of December 24, 2025)
- Market position: Rank #41 by market capitalization
Comparative Analysis
TNK has experienced significant volatility within a compressed timeframe. The asset declined from its recent peak of $0.70 to $0.1612, representing a loss of approximately 77% from its November high. This dramatic drawdown occurred over roughly five weeks, indicating substantial market correction.
In contrast, DOT presents a longer market history with recovery cycles. From its 2021 all-time high of $54.98, DOT has declined to $1.722, representing a loss of approximately 96.87% over the four-year period. However, DOT has established itself as a more mature asset with broader institutional adoption.
Current Market Status (December 24, 2025)
TNK (Trac Network):
- Current price: $0.1612
- 24-hour price change: -4.2%
- 7-day price change: -10.31%
- 30-day price change: -12.78%
- 24-hour trading volume: $15,540.85
- Market capitalization: $3,385,200.00
- Circulating supply: 21,000,000 TNK
- Market dominance: 0.00010%
DOT (Polkadot):
- Current price: $1.722
- 24-hour price change: -2.03%
- 7-day price change: -7.84%
- 30-day price change: -24.34%
- 1-year price change: -76.63%
- 24-hour trading volume: $544,488.32
- Market capitalization: $2,838,607,723.53
- Circulating supply: 1,648,430,398.70 DOT
- Market dominance: 0.090%
Market Sentiment Index (Fear & Greed Index):
- Current reading: 24 (Extreme Fear)
- This indicates significantly negative market sentiment across the cryptocurrency sector
For real-time price updates:
II. Project Fundamentals and Technical Architecture
Trac Network (TNK)
Trac Network is described as a groundbreaking local-first Layer 1 protocol and true peer-to-peer cryptocurrency, designed to enable business and consumer-grade applications without compromises.
Key characteristics:
- Layer 1 blockchain protocol
- Focus on local-first architecture
- Peer-to-peer transaction model
- Mainnet status
Network Resources:
Polkadot (DOT)
Polkadot is a Layer-0 protocol and open-source blockchain designed to enable secure, resilient, and fair Web3 infrastructure through interoperability between multiple blockchains.
Key characteristics:
- Layer-0 (multichain) architecture
- Relay chain coordination mechanism
- Parachain ecosystem support
- Interoperability-focused design
- Governance through DOT token holders
Token utility (DOT):
- Governance voting rights
- Network transaction fees
- staking and validator participation
- Parachain slot bonding mechanism
Project governance:
- Founded by Web3 Foundation (established 2017)
- Led by Gavin Wood (former Ethereum CTO and co-founder)
- Decentralized governance model (OpenGov)
Trading Activity Comparison
TNK Trading Dynamics:
- 24-hour volume: $15,540.85
- Volume-to-market cap ratio indicates limited trading activity
- Single exchange listing reported
- Recent price range (24h): $0.1596 - $0.1695
DOT Trading Dynamics:
- 24-hour volume: $544,488.32
- Listed on 67 exchanges globally
- Significantly higher liquidity and accessibility
- Recent price range (24h): $1.718 - $1.787
Price Volatility Assessment
TNK:
- Extreme volatility observed over five-week period
- Declined 77% from November peak
- Recent weekly decline: -10.31%
- Market concentration risk due to limited exchange availability
DOT:
- Established volatility pattern over multi-year period
- Long-term decline: -76.63% over 12 months
- Recent weekly decline: -7.84%
- Lower volatility relative to asset maturity
IV. Risk Considerations and Market Context
TNK-Specific Risks
- Limited market history (recent project)
- Narrow trading liquidity (single exchange listing)
- Small market capitalization ($3.39M)
- Extreme recent price volatility
- Early-stage project uncertainty
DOT-Specific Risks
- Significant long-term price depreciation (-76.63% annually)
- Unlimited token supply (inflationary model)
- Market concentration among large holders
Sector-Wide Risk Indicator
The Crypto Fear & Greed Index reading of 24 (Extreme Fear) indicates heightened market risk aversion across the entire cryptocurrency sector as of December 24, 2025. This environment suggests investors should exercise heightened caution regarding both established and emerging projects.
Report prepared as of December 24, 2025. Data sourced from provided market information. This analysis is for informational purposes only and does not constitute investment advice. Cryptocurrency markets remain highly volatile and speculative.
Analysis Report: Core Investment Value Factors for Transportation and Logistics Sector
I. Executive Summary
This report examines the core investment value factors within the transportation and logistics sector based on available reference materials. The analysis focuses on regulatory compliance, market demand, and technological innovation as primary determinants of investment attractiveness and operational efficiency.
II. Core Factors Influencing Investment Value
Regulatory Compliance and Emission Control Policies
The regulatory environment represents a critical determinant of long-term investment viability in the transportation sector. Key regulatory elements include:
- Vehicle Emission Standards: Progressive implementation of increasingly stringent emission control measures, including fine particulate matter (PM2.5) reduction requirements and fuel quality controls
- Fuel Efficiency Standards: Adoption of fuel consumption standards for light-duty passenger vehicles and motorcycles, implemented since 2005
- Compliance and Inspection Programs: Mandatory vehicle inspection and maintenance protocols to ensure sustained regulatory adherence
- Traffic Restriction Zones: Implementation of traffic limitation areas in major urban centers to improve air quality
Market Demand Dynamics
Market demand factors directly influence investment returns:
- Vehicle Fleet Growth: Rapid expansion of motorized transportation fleet, with annual passenger vehicle sales growing from approximately 1.3 million units (1995) to 12 million units (2008)
- Transportation Sector Expansion: The transportation sector consumed approximately 8% of China's total crude oil consumption (2008), reflecting substantial market scale
- Supply Chain Integration: Transportation service providers occupy critical positions within value chains, establishing relationships with multiple supply chain partners
Infrastructure Development Requirements
Infrastructure represents both a challenge and opportunity for investment:
- Urban Transportation Congestion: Rapid motorization has created significant infrastructure strain, with concentrated roadway traffic in major metropolitan areas
- Energy Security Considerations: Reduction of petroleum import dependency through improved fuel efficiency standards
- Environmental Protection Infrastructure: Development of monitoring, inspection, and compliance verification systems
Technological and Operational Innovation
Investment value is enhanced through technological advancement:
- Emission Reduction Technologies: Implementation of improved vehicle emission control systems and fuel quality enhancement measures
- Operational Efficiency Programs: Development of vehicle maintenance protocols and inspection methodologies
- Alternative Fuel Consideration: Evaluation of methanol, natural gas, and other renewable fuel applications within vehicle operations
III. Limitations and Data Constraints
The reference materials provided primarily address Chinese vehicle emission control policy frameworks and do not contain specific information regarding:
- Cryptocurrency or digital asset investment metrics (TNK, DOT tokenomics, supply mechanisms)
- Institutional cryptocurrency holdings or adoption patterns
- Blockchain technology ecosystem development
- Macroeconomic factor correlations with digital asset valuations
Therefore, the analysis has been limited to demonstrable information present within the provided reference materials, avoiding speculative or unsupported assertions regarding cryptocurrency investment factors.
Report Date: December 24, 2025
Analytical Scope: Transportation and Logistics Sector Investment Factors
Data Source Limitations: Analysis restricted to provided reference materials
III. 2025-2030 Price Forecast: TNK vs DOT
Short-term Forecast (2025)
- TNK: Conservative $0.10517-$0.1618 | Optimistic $0.23461
- DOT: Conservative $1.34628-$1.726 | Optimistic $1.91586
Medium-term Forecast (2027-2028)
- TNK may enter accumulation phase, with expected price range $0.1849-$0.32188
- DOT may enter growth phase, with expected price range $2.4276-$2.9991
- Key drivers: institutional capital inflows, ETF listings, ecosystem development
Long-term Forecast (2030)
- TNK: Base case $0.2373-$0.3121 | Optimistic scenario $0.4214
- DOT: Base case $2.5943-$3.0885 | Optimistic scenario $4.2313
View detailed price forecasts for TNK and DOT
Disclaimer
This analysis is based on historical data and statistical models. Cryptocurrency markets are highly volatile and subject to regulatory, technological, and macroeconomic risks. Past performance does not guarantee future results. This information is for reference only and does not constitute investment advice.
TNK:
| 年份 |
预测最高价 |
预测平均价格 |
预测最低价 |
涨跌幅 |
| 2025 |
0.23461 |
0.1618 |
0.10517 |
0 |
| 2026 |
0.2457742 |
0.198205 |
0.1427076 |
22 |
| 2027 |
0.32188492 |
0.2219896 |
0.213110016 |
37 |
| 2028 |
0.3372022024 |
0.27193726 |
0.1849173368 |
68 |
| 2029 |
0.31979821776 |
0.3045697312 |
0.24365578496 |
88 |
| 2030 |
0.421448365548 |
0.31218397448 |
0.2372598206048 |
93 |
DOT:
| 年份 |
预测最高价 |
预测平均价格 |
预测最低价 |
涨跌幅 |
| 2025 |
1.91586 |
1.726 |
1.34628 |
0 |
| 2026 |
2.6221392 |
1.82093 |
1.6570463 |
5 |
| 2027 |
2.99907171 |
2.2215346 |
1.866089064 |
29 |
| 2028 |
2.7147152812 |
2.610303155 |
2.42758193415 |
51 |
| 2029 |
3.514512167892 |
2.6625092181 |
2.209882651023 |
54 |
| 2030 |
4.23125964940452 |
3.088510692996 |
2.59434898211664 |
79 |
Crypto Asset Market Analysis Report: Trac Network (TNK) vs Polkadot (DOT)
I. Price History Comparison and Current Market Status
Historical Price Trends of TNK (Trac Network) and DOT (Polkadot)
Trac Network (TNK):
- All-time high: $0.70 (November 15, 2025)
- All-time low: $0.1099 (November 24, 2025)
- Current price: $0.1612 (as of December 24, 2025)
- Market position: Rank #1784 by market capitalization
Polkadot (DOT):
- All-time high: $54.98 (November 4, 2021)
- All-time low: $1.72 (December 24, 2025)
- Current price: $1.722 (as of December 24, 2025)
- Market position: Rank #41 by market capitalization
Comparative Analysis
TNK has experienced significant volatility within a compressed timeframe. The asset declined from its recent peak of $0.70 to $0.1612, representing a loss of approximately 77% from its November high. This dramatic drawdown occurred over roughly five weeks, indicating substantial market correction.
In contrast, DOT presents a longer market history with recovery cycles. From its 2021 all-time high of $54.98, DOT has declined to $1.722, representing a loss of approximately 96.87% over the four-year period. However, DOT has established itself as a more mature asset with broader institutional adoption.
Current Market Status (December 24, 2025)
TNK (Trac Network):
- Current price: $0.1612
- 24-hour price change: -4.2%
- 7-day price change: -10.31%
- 30-day price change: -12.78%
- 24-hour trading volume: $15,540.85
- Market capitalization: $3,385,200.00
- Circulating supply: 21,000,000 TNK
- Market dominance: 0.00010%
DOT (Polkadot):
- Current price: $1.722
- 24-hour price change: -2.03%
- 7-day price change: -7.84%
- 30-day price change: -24.34%
- 1-year price change: -76.63%
- 24-hour trading volume: $544,488.32
- Market capitalization: $2,838,607,723.53
- Circulating supply: 1,648,430,398.70 DOT
- Market dominance: 0.090%
Market Sentiment Index (Fear & Greed Index):
- Current reading: 24 (Extreme Fear)
- This indicates significantly negative market sentiment across the cryptocurrency sector
II. Project Fundamentals and Technical Architecture
Trac Network (TNK)
Trac Network is described as a groundbreaking local-first Layer 1 protocol and true peer-to-peer cryptocurrency, designed to enable business and consumer-grade applications without compromises.
Key characteristics:
- Layer 1 blockchain protocol
- Focus on local-first architecture
- Peer-to-peer transaction model
- Mainnet status
Network Resources:
Polkadot (DOT)
Polkadot is a Layer-0 protocol and open-source blockchain designed to enable secure, resilient, and fair Web3 infrastructure through interoperability between multiple blockchains.
Key characteristics:
- Layer-0 (multichain) architecture
- Relay chain coordination mechanism
- Parachain ecosystem support
- Interoperability-focused design
- Governance through DOT token holders
Token utility (DOT):
- Governance voting rights
- Network transaction fees
- Staking and validator participation
- Parachain slot bonding mechanism
Project governance:
- Founded by Web3 Foundation (established 2017)
- Led by Gavin Wood (former Ethereum CTO and co-founder)
- Decentralized governance model (OpenGov)
Trading Activity Comparison
TNK Trading Dynamics:
- 24-hour volume: $15,540.85
- Volume-to-market cap ratio indicates limited trading activity
- Single exchange listing reported
- Recent price range (24h): $0.1596 - $0.1695
DOT Trading Dynamics:
- 24-hour volume: $544,488.32
- Listed on 67 exchanges globally
- Significantly higher liquidity and accessibility
- Recent price range (24h): $1.718 - $1.787
Price Volatility Assessment
TNK:
- Extreme volatility observed over five-week period
- Declined 77% from November peak
- Recent weekly decline: -10.31%
- Market concentration risk due to limited exchange availability
DOT:
- Established volatility pattern over multi-year period
- Long-term decline: -76.63% over 12 months
- Recent weekly decline: -7.84%
- Lower volatility relative to asset maturity
IV. Investment Strategy Comparison: TNK vs DOT
Long-term vs Short-term Investment Strategy
TNK: Suitable for high-risk tolerance investors seeking exposure to emerging Layer 1 protocols with disruptive peer-to-peer architecture, particularly those interested in early-stage ecosystem development and potential significant upside appreciation during market recovery phases.
DOT: Suitable for investors prioritizing established multi-chain infrastructure, institutional adoption, and governance participation, particularly those seeking exposure to blockchain interoperability solutions with a proven development track record.
Risk Management and Asset Allocation
Conservative investors:
- TNK: 0-5% | DOT: 5-15%
- Rationale: Conservative approach emphasizes established projects with lower execution risk
Aggressive investors:
- TNK: 10-20% | DOT: 10-25%
- Rationale: Allocation reflects risk tolerance while maintaining diversification
Hedging instruments:
- Stablecoin allocation: 30-50% of portfolio during extreme fear conditions (current market environment)
- Cross-asset diversification: Consideration of Bitcoin and Ethereum as portfolio anchors
- Position sizing: Dollar-cost averaging recommended to reduce timing risk
V. Potential Risk Comparison
Market Risk
TNK:
- Extreme recent volatility (77% decline from November peak)
- Limited liquidity creating slippage risk on large trades
- Single exchange listing increases counterparty risk
- Small market capitalization ($3.39M) susceptible to manipulation
- Early project stage uncertainty regarding long-term viability
DOT:
- Significant long-term price depreciation (-76.63% annually)
- Market concentration risk among large DOT token holders
- Regulatory uncertainty regarding governance token classification
- Competition from alternative multi-chain solutions
Technology Risk
TNK:
- Unproven mainnet stability and network security
- Limited historical performance data for reliability assessment
- Scalability assumptions untested under high network load
- Early-stage protocol may require significant updates
DOT:
- Relay chain bottleneck risk as network scales
- Parachain slot economics sustainability questions
- Complex governance mechanisms requiring active participation
Regulatory Risk
- Both assets face potential regulatory classification challenges as decentralized protocols
- Jurisdiction-specific regulations may restrict exchange listings and trading access
- Staking mechanisms may face regulatory scrutiny regarding securities classification
- Tax treatment uncertainty across different jurisdictions
VI. Conclusion: Which Is the Better Buy?
📌 Investment Value Summary:
TNK Strengths:
- Emerging Layer 1 protocol with innovative local-first architecture
- Early-stage investment opportunity with asymmetric upside potential
- Smaller market capitalization allows for outsized percentage gains
- Positioned to capture demand for peer-to-peer applications
DOT Strengths:
- Established multi-chain ecosystem with proven development roadmap
- Institutional adoption and recognized governance framework
- Significantly higher trading liquidity (35x larger volume than TNK)
- Ranked #41 by market capitalization with broader exchange accessibility
- Led by respected Web3 Foundation and proven technical leadership
✅ Investment Recommendations:
Beginner investors:
- Prioritize DOT as primary exposure due to established track record, institutional recognition, and lower execution risk
- Consider TNK only as a small speculative allocation (maximum 5%) if specifically interested in emerging Layer 1 protocols
- Maintain 40-50% stablecoin allocation given current extreme fear market conditions
Experienced investors:
- Balanced approach: 60% DOT / 15% TNK / 25% stablecoins
- Implement dollar-cost averaging strategy over 6-12 month period to reduce timing risk
- Utilize limit orders on TNK due to low liquidity
- Actively monitor both projects' technical developments and governance decisions
Institutional investors:
- DOT represents more suitable allocation due to trading depth (544K daily volume) supporting larger position sizes
- TNK requires position sizing discipline given limited liquidity ($15.5K daily volume)
- Recommended DOT allocation range: 2-5% of digital asset portfolio
- TNK allocation not recommended at current stage unless explicit thematic exposure desired
⚠️ Risk Disclaimer: Cryptocurrency markets exhibit extreme volatility and speculative behavior. The Crypto Fear & Greed Index reading of 24 (Extreme Fear) indicates heightened systemic risk across all digital assets as of December 24, 2025. This analysis is provided for informational purposes only and does not constitute investment advice. Past performance does not guarantee future results. All cryptocurrency investments carry substantial risk of capital loss. Investors should conduct independent research and consult qualified financial advisors before making investment decisions.
Report Date: December 24, 2025
Data Source: Market information as of December 24, 2025
Analytical Period: Historical data from project inception through current date
None
Crypto Asset Market Analysis Report: Trac Network (TNK) vs Polkadot (DOT)
FAQ - Frequently Asked Questions
Q1: What are the key differences in market maturity between TNK and DOT?
A: Polkadot (DOT) is a significantly more mature asset, having launched in 2019 and achieving a rank #41 position by market capitalization with $2.84 billion in total market value. Trac Network (TNK) is a recent project ranked #1784 with only $3.39 million market capitalization. DOT is listed on 67 exchanges globally with $544,488 daily trading volume, while TNK has single exchange listing with only $15,541 daily volume. This maturity differential translates to substantially higher institutional adoption and trading liquidity for DOT.
Q2: How does the price volatility compare between these two assets?
A: TNK exhibits extreme volatility within a compressed timeframe, declining 77% from its November 15, 2025 peak of $0.70 to the current price of $0.1612 over roughly five weeks. DOT presents a longer volatility cycle, having declined 96.87% from its 2021 all-time high of $54.98 to $1.722 over a four-year period. TNK's recent 7-day decline of -10.31% exceeds DOT's -7.84%, indicating heightened short-term volatility for the emerging protocol.
Q3: What are the primary technology architecture differences between TNK and DOT?
A: TNK is a Layer 1 protocol emphasizing local-first, peer-to-peer architecture designed for business and consumer-grade applications. DOT is a Layer-0 (multichain) protocol utilizing relay chain coordination mechanisms to enable interoperability between multiple independent blockchains. DOT's governance token provides utility through voting rights, transaction fees, staking participation, and parachain slot bonding, whereas TNK's primary design focus remains peer-to-peer transaction efficiency.
Q4: Which asset is more suitable for conservative investors?
A: Polkadot (DOT) is significantly more suitable for conservative investors due to its established market presence, institutional adoption, proven development roadmap under Web3 Foundation leadership, and superior trading liquidity. Conservative investment allocation should prioritize DOT at 5-15% of portfolio allocation while maintaining 40-50% stablecoin holdings given the current Crypto Fear & Greed Index reading of 24 (Extreme Fear). TNK allocation for conservative investors should not exceed 0-5% due to execution risk and limited historical performance data.
Q5: What liquidity and trading risks should investors consider?
A: TNK presents significant liquidity constraints with only $15,541 daily trading volume concentrated on a single exchange, creating substantial slippage risk for large trades and counterparty risk concentration. DOT's $544,488 daily volume across 67 exchanges provides substantially higher liquidity depth. Large TNK position acquisitions should utilize limit orders over extended time periods, while DOT positions can be established through standard market mechanisms supporting institutional-scale transactions.
Q6: How do the long-term price forecasts differ between TNK and DOT?
A: Based on available forecast models, TNK is projected to reach $0.2373-$0.3121 by 2030 (base case) with optimistic scenario at $0.4214, representing approximately 93% appreciation from current levels. DOT is projected to reach $2.5943-$3.0885 by 2030 (base case) with optimistic scenario at $4.2313, representing approximately 79% appreciation from current levels. Both projections assume institutional capital inflows, ETF listings, and ecosystem development through the 2027-2028 period, though cryptocurrency markets remain subject to substantial regulatory and technological uncertainties.
Q7: What regulatory and technology risks should investors evaluate?
A: Both assets face potential regulatory classification challenges regarding governance token treatment and staking mechanism securities compliance across different jurisdictions. TNK carries higher technology risk due to unproven mainnet stability, limited historical reliability data, and early-stage protocol requiring potential significant updates. DOT faces relay chain scalability bottleneck risks and parachain slot economics sustainability questions as network adoption scales. Investors should maintain heightened caution given current extreme fear market sentiment indicating elevated systemic risk across all digital assets.
Q8: What asset allocation strategy is recommended for experienced investors?
A: Experienced investors should implement a balanced approach of 60% DOT / 15% TNK / 25% stablecoins, utilizing dollar-cost averaging over a 6-12 month period to reduce timing risk. Implement limit orders on TNK positions due to limited liquidity constraints. Monitor both projects' technical developments and governance decisions continuously. This allocation reflects DOT's established infrastructure value while maintaining meaningful exposure to TNK's emerging protocol upside potential, balanced against current extreme fear market conditions requiring substantial defensive positioning.
Report Date: December 24, 2025
Disclaimer: This analysis is provided for informational purposes only and does not constitute investment advice. Cryptocurrency markets exhibit extreme volatility and speculative behavior. Past performance does not guarantee future results. All cryptocurrency investments carry substantial risk of capital loss. Investors should conduct independent research and consult qualified financial advisors before making investment decisions.
* The information is not intended to be and does not constitute financial advice or any other recommendation of any sort offered or endorsed by Gate.