This comprehensive guide compares USUAL and GRT, two distinct tokens in the blockchain ecosystem with fundamentally different purposes. USUAL, a decentralized fiat-backed stablecoin launched in December 2024, ranks 564th with a 44.84 million USD market cap, while GRT, an established data indexing protocol since 2020, holds the 149th position with 402.29 million USD market cap. Both tokens have experienced significant volatility, declining approximately 98% from their respective peaks. The article analyzes price trends, supply mechanisms, institutional adoption, technological ecosystems, and provides price forecasts through 2031. Investment strategies vary by risk tolerance: conservative investors may allocate 70-80% to GRT, while aggressive investors might consider 50-60% to USUAL. Key considerations include market liquidity, regulatory risks, and token utility differences. This analysis helps investors understand which asset aligns with their investment objectives and risk profiles.
Introduction: USUAL vs GRT Investment Comparison
In the cryptocurrency market, the comparison between USUAL and GRT has become a focal point for investors. Both assets demonstrate distinct differences in market cap ranking, use cases, and price performance, representing different positioning within the crypto ecosystem.
USUAL: Launched in December 2024, this project has positioned itself as a secure, decentralized fiat-backed stablecoin issuer that redistributes ownership and value through its native token, aiming to reshape the stablecoin landscape.
GRT (The Graph): Since its launch in December 2020, it has been recognized as a decentralized protocol for indexing and querying blockchain data, primarily serving the Ethereum ecosystem and making on-chain data accessible through open APIs.
This article will analyze the investment value comparison between USUAL and GRT across multiple dimensions including historical price trends, supply mechanisms, institutional adoption, technological ecosystem, and future outlook, attempting to address the question investors care about most:
"Which represents the better investment opportunity at this moment?"
As of January 20, 2026, USUAL ranks 564th with a market cap of approximately 44.84 million USD, while GRT holds the 149th position with a market cap of around 402.29 million USD. Both tokens have experienced significant volatility, with USUAL showing a 24-hour decline of 9.22% and GRT declining 11.23%. Understanding their fundamental differences, market positioning, and risk-return profiles becomes essential for making informed investment decisions in the current market environment.
I. Historical Price Comparison and Current Market Status
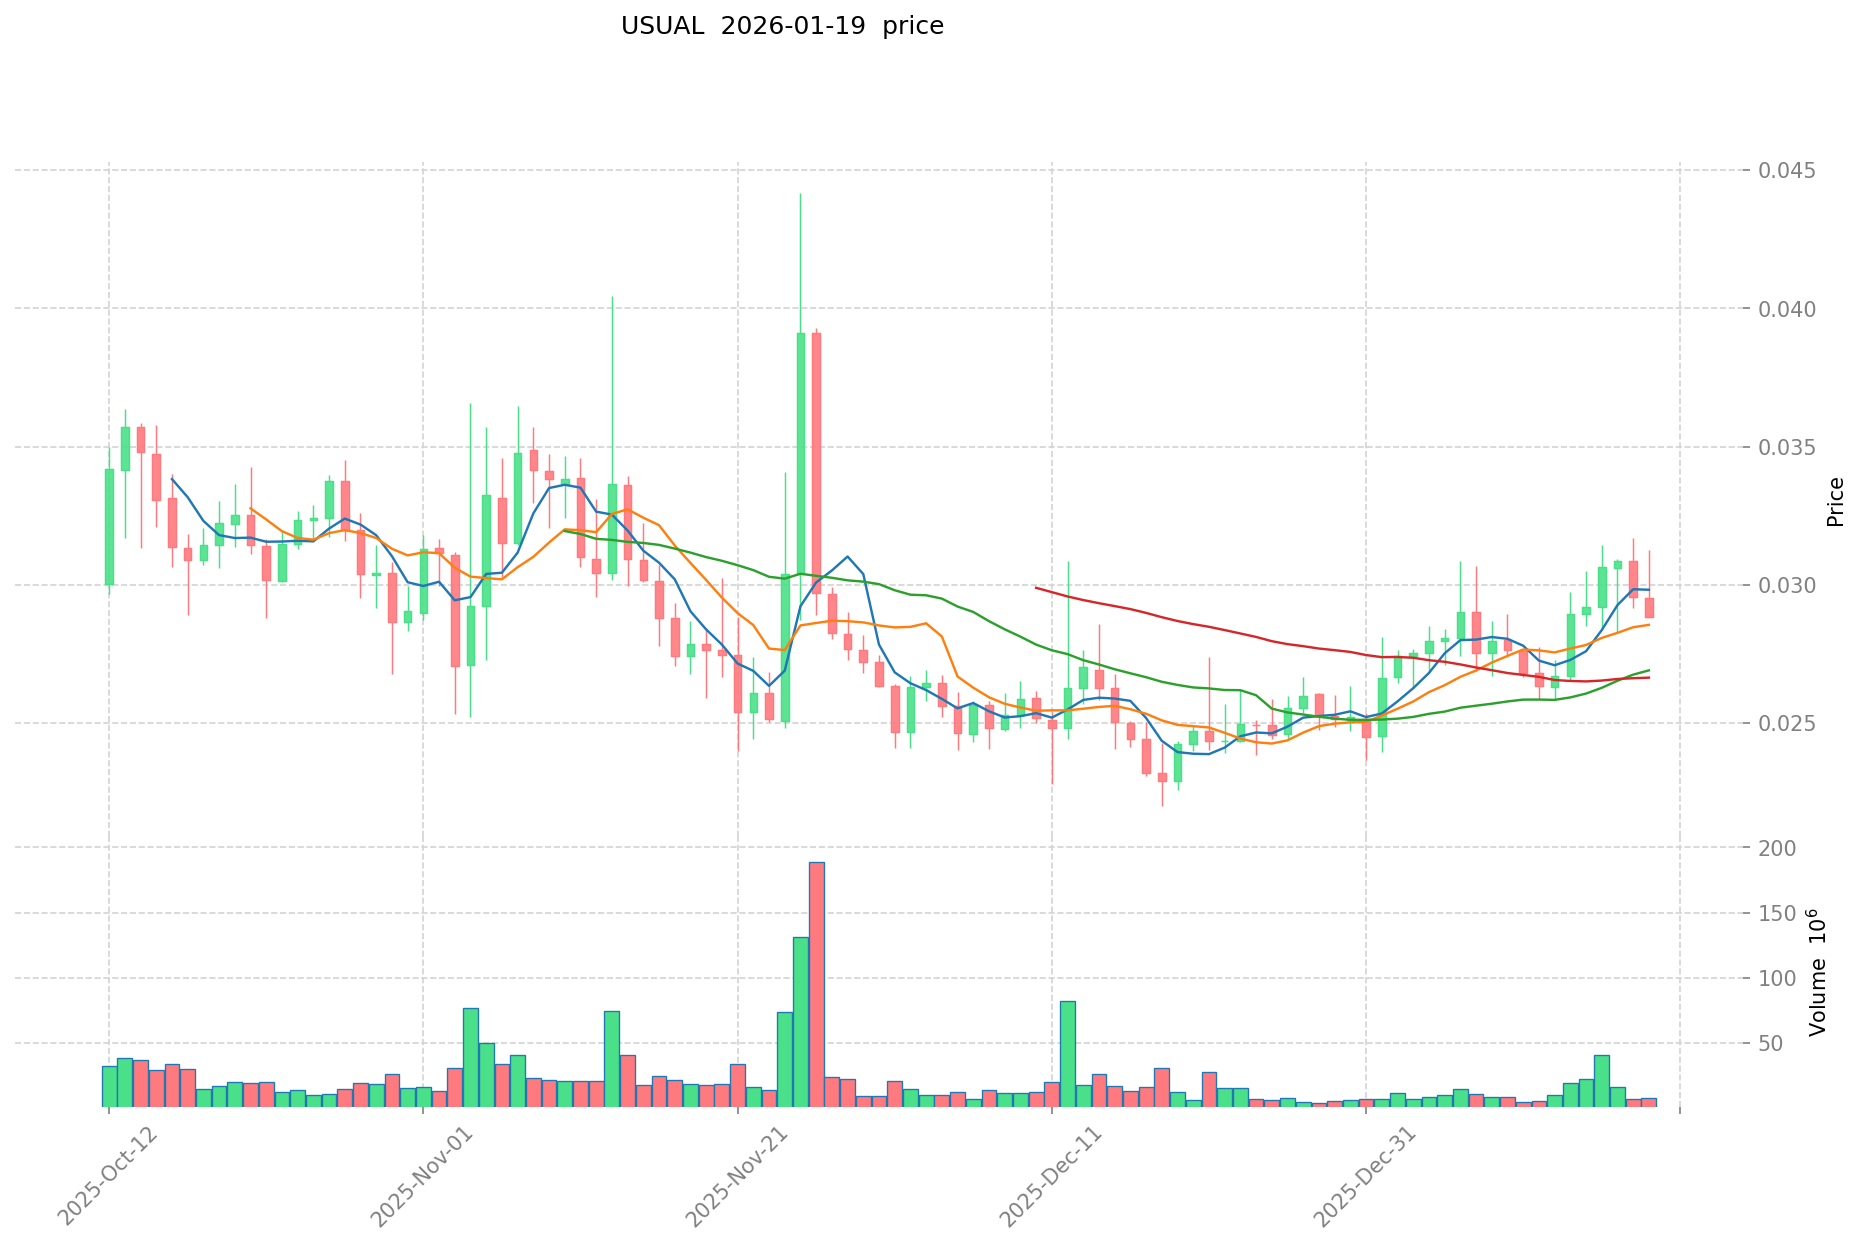
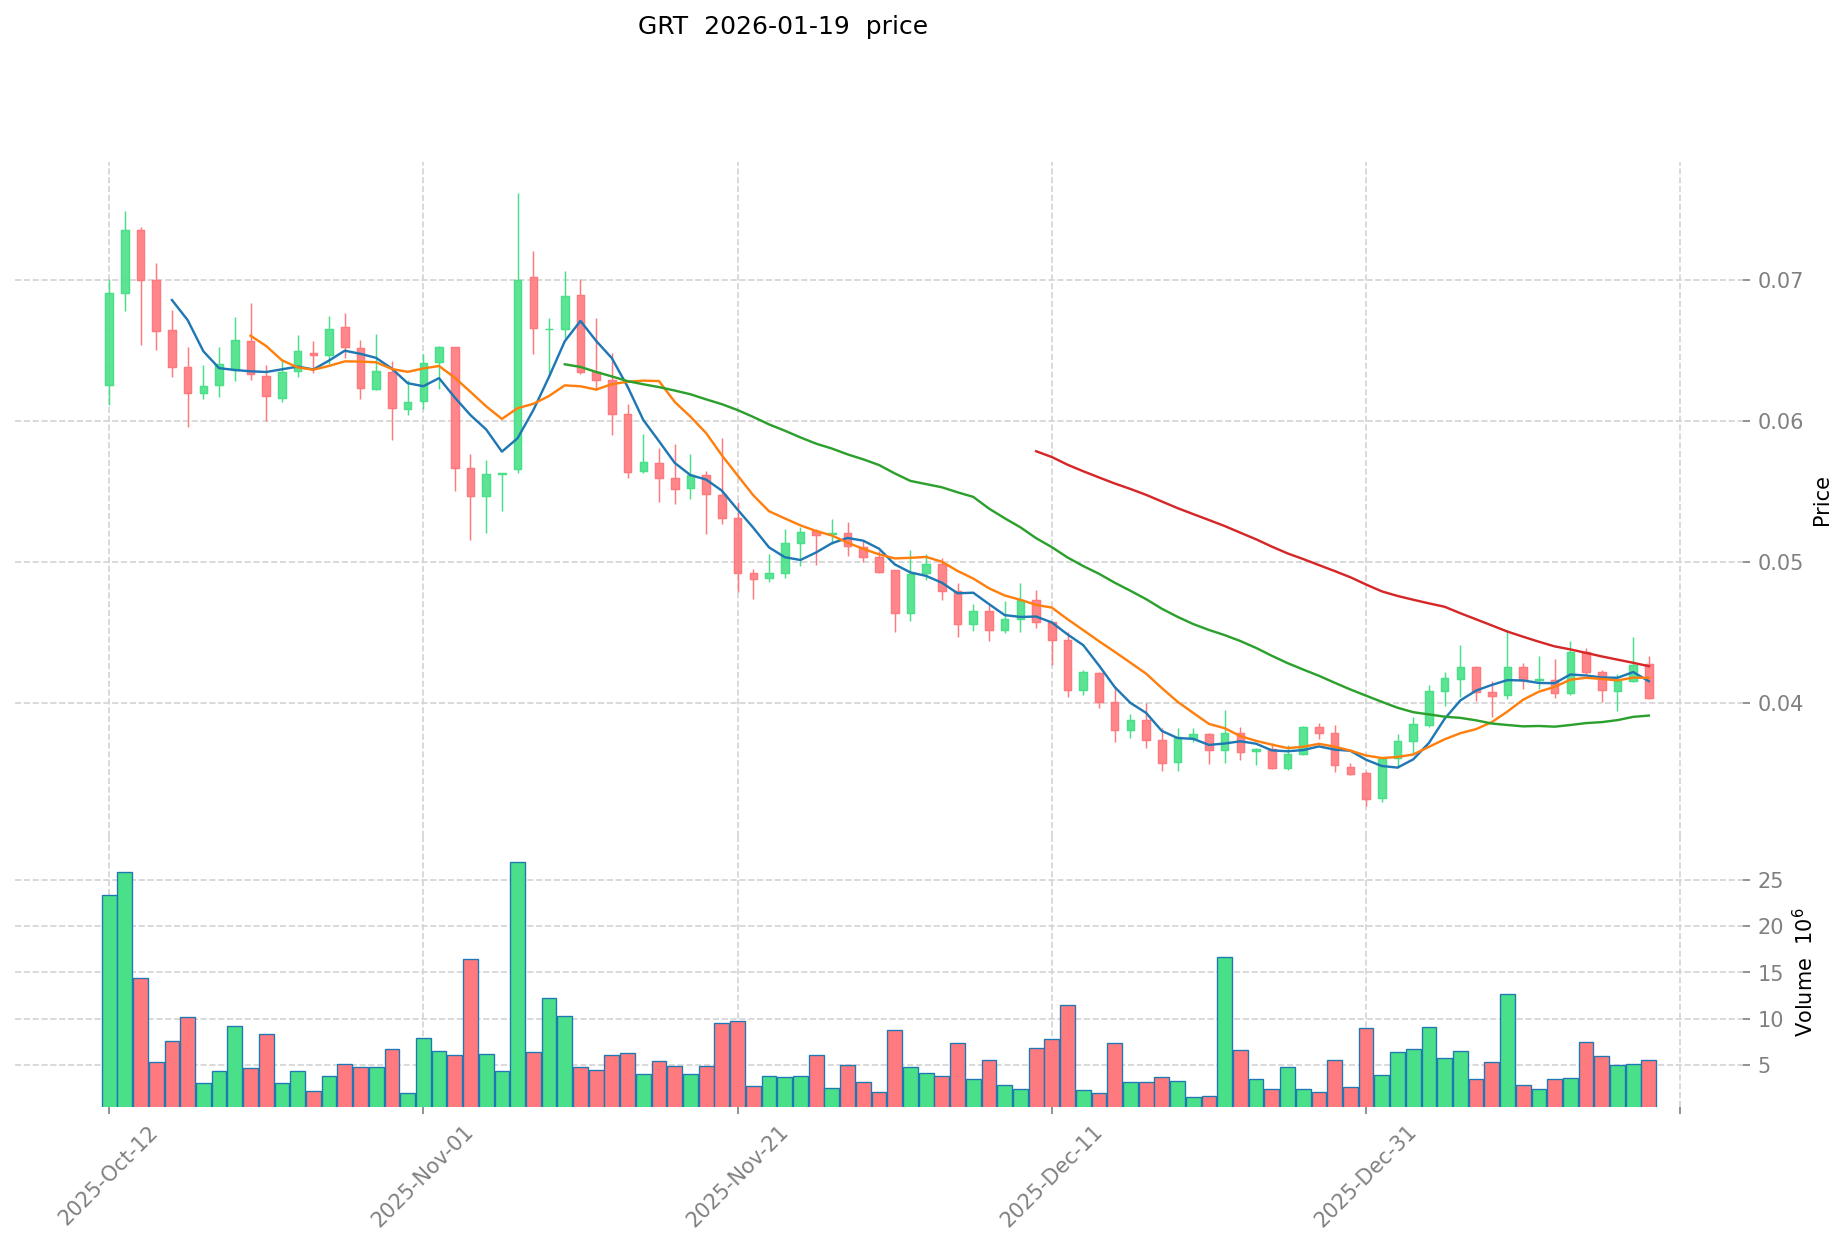
Historical Price Trends of USUAL (Coin A) and GRT (Coin B)
- 2024: USUAL launched in December 2024, with its price reaching an initial high of $1.6555 on December 20, 2024. Following this peak, the token experienced significant volatility.
- 2021: GRT reached its historical high of $2.84 in February 2021, during a period of strong market momentum for blockchain indexing protocols.
- 2026: As of January 2026, both tokens have experienced notable declines from their respective peaks. USUAL dropped from $1.6555 to $0.02777, while GRT declined from $2.84 to $0.03763.
- Comparative Analysis: During recent market cycles, USUAL has declined approximately 98.32% from its high to its current level, while GRT has experienced an approximately 98.67% decline from its historical peak. Both tokens have shown considerable price retracement, reflecting broader market conditions and individual project developments.
Current Market Status (2026-01-20)
- USUAL Current Price: $0.02777
- GRT Current Price: $0.03763
- 24-Hour Trading Volume: USUAL recorded $552,032.13, while GRT generated $724,301.36
- Market Sentiment Index (Fear & Greed Index): 44 (Fear)
View Real-Time Prices:
II. Core Factors Influencing Investment Value: USUAL vs GRT
Supply Mechanism Comparison (Tokenomics)
- USUAL: Specific supply mechanism details were not provided in available materials.
- GRT: Specific supply mechanism details were not provided in available materials.
- 📌 Historical Pattern: Supply mechanisms typically influence price cycles through controlled issuance, burning mechanisms, or halving events that affect token scarcity and market dynamics.
Institutional Adoption and Market Application
- Institutional Holdings: Comparative data on institutional preference between USUAL and GRT was not available in the reference materials.
- Enterprise Adoption: Specific applications of USUAL and GRT in cross-border payments, settlements, or investment portfolios were not detailed in the provided sources.
- National Policies: Regulatory attitudes toward these specific assets across different jurisdictions were not covered in the available materials.
Technology Development and Ecosystem Building
- USUAL Technology Upgrades: Technical development information was not available in the reference materials.
- GRT Technology Development: Technical advancement details were not provided in the available sources.
- Ecosystem Comparison: Comparative analysis of DeFi, NFT, payment, and smart contract implementations for these assets was not available in the reference materials.
Macroeconomic Environment and Market Cycles
- Performance Under Inflation: Comparative anti-inflation properties between USUAL and GRT were not addressed in the available materials.
- Macroeconomic Monetary Policy: General principles suggest that interest rates and dollar index movements can influence crypto asset valuations, though specific impacts on these tokens were not detailed.
- Geopolitical Factors: Cross-border transaction demand and international situations may affect crypto assets broadly, though specific effects on USUAL and GRT were not documented in the reference materials.
III. 2026-2031 Price Forecast: USUAL vs GRT
Short-term Forecast (2026)
- USUAL: Conservative $0.0145-$0.0278 | Optimistic $0.0278-$0.0397
- GRT: Conservative $0.0347-$0.0377 | Optimistic $0.0377-$0.0531
Medium-term Forecast (2028-2029)
- USUAL may enter a consolidation phase, with projected price range of $0.0297-$0.0579
- GRT may enter a growth phase, with projected price range of $0.0351-$0.0733
- Key drivers: institutional capital inflows, ETF developments, ecosystem expansion
Long-term Forecast (2030-2031)
- USUAL: Baseline scenario $0.0351-$0.0566 | Optimistic scenario $0.0566-$0.0803
- GRT: Baseline scenario $0.0499-$0.0705 | Optimistic scenario $0.0705-$0.0881
View detailed price predictions for USUAL and GRT
Disclaimer
USUAL:
| Year |
Predicted High Price |
Predicted Average Price |
Predicted Low Price |
Price Change |
| 2026 |
0.0397397 |
0.02779 |
0.0144508 |
0 |
| 2027 |
0.0489590325 |
0.03376485 |
0.027687177 |
21 |
| 2028 |
0.05790671775 |
0.04136194125 |
0.0376393665375 |
48 |
| 2029 |
0.054101419155 |
0.0496343295 |
0.0297805977 |
78 |
| 2030 |
0.06120409170645 |
0.0518678743275 |
0.037863548259075 |
86 |
| 2031 |
0.080281095884104 |
0.056535983016975 |
0.035052309470524 |
103 |
GRT:
| Year |
Predicted High Price |
Predicted Average Price |
Predicted Low Price |
Price Change |
| 2026 |
0.0531288 |
0.03768 |
0.0346656 |
0 |
| 2027 |
0.0567555 |
0.0454044 |
0.036777564 |
20 |
| 2028 |
0.055166346 |
0.05107995 |
0.044950356 |
35 |
| 2029 |
0.07330994424 |
0.053123148 |
0.03506127768 |
41 |
| 2030 |
0.0777563517276 |
0.06321654612 |
0.0499410714348 |
67 |
| 2031 |
0.08810806115475 |
0.0704864489238 |
0.050045378735898 |
87 |
IV. Investment Strategy Comparison: USUAL vs GRT
Long-term vs Short-term Investment Strategies
-
USUAL: May suit investors focused on emerging stablecoin infrastructure and early-stage protocol development. Given its recent launch in December 2024 and substantial price volatility, this asset presents characteristics associated with higher-risk, potentially higher-reward positioning for those comfortable with nascent projects.
-
GRT: May appeal to investors interested in established blockchain data infrastructure with a longer operational history since December 2020. The protocol's focus on indexing and querying services represents a more mature positioning within the decentralized data ecosystem.
Risk Management and Asset Allocation
-
Conservative Investors: A potential allocation might consider USUAL: 20-30% vs GRT: 70-80%, reflecting GRT's longer track record and more established market position.
-
Aggressive Investors: A potential allocation might consider USUAL: 50-60% vs GRT: 40-50%, allowing for greater exposure to USUAL's early-stage potential while maintaining diversification.
-
Hedging Tools: Stablecoin allocations for liquidity management, options strategies for downside protection, and cross-asset combinations to mitigate concentration risk.
V. Potential Risk Comparison
Market Risk
-
USUAL: Exhibits significant price volatility with an approximate 98.32% decline from its December 2024 peak. The token's recent launch means limited historical data for assessing behavior across different market cycles. Lower market cap ranking at 564th position suggests reduced liquidity and potentially higher susceptibility to price swings.
-
GRT: Has experienced an approximate 98.67% decline from its February 2021 historical peak. Despite a longer operational history, the asset demonstrates substantial volatility. Market cap ranking at 149th position indicates relatively better liquidity compared to USUAL, though still subject to broader market movements.
Technical Risk
-
USUAL: As a recently launched protocol, potential risks may include unproven scalability under high transaction volumes and limited stress-testing of network stability during various market conditions.
-
GRT: Operating since 2020, the protocol faces ongoing considerations regarding network efficiency, data indexing accuracy, and potential security vulnerabilities inherent in decentralized data infrastructure systems.
Regulatory Risk
- Both assets face evolving regulatory landscapes across different jurisdictions. USUAL's positioning as a stablecoin-related protocol may attract particular regulatory scrutiny regarding reserve backing and consumer protection frameworks. GRT's data infrastructure role may encounter considerations related to data privacy regulations and decentralized service provider classifications. Regulatory developments could significantly impact both assets' operational environments and market valuations.
VI. Conclusion: Which Is the Better Buy?
📌 Investment Value Summary:
-
USUAL Characteristics: Represents an early-stage entry point into decentralized stablecoin infrastructure with a recent launch in December 2024. Shows substantial price volatility with a current market cap of approximately 44.84 million USD. May offer exposure to innovation in the stablecoin sector, though with correspondingly elevated risk profiles.
-
GRT Characteristics: Offers exposure to established blockchain data indexing infrastructure with operational history since December 2020. Maintains a higher market cap position at approximately 402.29 million USD (ranked 149th). Represents a more mature protocol with defined use cases in the Ethereum ecosystem and related blockchain networks.
✅ Investment Considerations:
-
New Investors: Consider starting with smaller position sizes given both assets' substantial price volatility. Focus on understanding fundamental differences between stablecoin infrastructure (USUAL) and data indexing protocols (GRT). Prioritize risk management and avoid overallocation to any single asset.
-
Experienced Investors: May evaluate both assets within a diversified portfolio context, considering how each fits broader strategic objectives. Assessment of risk-return profiles should account for USUAL's early-stage characteristics versus GRT's longer operational track record. Monitor technical developments, adoption metrics, and regulatory developments affecting both protocols.
-
Institutional Investors: Conduct comprehensive due diligence on governance structures, protocol sustainability, and ecosystem development trajectories. Consider position sizing relative to liquidity profiles, with attention to USUAL's lower market cap and potentially limited trading depth. Evaluate regulatory compliance frameworks and risk management protocols for both assets.
⚠️ Risk Disclosure: Cryptocurrency markets exhibit extreme volatility and carry substantial risk of loss. This content provides informational analysis and does not constitute investment advice, financial recommendation, or solicitation to buy or sell any asset. Past performance does not indicate future results. Investors should conduct independent research and consult qualified financial advisors before making investment decisions.
VII. FAQ
Q1: What are the main differences between USUAL and GRT in terms of their core functions?
USUAL functions as a decentralized fiat-backed stablecoin issuer focused on redistributing ownership and value, while GRT operates as a decentralized protocol for indexing and querying blockchain data. USUAL launched in December 2024 and aims to reshape the stablecoin landscape through its native token mechanism. In contrast, GRT has been operational since December 2020, primarily serving the Ethereum ecosystem by making on-chain data accessible through open APIs. The fundamental distinction lies in their use cases: USUAL addresses stablecoin infrastructure needs, whereas GRT provides essential data indexing services for blockchain networks.
Q2: How do the current market positions of USUAL and GRT compare?
GRT holds a significantly stronger market position with a market cap of approximately 402.29 million USD (ranked 149th), while USUAL maintains a market cap of approximately 44.84 million USD (ranked 564th). As of January 20, 2026, USUAL trades at $0.02777 with 24-hour trading volume of $552,032.13, whereas GRT trades at $0.03763 with trading volume of $724,301.36. Both tokens have experienced substantial declines from their respective peaks—USUAL dropped approximately 98.32% from its December 2024 high of $1.6555, while GRT declined approximately 98.67% from its February 2021 peak of $2.84. GRT's higher market cap ranking and trading volume indicate relatively better liquidity compared to USUAL.
Q3: Which asset presents higher risk for investors?
USUAL presents higher risk characteristics due to its recent launch, lower market cap ranking (564th), and limited operational history since December 2024. The token's substantial price volatility and early-stage positioning create elevated risk profiles with correspondingly uncertain reward potential. GRT, while also demonstrating significant volatility with a 98.67% decline from its historical peak, benefits from a longer operational track record since 2020 and better liquidity at the 149th market cap ranking. Both assets carry substantial market risk, but USUAL's nascent status, unproven scalability, and limited stress-testing across market cycles contribute to comparatively higher risk levels than GRT's more established infrastructure protocol positioning.
Q4: What are the price forecasts for USUAL and GRT through 2031?
For 2026, USUAL's conservative forecast ranges from $0.0145-$0.0278, with an optimistic range of $0.0278-$0.0397. GRT's conservative 2026 forecast spans $0.0347-$0.0377, with optimistic projections of $0.0377-$0.0531. By 2031, USUAL's baseline scenario projects $0.0351-$0.0566 with an optimistic range of $0.0566-$0.0803, while GRT's baseline forecast ranges from $0.0499-$0.0705 with optimistic projections of $0.0705-$0.0881. These forecasts suggest both assets may experience gradual price appreciation over the five-year period, though actual performance depends on numerous factors including institutional adoption, ecosystem development, and broader market conditions. It is important to note that cryptocurrency price predictions carry substantial uncertainty and should not be used as sole investment decision-making criteria.
Q5: How should conservative versus aggressive investors approach allocation between USUAL and GRT?
Conservative investors might consider an allocation favoring GRT at 70-80% versus USUAL at 20-30%, reflecting GRT's longer operational history and more established market position. This approach prioritizes the relatively lower risk profile associated with GRT's proven infrastructure and higher liquidity. Aggressive investors might consider a more balanced allocation of USUAL at 50-60% versus GRT at 40-50%, allowing greater exposure to USUAL's early-stage potential while maintaining diversification benefits. Both approaches should incorporate risk management tools including stablecoin allocations for liquidity management, options strategies for downside protection, and cross-asset combinations to mitigate concentration risk. Regardless of risk tolerance, investors should avoid overallocation to any single asset and maintain position sizes appropriate to their overall portfolio strategy and risk capacity.
Q6: What regulatory risks affect USUAL and GRT?
Both assets face evolving regulatory landscapes across different jurisdictions that could significantly impact their operational environments and market valuations. USUAL's positioning as a stablecoin-related protocol may attract particular regulatory scrutiny regarding reserve backing mechanisms, transparency requirements, and consumer protection frameworks. Authorities in various regions have implemented or proposed regulations specifically targeting stablecoin issuers, which could affect USUAL's operational model. GRT's role as a decentralized data infrastructure provider may encounter regulatory considerations related to data privacy regulations, cross-border data transfer requirements, and classification of decentralized service providers. Both protocols must navigate uncertain regulatory developments, compliance costs, and potential operational restrictions that could emerge as governments worldwide continue developing frameworks for digital assets and blockchain technologies.
Q7: What factors should institutional investors prioritize when evaluating USUAL versus GRT?
Institutional investors should conduct comprehensive due diligence on governance structures, examining decision-making processes, stakeholder rights, and protocol upgrade mechanisms for both assets. Protocol sustainability assessment should include evaluation of revenue models, treasury management, developer activity, and long-term viability of each ecosystem. For USUAL, institutions should scrutinize stablecoin reserve management, backing mechanisms, and regulatory compliance frameworks. For GRT, focus should include network usage metrics, data indexing efficiency, and competitive positioning within blockchain infrastructure markets. Position sizing requires careful consideration of liquidity profiles, with particular attention to USUAL's lower market cap potentially limiting institutional-scale entry and exit capabilities. Risk management protocols should address custody solutions, counterparty risks, and scenario analysis across various market conditions for both assets.
Q8: Are there specific market conditions that favor USUAL over GRT or vice versa?
Market conditions favoring USUAL might include periods of increased focus on stablecoin innovation, regulatory clarity supporting decentralized stablecoin models, and growing demand for alternative stablecoin infrastructure. As an early-stage protocol, USUAL may benefit disproportionately from risk-on market sentiment and investor appetite for emerging projects with higher growth potential. Conversely, GRT may perform relatively better during periods emphasizing established infrastructure, heightened risk aversion, and increasing blockchain data indexing demand across multiple networks. GRT's longer operational history and more mature ecosystem positioning may provide relative stability during market downturns. Both assets remain correlated to broader cryptocurrency market trends, but their distinct use cases create differentiated performance drivers under varying macroeconomic conditions, regulatory developments, and sector-specific catalysts within the blockchain ecosystem.
* The information is not intended to be and does not constitute financial advice or any other recommendation of any sort offered or endorsed by Gate.