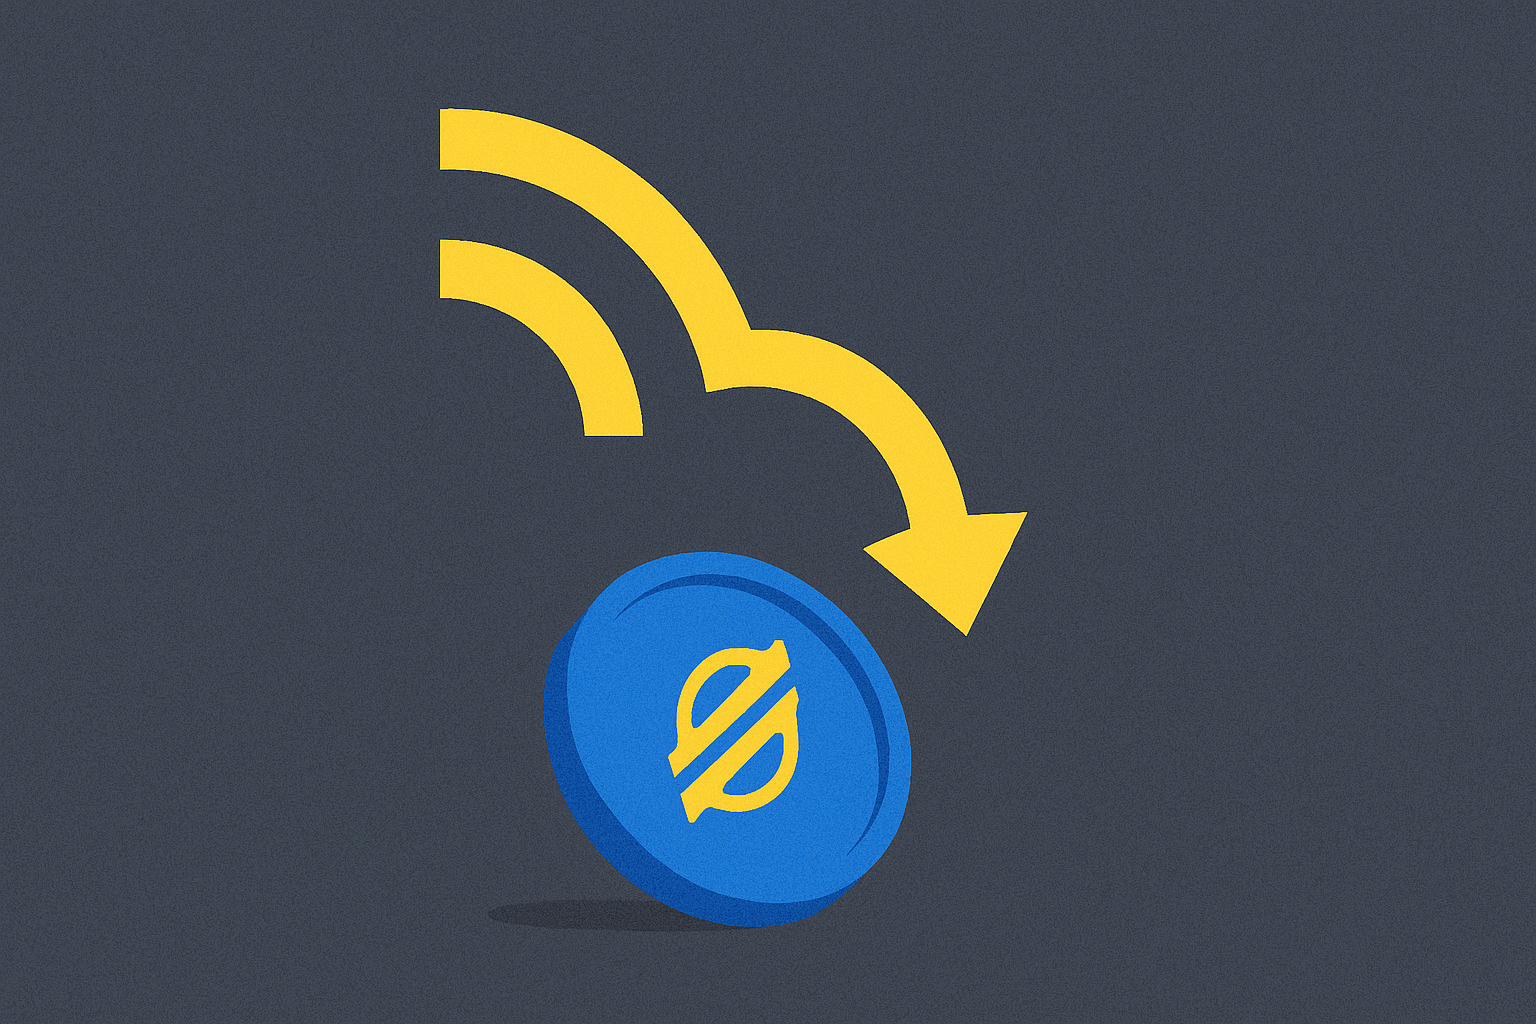
This article analyzes XLM derivatives market signals to forecast 2026 price movements through three critical metrics. First, XLM futures open interest collapsed to $118.43 million, signaling weakened trader conviction and increased liquidation vulnerability. Second, persistently negative funding rates between -0.01% and -0.006% reveal bearish dominance, with deteriorating long-short ratios indicating lost market confidence. Third, liquidation cascades amplified price declines toward $0.24, with structural vulnerabilities potentially triggering further downside toward $0.17-$0.15 support levels. The article explores how these derivatives indicators function as predictive mechanisms, examines basis variations between futures and spot markets, and addresses trading strategies on Gate for capitalizing on market inflection points amid heightened leverage risks.
XLM Futures Open Interest Collapsed to $118.43 Million: Weakening Derivatives Market Sentiment
The contraction in XLM futures open interest to $118.43 million represents a critical inflection point in the derivatives market landscape. When open interest declines of this magnitude occur, they typically reflect a fundamental shift in trader positioning and conviction. This reduction signals that participants are closing or reducing leveraged positions, often indicating diminished appetite for directional exposure on Stellar.
This derivatives market sentiment weakness carries predictive implications for price discovery mechanisms. Lower open interest typically correlates with reduced liquidity depth in futures markets, making XLM more susceptible to sharp price swings triggered by relatively modest volume. The collapse also raises concerns about increased liquidation vulnerability—as open interest shrinks, remaining leveraged positions represent a higher concentration of market participants, creating cascading risk if prices breach key support levels.
Historically, such contractions in futures open interest have preceded either capitulation moves or extended consolidation phases. The $118.43 million level suggests traders are adopting defensive positioning ahead of potential volatility, reflecting broader uncertainty about Stellar's near-term trajectory. For 2026 price forecasting, this metric provides essential context: when derivatives market sentiment deteriorates alongside open interest collapse, traditional momentum-based rallies become less sustainable, increasing the probability of lower-volatility consolidation or downside pressure testing support zones near $0.20.
Funding Rates and Long-Short Ratio Show Bearish Pressure: Market Participants Losing Confidence
XLM's derivatives market is flashing distinct warning signals, with funding rates persistently negative between -0.01% and -0.006% over recent trading periods. These negative funding rates indicate that short positions dominate the XLM futures market, as traders are paying to maintain bearish bets. This structural imbalance reveals fundamental skepticism about near-term price appreciation, with market participants increasingly positioning for downside scenarios rather than upside breakouts.
The long-short ratio reinforces this bearish narrative, demonstrating a measurable deterioration in market confidence. When long positions decline relative to short positions—as reflected in the worsening ratio—it signals that professional traders are reducing bullish exposure. This shift suggests that even sophisticated market participants have lost conviction in XLM's immediate recovery prospects, especially with the token hovering around $0.20.
Particularly alarming is the collapse in open interest on XLM derivatives. Data shows open interest plummeting from $278 million to $115 million, representing a decisive 59% decline. This dramatic contraction indicates that traders are unwinding positions entirely rather than adjusting their directional bets, suggesting genuine uncertainty about XLM's market direction. Reduced open interest often precedes consolidation periods or sharp moves in either direction.
Despite these derivative market headwinds, on-chain data reveals an intriguing counterpoint: investors accumulated XLM during recent price declines, with total value locked reaching new highs. This divergence between derivatives pessimism and spot market accumulation creates a critical inflection point. The negative funding rates and deteriorating long-short ratio clearly demonstrate that leveraged traders have lost confidence, but underlying demand from long-term investors suggests the bearish sentiment may be overdone, potentially setting up a contrarian opportunity as these derivatives signals eventually normalize.
Liquidation Cascades and Price Decline to $0.24: How Forced Sell-offs Signal Further Downside Risk in 2026
Liquidation cascades represent a critical mechanism through which derivative markets amplify price declines into accelerated sell-offs. When traders holding leveraged long positions face margin calls due to price deterioration, their positions are forcibly closed, creating additional downward pressure that triggers subsequent liquidations. XLM experienced precisely this dynamic in early 2026, with open interest crashing 11% during the market's first major decline. This collapse directly correlated with the $0.24 price level, where significant liquidation clusters activated forced sell-offs across major perpetual futures exchanges.
The mechanics of these cascades involve funding rate volatility acting as a multiplier effect. During periods of extreme bearish sentiment, negative funding rates create self-fulfilling spirals where short liquidations cease while long positions continue triggering. Reference data from October 2025 illustrated this risk starkly: $154 billion in aggregate liquidations occurred when leverage exceeded 100x and liquidity collapsed by 98%. XLM's derivative ecosystem exhibited similar structural vulnerabilities, with funding rate imbalances amplifying volatility and accelerating downside momentum.
Minimal whale accumulation and persistently weak order book depth compound these downside signals. With open interest contracting sharply and institutional bid-support absent, subsequent price deterioration could trigger fresh liquidation waves toward $0.17-$0.15 support levels, making further downside risk material and actionable for risk management purposes.
FAQ
What does an increase in open interest in XLM futures market mean? How does it predict price movement?
Increased open interest in XLM futures signals fresh capital entering the market, suggesting the current trend will likely continue. Conversely, declining open interest indicates market liquidation and potential trend reversal, helping predict near-term price direction.
What is the funding rate in crypto derivatives? How do positive and negative funding rates for XLM affect traders?
Funding rate measures perpetual contract holding costs, reflecting market positioning. Positive rates favor shorts, as longs pay fees; negative rates favor longs. XLM's rate direction signals market bias and trading costs for each position.
How to judge market sentiment through liquidation data? Do large-scale liquidation events usually signal price reversals?
Large-scale liquidation events typically indicate imminent price reversals. High-frequency liquidations often signal short-term tops or bottoms, serving as key indicators for potential trend shifts in XLM and broader crypto markets.
What does the basis change between XLM futures and spot market indicate, and how to trade using this signal?
Basis measures spot-futures price differences, reflecting supply-demand and market sentiment. Positive basis signals near-term demand strength; negative basis suggests future supply concerns. Traders exploit basis widening or narrowing for arbitrage and hedging opportunities through synchronized spot-futures positions.
How accurate are crypto derivatives market signals in predicting XLM prices in 2026, and what limitations should be noted?
Derivatives signals show moderate accuracy through futures open interest, funding rates, and liquidation data, but face limitations from extreme volatility and regulatory uncertainty. Machine accuracy improves with institutional participation, yet black swan events remain unpredictable factors affecting 2026 forecasts.
How to identify extreme leverage positions in XLM futures market? When are they prone to triggering cascade liquidations?
Extreme leverage positions in XLM futures are identified by high leverage ratios and open interest spikes. Cascade liquidations typically occur during funding rate surges, rapid price volatility, or when liquidation price levels cluster densely, triggering automated sell-offs that accelerate downward price movements.
* The information is not intended to be and does not constitute financial advice or any other recommendation of any sort offered or endorsed by Gate.