# XCAD vs OP: A Comprehensive Comparison of Two Leading Blockchain Governance Tokens
This article delivers an in-depth investment comparison between XCAD and OP, two distinct blockchain tokens serving different ecosystems. XCAD powers creator tokenization and DeFi incentives, while OP serves as Optimism's Layer 2 governance token. The analysis examines price history, tokenomics, market adoption, technology ecosystems, and risk factors to address investors' core question: which token offers superior investment value. Through historical trend analysis, supply mechanism evaluation, institutional adoption assessment, and 2025-2030 price forecasts, this guide equips beginner and experienced investors with actionable insights on portfolio allocation strategies. Whether you're exploring creator economy opportunities or Layer 2 infrastructure plays, this comprehensive comparison on Gate provides the framework needed to make informed cryptocurrency investment decisions.
Introduction: XCAD vs OP Investment Comparison
In the cryptocurrency market, the comparison between XCAD and OP has always been a topic investors cannot avoid. The two not only show significant differences in market cap ranking, application scenarios, and price performance, but also represent different positioning of crypto assets.
XCAD (XCAD): Since its launch in 2021, it has gained market recognition by providing DeFi tools for creators and building an incentive economy through tokenizing audience engagement and content participation, while offering an exclusive NFT marketplace.
OP (OP): Since its launch in 2022, it has been recognized as a low-cost, lightning-fast Ethereum Layer 2 blockchain solution, with OP serving as its native governance token for protocol governance.
This article will provide a comprehensive analysis of the investment value comparison between XCAD and OP from the perspectives of historical price trends, supply mechanisms, market adoption, and technical ecosystems, and attempt to answer the question investors care most about:
"Which is the better buy right now?"
XCAD Network vs Optimism: Price History and Market Comparison
I. Price History Comparison and Current Market Status
XCAD and OP Historical Price Trends
- 2022: XCAD reached its all-time high of $9.06 on January 21, 2022, reflecting early market enthusiasm for creator economy DeFi tools.
- 2024: OP achieved its all-time high of $4.84 on March 6, 2024, driven by layer-2 scaling solution adoption and ecosystem expansion.
- Comparative Analysis: Over the past year, XCAD has experienced a severe decline of -97.92%, dropping from its historical peak to its current level, while OP has declined -84.76% from its peak, reflecting both tokens' exposure to broader market downturns but with relatively different recovery trajectories.
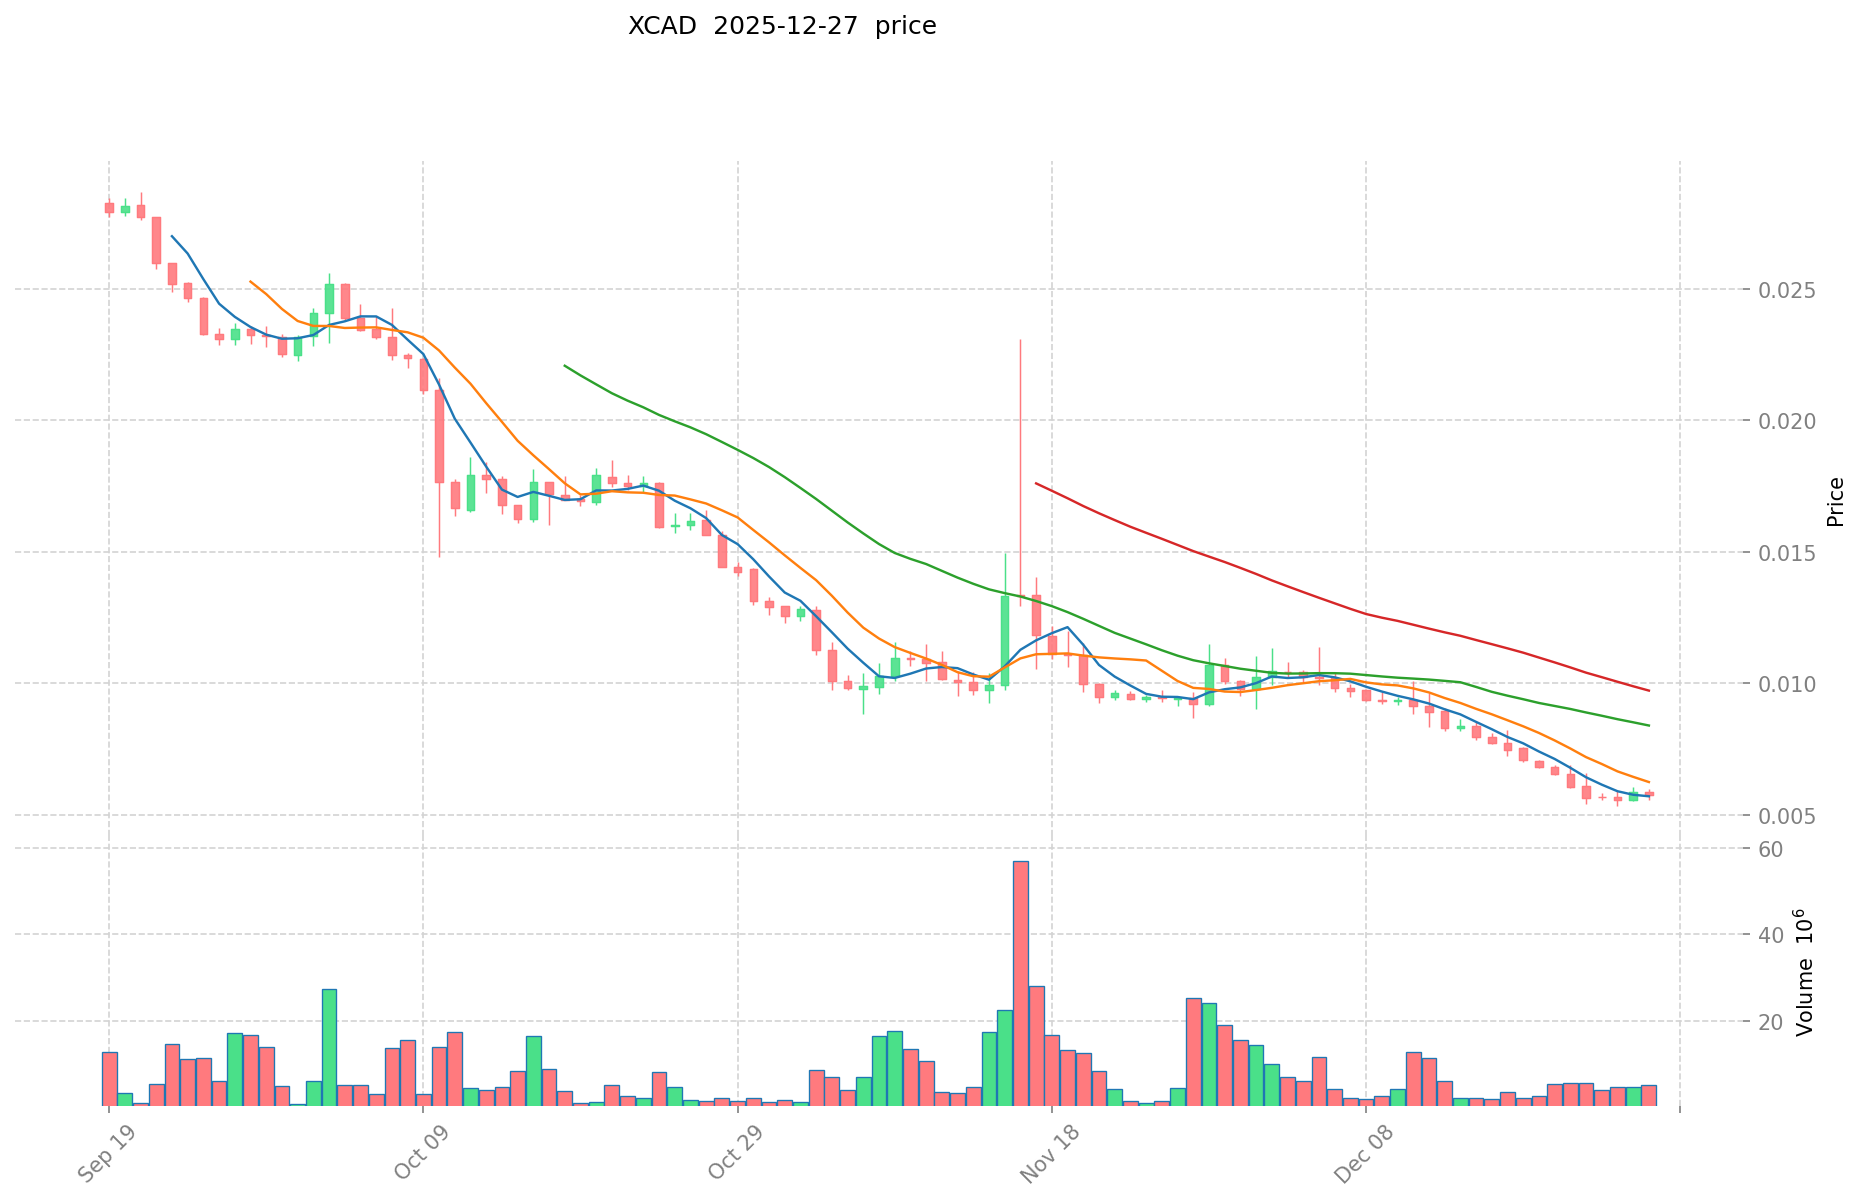
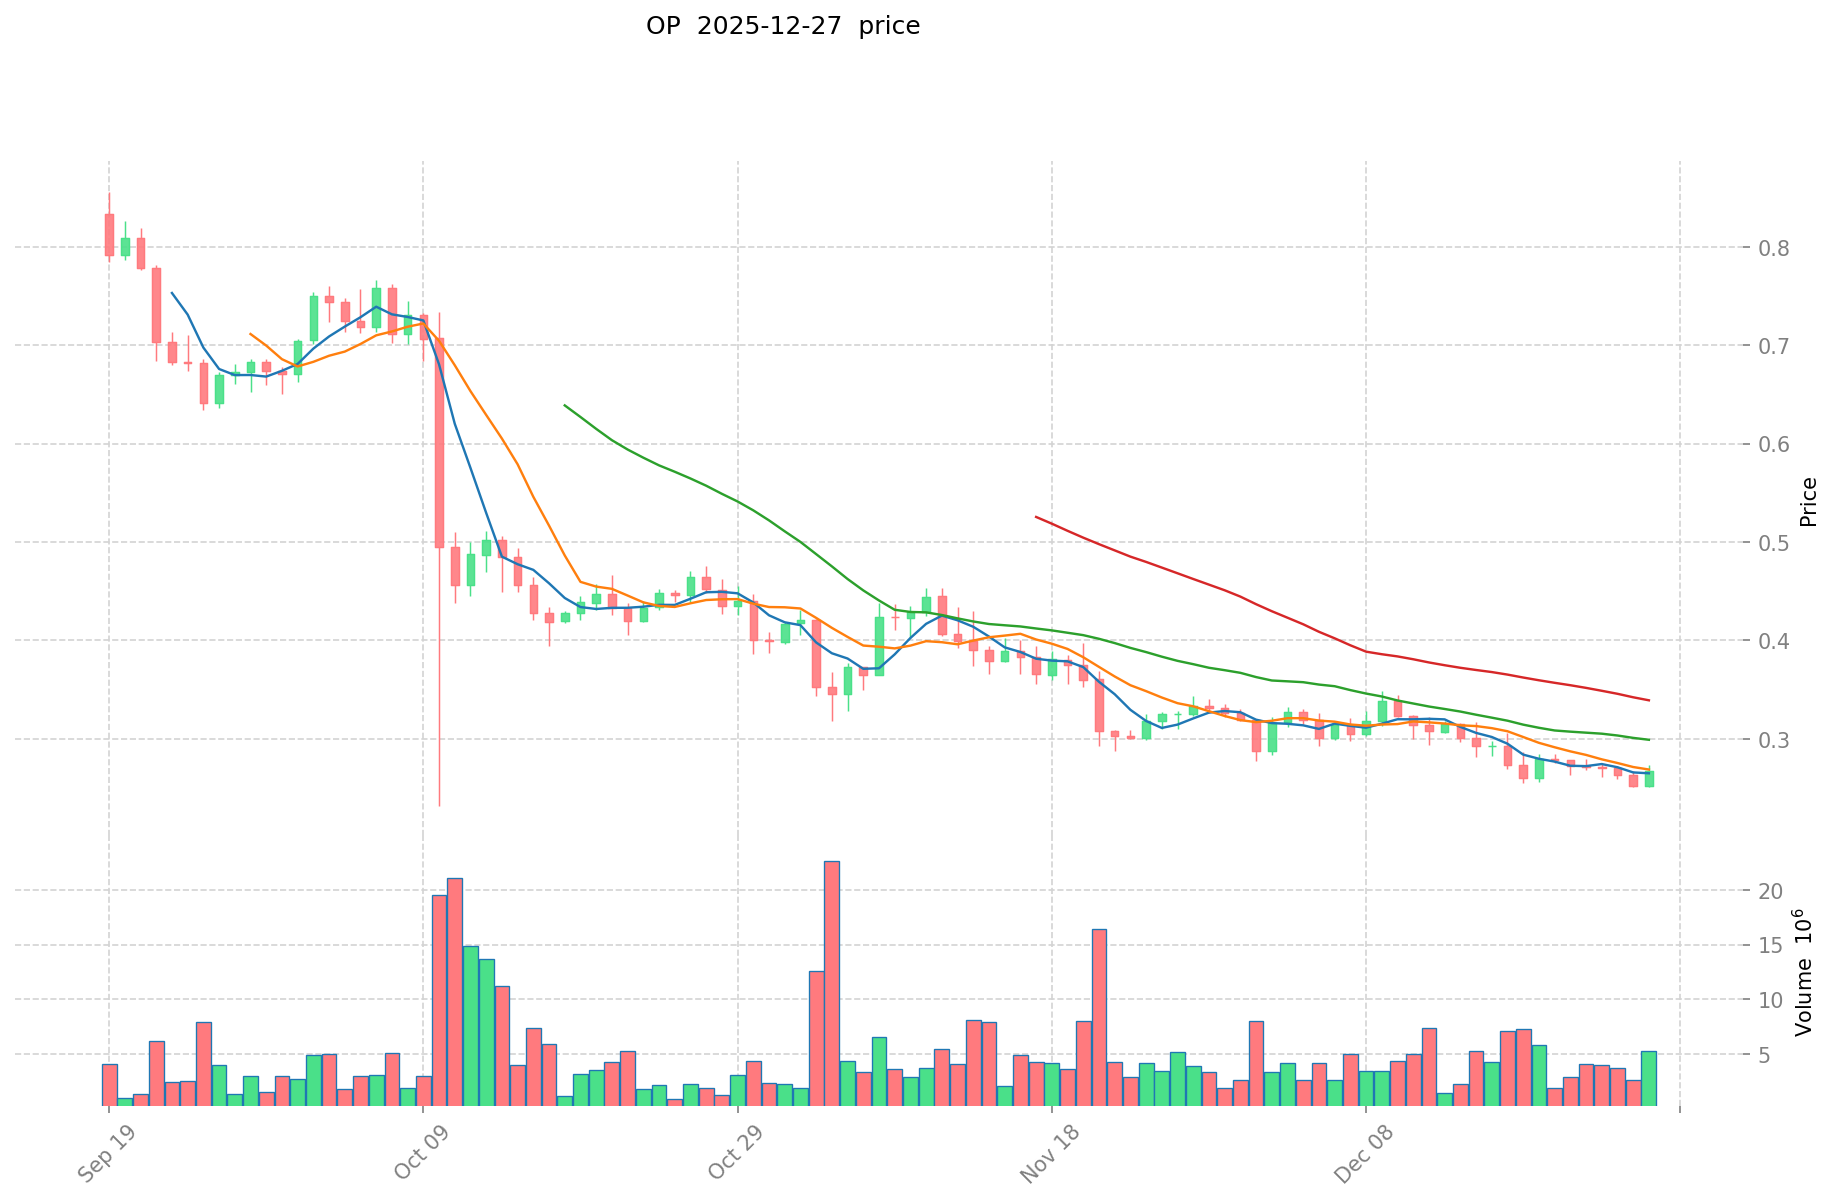
Current Market Status (December 27, 2025)
- XCAD current price: $0.00579
- OP current price: $0.2705
- 24-hour trading volume: XCAD recorded $29,144.23 while OP registered $1,357,999.49
- Market sentiment index (Fear & Greed Index): 23 (Extreme Fear)
Click to view real-time prices:
XCAD vs OP Investment Value Analysis
Core Factors Affecting XCAD and OP Investment Value
I. Tokenomics and Supply Mechanisms
XCAD Network
- Total cumulative funding reached $3.9 million following recent financing rounds
- Token unlock schedules present liquidity concerns that warrant market attention
- Supply mechanism designed to support creator tokenization platform operations
OP (Optimism)
- Information regarding specific tokenomics details not available in reference materials
📌 Historical Pattern: Token unlock events typically create selling pressure and liquidity fluctuations, requiring investors to monitor vesting schedules and token distribution timelines.
II. Institutional Adoption and Market Applications
Institutional Holdings
- Both XCAD and OP have attracted significant capital from institutional investors based on successful funding rounds
- Active community participation demonstrates broader market interest
Project Applications
- XCAD: Global platform for creator tokenization, extracting and monetizing audience value through token mechanisms
- OP: Market position and specific applications require assessment of current documentation
Regulatory Environment
- Investor decisions should consider evolving regulatory frameworks across different jurisdictions affecting both tokens
III. Technology Development and Ecosystem Building
XCAD Network Ecosystem
- Content creator tokenization focus represents distinct use case differentiation
- Platform development centers on creator economy monetization mechanisms
OP Ecosystem
- Referenced in market monitoring contexts alongside major blockchain tokens
- Specific technical roadmap details require additional documentation review
IV. Macroeconomic Factors and Market Cycles
Investment Decision Framework
- Market trends and liquidity conditions substantially influence token valuation
- Community support levels correlate with long-term sustainability
- Current market conditions and projected project developments require continuous assessment
Summary: Investment value assessment for both XCAD and OP requires analysis of market conditions, funding status, community engagement, and liquidity dynamics rather than isolated technical metrics.
III. 2025-2030 Price Forecast: XCAD vs OP
Short-term Forecast (2025)
- XCAD: Conservative $0.00551-$0.007946 | Optimistic $0.007946
- OP: Conservative $0.200244-$0.384252 | Optimistic $0.384252
Mid-term Forecast (2026-2028)
- XCAD shows steady accumulation phase, expected price range $0.00666681-$0.0108398722275 with 18-52% growth potential
- OP demonstrates strong bullish momentum, expected price range $0.31432896-$0.635396838219 with 21-64% appreciation
- Key drivers: ecosystem development, DeFi integration, institutional adoption, protocol upgrades
Long-term Forecast (2029-2030)
- XCAD: Base scenario $0.009335068826812-$0.013855207416637 | Optimistic scenario $0.014090549414955
- OP: Base scenario $0.275331224337345-$0.674831432199375 | Optimistic scenario $0.886728501909978
View detailed price predictions for XCAD and OP
XCAD:
| 年份 |
预测最高价 |
预测平均价格 |
预测最低价 |
涨跌幅 |
| 2025 |
0.007946 |
0.0058 |
0.00551 |
0 |
| 2026 |
0.00845379 |
0.006873 |
0.00666681 |
18 |
| 2027 |
0.0099624135 |
0.007663395 |
0.0059774481 |
32 |
| 2028 |
0.0108398722275 |
0.00881290425 |
0.006521549145 |
52 |
| 2029 |
0.013855207416637 |
0.00982638823875 |
0.009335068826812 |
69 |
| 2030 |
0.014090549414955 |
0.011840797827693 |
0.009235822305601 |
104 |
OP:
| 年份 |
预测最高价 |
预测平均价格 |
预测最低价 |
涨跌幅 |
| 2025 |
0.384252 |
0.2706 |
0.200244 |
0 |
| 2026 |
0.38636268 |
0.327426 |
0.31432896 |
21 |
| 2027 |
0.5317725666 |
0.35689434 |
0.231981321 |
31 |
| 2028 |
0.635396838219 |
0.4443334533 |
0.328806755442 |
64 |
| 2029 |
0.674831432199375 |
0.5398651457595 |
0.275331224337345 |
99 |
| 2030 |
0.886728501909978 |
0.607348288979437 |
0.364408973387662 |
124 |
IV. Investment Strategy Comparison: XCAD vs OP
Long-term vs Short-term Investment Strategy
- XCAD: Suited for investors focusing on creator economy ecosystem potential and tokenization innovation, with tolerance for high volatility and extended accumulation phases
- OP: Suited for investors seeking Layer 2 scaling solution exposure and Ethereum ecosystem participation, with preference for established blockchain infrastructure plays
Risk Management and Asset Allocation
- Conservative investors: XCAD 15% vs OP 85%
- Aggressive investors: XCAD 40% vs OP 60%
- Hedging tools: Stablecoin allocation, options strategies, cross-asset diversification with major blockchain tokens
V. Potential Risk Comparison
Market Risk
- XCAD: Severe historical decline of -97.92% from all-time high reflects concentrated selling pressure and limited liquidity (24-hour volume $29,144.23), creating potential for additional volatility
- OP: Decline of -84.76% from peak indicates Layer 2 market exposure to broader cryptocurrency downturn, though higher liquidity ($1,357,999.49 daily volume) provides better exit mechanisms
Technology Risk
- XCAD: Creator tokenization platform dependency on sustained content creator participation and NFT marketplace adoption; smart contract vulnerabilities in incentive mechanisms
- OP: Ethereum Layer 2 sequencer centralization concerns, bridge security risks, and potential compatibility issues with Ethereum protocol upgrades
Regulatory Risk
- Global regulatory frameworks increasingly scrutinize token utility and creator economy platforms, affecting XCAD's monetization mechanisms
- Layer 2 solutions face evolving compliance requirements across jurisdictions regarding staking mechanisms and governance token functionality
VI. Conclusion: Which Is the Better Buy?
📌 Investment Value Summary:
- XCAD advantages: Emerging creator economy niche, tokenization innovation, lower entry price point with potential upside from base levels, community-driven growth model
- OP advantages: Established Layer 2 infrastructure with proven scaling solutions, higher trading liquidity, stronger institutional support, Ethereum ecosystem integration
✅ Investment Recommendations:
- Beginner investors: Prioritize OP for established technology foundation and infrastructure clarity; consider XCAD allocation only after understanding creator economy fundamentals
- Experienced investors: Balance portfolio with weighted OP position (60-70%) for stability and XCAD exposure (30-40%) for asymmetric upside potential, implementing strict stop-loss discipline
- Institutional investors: Monitor OP for Layer 2 protocol governance participation and ecosystem development; evaluate XCAD funding rounds and token unlock schedules for entry timing
⚠️ Risk Disclosure: Cryptocurrency markets exhibit extreme volatility. Both XCAD and OP face significant drawdown risks from current valuations. This analysis does not constitute investment advice. Conduct independent research and consult financial advisors before making investment decisions.
FAQ
XCAD和OP分别是什么?各自的核心功能和定位有什么区别?
XCAD是基于区块链的创意代币,主要用于内容创作者激励和社区治理。OP(Optimism)是以太坊二层扩容方案,专注提升交易速度和降低成本。两者定位完全不同,XCAD面向创意生态,OP面向基础设施。
XCAD和OP在技术架构上有什么主要差异?
XCAD是YouTube生态的代币,专注内容创作者经济,基于以太坊。OP(Optimism)是以太坊Layer2扩展方案,使用Optimistic Rollup技术降低交易成本。两者架构定位完全不同,一个是应用代币,一个是扩容技术层。
XCAD和OP的应用场景分别是什么?适用于哪些用户或开发者?
XCAD专注于创意内容激励,适合内容创作者和社区运营者。OP是以太坊扩容方案,适合追求低费用高效率的开发者和用户。
XCAD和OP的代币经济模型有什么不同?
XCAD通过将创作者观众和内容参与度Token化,建立创作者激励经济体系。OP则专注于去中心化交易和DeFi生态,两者应用场景和经济激励机制完全不同。
XCAD和OP各自的生态发展现状和未来前景如何对比?
XCAD在创作者经济和AI融合领域表现突出,生态创新性强,未来前景更加光明。OP生态稳步发展但缺乏创新亮点,XCAD的市场潜力和增长空间更大。
投资XCAD和OP各有什么风险和优势?
XCAD优势在区块链技术创新与社区生态,风险在市场波动;OP优势在Optimism生态与Layer2技术前景,风险在竞争激烈。两者都需谨慎评估市场风险。
* The information is not intended to be and does not constitute financial advice or any other recommendation of any sort offered or endorsed by Gate.