This article provides a comprehensive comparative analysis of XL1 and KAVA, two emerging blockchain platforms within the decentralized finance sector. It evaluates their investment value by examining key factors like historical price trends, supply mechanisms, institutional adoption, and technical ecosystems. The content aims to guide investors on which asset presents better purchase potential based on current market conditions. Additionally, it offers strategic insights into potential risks, investment strategies, and price predictions through 2030. Suitable for both new and experienced investors, it clarifies differences in utility and market positioning between XL1 and KAVA.
Introduction: XL1 vs KAVA Investment Comparison
In the cryptocurrency market, the comparison between XL1 vs KAVA has always been an unavoidable topic for investors. The two not only show significant differences in market cap ranking, application scenarios, and price performance but also represent different positioning in crypto assets.
XL1 (XL1): Since its launch, it has gained market recognition for its role as the utility token of XYO Layer One, the first scalable data blockchain that brings verifiable information on-chain.
KAVA (KAVA): Since its inception in 2019, it has been hailed as a cross-chain decentralized financial platform, providing collateralized lending and stablecoin services for mainstream digital assets.
This article will comprehensively analyze the investment value comparison between XL1 vs KAVA, focusing on historical price trends, supply mechanisms, institutional adoption, technological ecosystems, and future predictions, attempting to answer the question most concerning to investors:
"Which is the better buy right now?"
I. Price History Comparison and Current Market Status
XL1 and KAVA Historical Price Trends
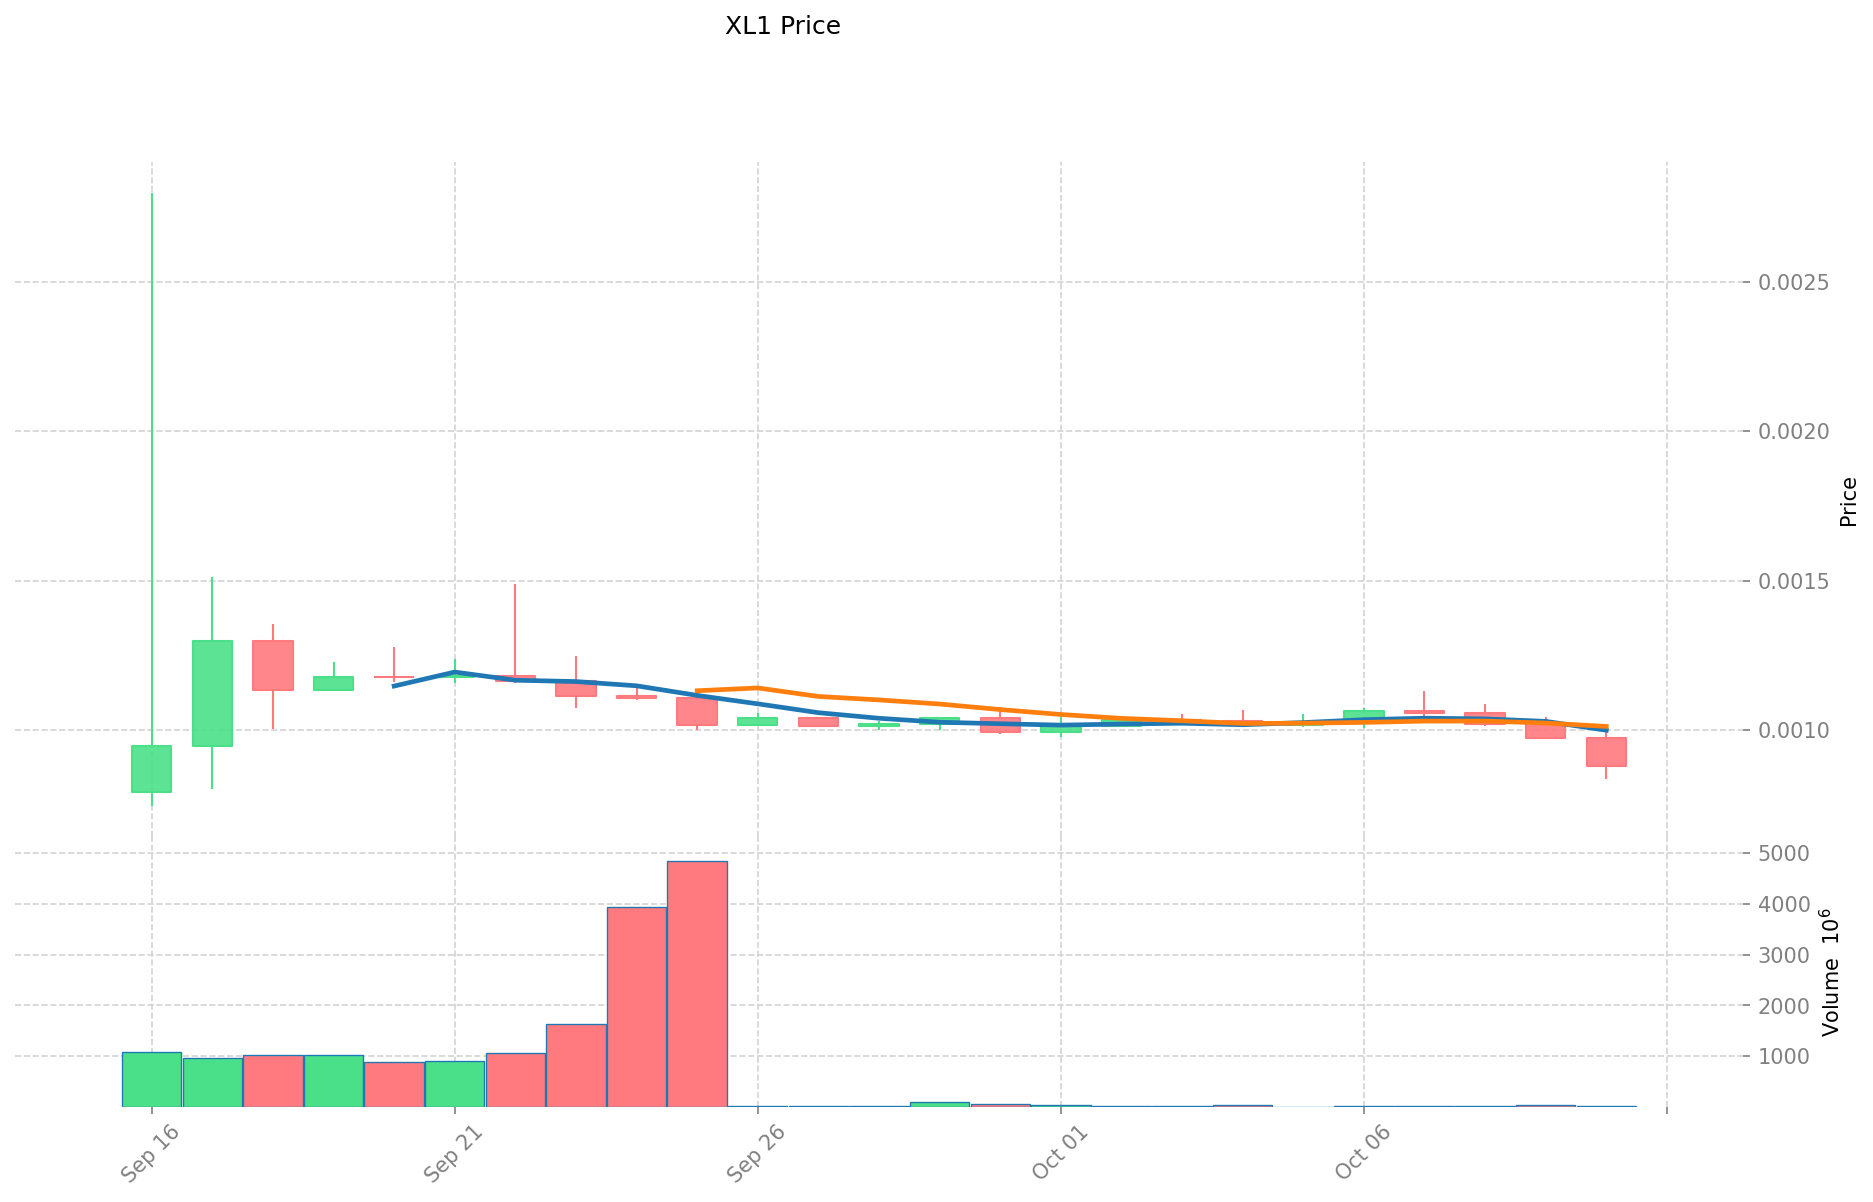
- 2025: XL1 reached an all-time high of $0.0027985 on September 16, 2025.
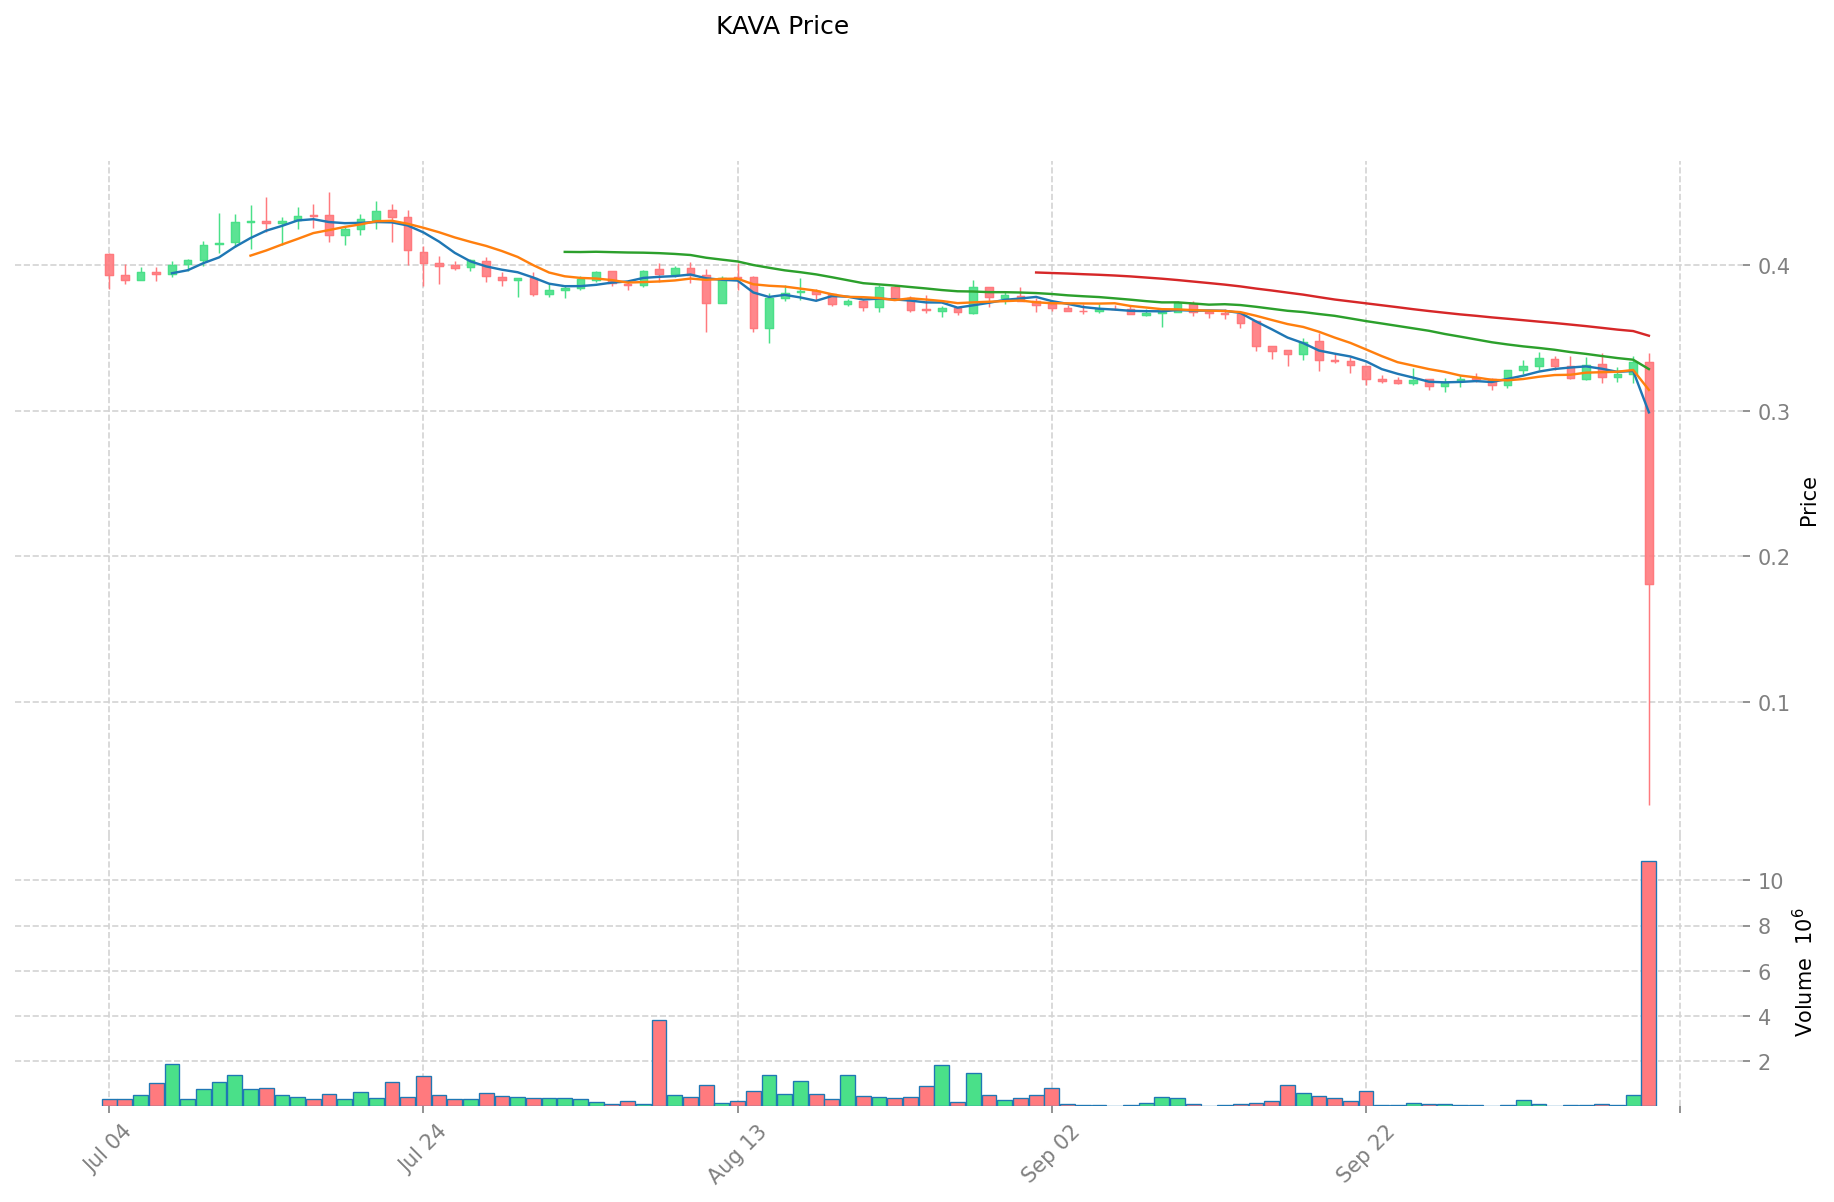
- 2025: KAVA dropped to $0.138058 on October 11, 2025, its lowest point in recent history.
- Comparative analysis: In the current market cycle, XL1 has fallen from its peak of $0.0027985 to $0.0009045, while KAVA has declined from its all-time high of $9.12 to $0.1676.
Current Market Situation (2025-10-11)
- XL1 current price: $0.0009045
- KAVA current price: $0.1676
- 24-hour trading volume: $25,932.40 (XL1) vs $1,765,233.83 (KAVA)
- Market Sentiment Index (Fear & Greed Index): 27 (Fear)
Click to view real-time prices:
- View XL1 current price Market Price
- View KAVA current price Market Price
Investment Value Analysis: XL1 vs KAVA Core Factors
Supply Mechanisms Comparison (Tokenomics)
- XL1: Utility token for the XYO Layer One blockchain with specific allocation structure
- KAVA: DeFi hub token with cross-chain lending capabilities and stablecoin integration
- 📌 Historical pattern: Supply mechanisms drive cyclical price movements in both assets, with market liquidity significantly affecting price volatility.
Institutional Adoption & Market Applications
- Institutional holdings: KAVA has gained recognition as an industry-acknowledged "DeFi hub" asset
- Enterprise adoption: XL1 serves critical functions in its blockchain ecosystem while KAVA excels in cross-chain lending and stablecoin sectors
- Regulatory stance: Regulatory frameworks continue evolving for both tokens across different jurisdictions
Technical Development & Ecosystem Building
- XL1 technical foundation: Built on XYO Layer One blockchain providing essential utility functions
- KAVA technical development: Focuses on cross-chain compatibility and transaction speed optimization with sophisticated ecosystem architecture
- Ecosystem comparison: KAVA demonstrates stronger positioning in DeFi applications with established lending protocols and stablecoin integration
Macroeconomic Factors & Market Cycles
- Inflation environment performance: Both assets require evaluation against broader crypto market trends
- Monetary policy impact: Interest rate changes affect capital flows into crypto assets generally
- Geopolitical factors: Cross-border transaction demands influence adoption rates and utility value
III. 2025-2030 Price Prediction: XL1 vs KAVA
Short-term Prediction (2025)
- XL1: Conservative $0.000624105 - $0.0009045 | Optimistic $0.0009045 - $0.001293435
- KAVA: Conservative $0.162735 - $0.1713 | Optimistic $0.1713 - $0.244959
Mid-term Prediction (2027)
- XL1 may enter a growth phase, with an estimated price range of $0.0008688437055 - $0.0017765908605
- KAVA may enter a consolidation phase, with an estimated price range of $0.19174970835 - $0.27953873145
- Key drivers: Institutional capital inflow, ETF, ecosystem development
Long-term Prediction (2030)
- XL1: Base scenario $0.001260666670081 - $0.002101111116803 | Optimistic scenario $0.002101111116803 - $0.002962566674692
- KAVA: Base scenario $0.258010449942863 - $0.390924924155853 | Optimistic scenario $0.390924924155853 - $0.476928407470141
View detailed price predictions for XL1 and KAVA
Disclaimer: The above predictions are based on historical data and market analysis. Cryptocurrency markets are highly volatile and subject to change. This information should not be considered as financial advice. Always conduct your own research before making investment decisions.
XL1:
| 年份 |
预测最高价 |
预测平均价格 |
预测最低价 |
涨跌幅 |
| 2025 |
0.001293435 |
0.0009045 |
0.000624105 |
0 |
| 2026 |
0.0014945958 |
0.0010989675 |
0.0006154218 |
21 |
| 2027 |
0.0017765908605 |
0.00129678165 |
0.0008688437055 |
42 |
| 2028 |
0.002182094482455 |
0.00153668625525 |
0.00141375135483 |
69 |
| 2029 |
0.002342831864754 |
0.001859390368852 |
0.00100407079918 |
105 |
| 2030 |
0.002962566674692 |
0.002101111116803 |
0.001260666670081 |
131 |
KAVA:
| 年份 |
预测最高价 |
预测平均价格 |
预测最低价 |
涨跌幅 |
| 2025 |
0.244959 |
0.1713 |
0.162735 |
3 |
| 2026 |
0.25391799 |
0.2081295 |
0.156097125 |
26 |
| 2027 |
0.27953873145 |
0.231023745 |
0.19174970835 |
40 |
| 2028 |
0.38036904495525 |
0.255281238225 |
0.1582743676995 |
54 |
| 2029 |
0.464024706721582 |
0.317825141590125 |
0.244725359024396 |
92 |
| 2030 |
0.476928407470141 |
0.390924924155853 |
0.258010449942863 |
137 |
IV. Investment Strategy Comparison: XL1 vs KAVA
Long-term vs Short-term Investment Strategies
- XL1: Suitable for investors focused on blockchain data verification and ecosystem potential
- KAVA: Suitable for investors interested in DeFi applications and cross-chain capabilities
Risk Management and Asset Allocation
- Conservative investors: XL1: 30% vs KAVA: 70%
- Aggressive investors: XL1: 60% vs KAVA: 40%
- Hedging tools: Stablecoin allocation, options, cross-currency portfolios
V. Potential Risk Comparison
Market Risks
- XL1: Higher volatility due to lower market cap and trading volume
- KAVA: Exposure to DeFi market fluctuations and cross-chain risks
Technical Risks
- XL1: Scalability, network stability
- KAVA: Protocol security, smart contract vulnerabilities
Regulatory Risks
- Global regulatory policies may impact both assets differently, with DeFi platforms potentially facing more scrutiny
VI. Conclusion: Which Is the Better Buy?
📌 Investment Value Summary:
- XL1 advantages: Unique position in verifiable blockchain data, potential for growth in data-centric applications
- KAVA advantages: Established DeFi ecosystem, cross-chain functionality, higher liquidity
✅ Investment Advice:
- New investors: Consider a balanced approach, leaning towards KAVA for its more established ecosystem
- Experienced investors: Explore opportunities in both, with a higher allocation to XL1 for potential growth
- Institutional investors: Evaluate KAVA for DeFi exposure and XL1 for long-term blockchain data solutions
⚠️ Risk Warning: Cryptocurrency markets are highly volatile. This article does not constitute investment advice.
None
VII. FAQ
Q1: What are the main differences between XL1 and KAVA?
A: XL1 is the utility token for XYO Layer One blockchain focusing on verifiable data, while KAVA is a cross-chain DeFi platform offering lending and stablecoin services. XL1 has a lower market cap and trading volume, whereas KAVA has a more established ecosystem in the DeFi space.
Q2: Which cryptocurrency has shown better price performance recently?
A: Based on the data provided, XL1 reached an all-time high in September 2025, while KAVA has been experiencing a decline. However, past performance doesn't guarantee future results, and both assets have shown significant volatility.
Q3: What are the key factors driving the future value of XL1 and KAVA?
A: For XL1, the growth of blockchain data verification applications and ecosystem development are crucial. For KAVA, the expansion of its DeFi services, cross-chain capabilities, and institutional adoption are key drivers.
Q4: How do the supply mechanisms differ between XL1 and KAVA?
A: XL1 has a specific allocation structure as a utility token for the XYO Layer One blockchain. KAVA, as a DeFi hub token, focuses on cross-chain lending capabilities and stablecoin integration. Both mechanisms influence their respective price movements and market liquidity.
Q5: What are the main risks associated with investing in XL1 and KAVA?
A: XL1 faces higher volatility due to its lower market cap and trading volume, as well as potential scalability issues. KAVA is exposed to DeFi market fluctuations, cross-chain risks, and potential smart contract vulnerabilities. Both are subject to regulatory risks, with DeFi platforms potentially facing more scrutiny.
Q6: How should investors approach allocating between XL1 and KAVA?
A: Conservative investors might consider allocating 30% to XL1 and 70% to KAVA, while aggressive investors might opt for 60% XL1 and 40% KAVA. However, individual allocation should be based on personal risk tolerance and investment goals.
Q7: What are the long-term price predictions for XL1 and KAVA?
A: By 2030, XL1 is predicted to reach between $0.001260666670081 and $0.002962566674692 in base and optimistic scenarios respectively. KAVA is expected to range between $0.258010449942863 and $0.476928407470141. However, these predictions are speculative and subject to market conditions.
* The information is not intended to be and does not constitute financial advice or any other recommendation of any sort offered or endorsed by Gate.


