This article offers a thorough comparison of ZetaChain (ZETA) and Optimism (OP), focusing on investment value assessment, price trends, and influential factors like tokenomics, institutional adoption, and technological ecosystems. It provides insights for investors contemplating which token is a more viable investment, considering both short-term and long-term strategies, and risk assessments. The structured breakdown aids investors, including conservative, aggressive, and institutional, to understand the dynamics of cross-chain solutions and Ethereum scaling. Optimized for fast scanning, this summary targets crypto investors seeking in-depth analysis of market sentiments and growth potential.
Introduction: ZETA vs OP Investment Comparison
In the cryptocurrency market, the comparison between ZetaChain (ZETA) vs Optimism (OP) has been an unavoidable topic for investors. The two not only show significant differences in market cap ranking, application scenarios, and price performance but also represent different positions in the crypto asset landscape.
ZetaChain (ZETA): Since its launch, it has gained market recognition for its ability to enable omnichain, generic smart contracts and messaging between any blockchain.
Optimism (OP): Introduced as a low-cost, lightning-fast Ethereum Layer 2 blockchain, it has been addressing the practical needs of developers and users.
This article will comprehensively analyze the investment value comparison between ZETA and OP, focusing on historical price trends, supply mechanisms, institutional adoption, technological ecosystems, and future predictions, attempting to answer the question investors care about most:
"Which is the better buy right now?"
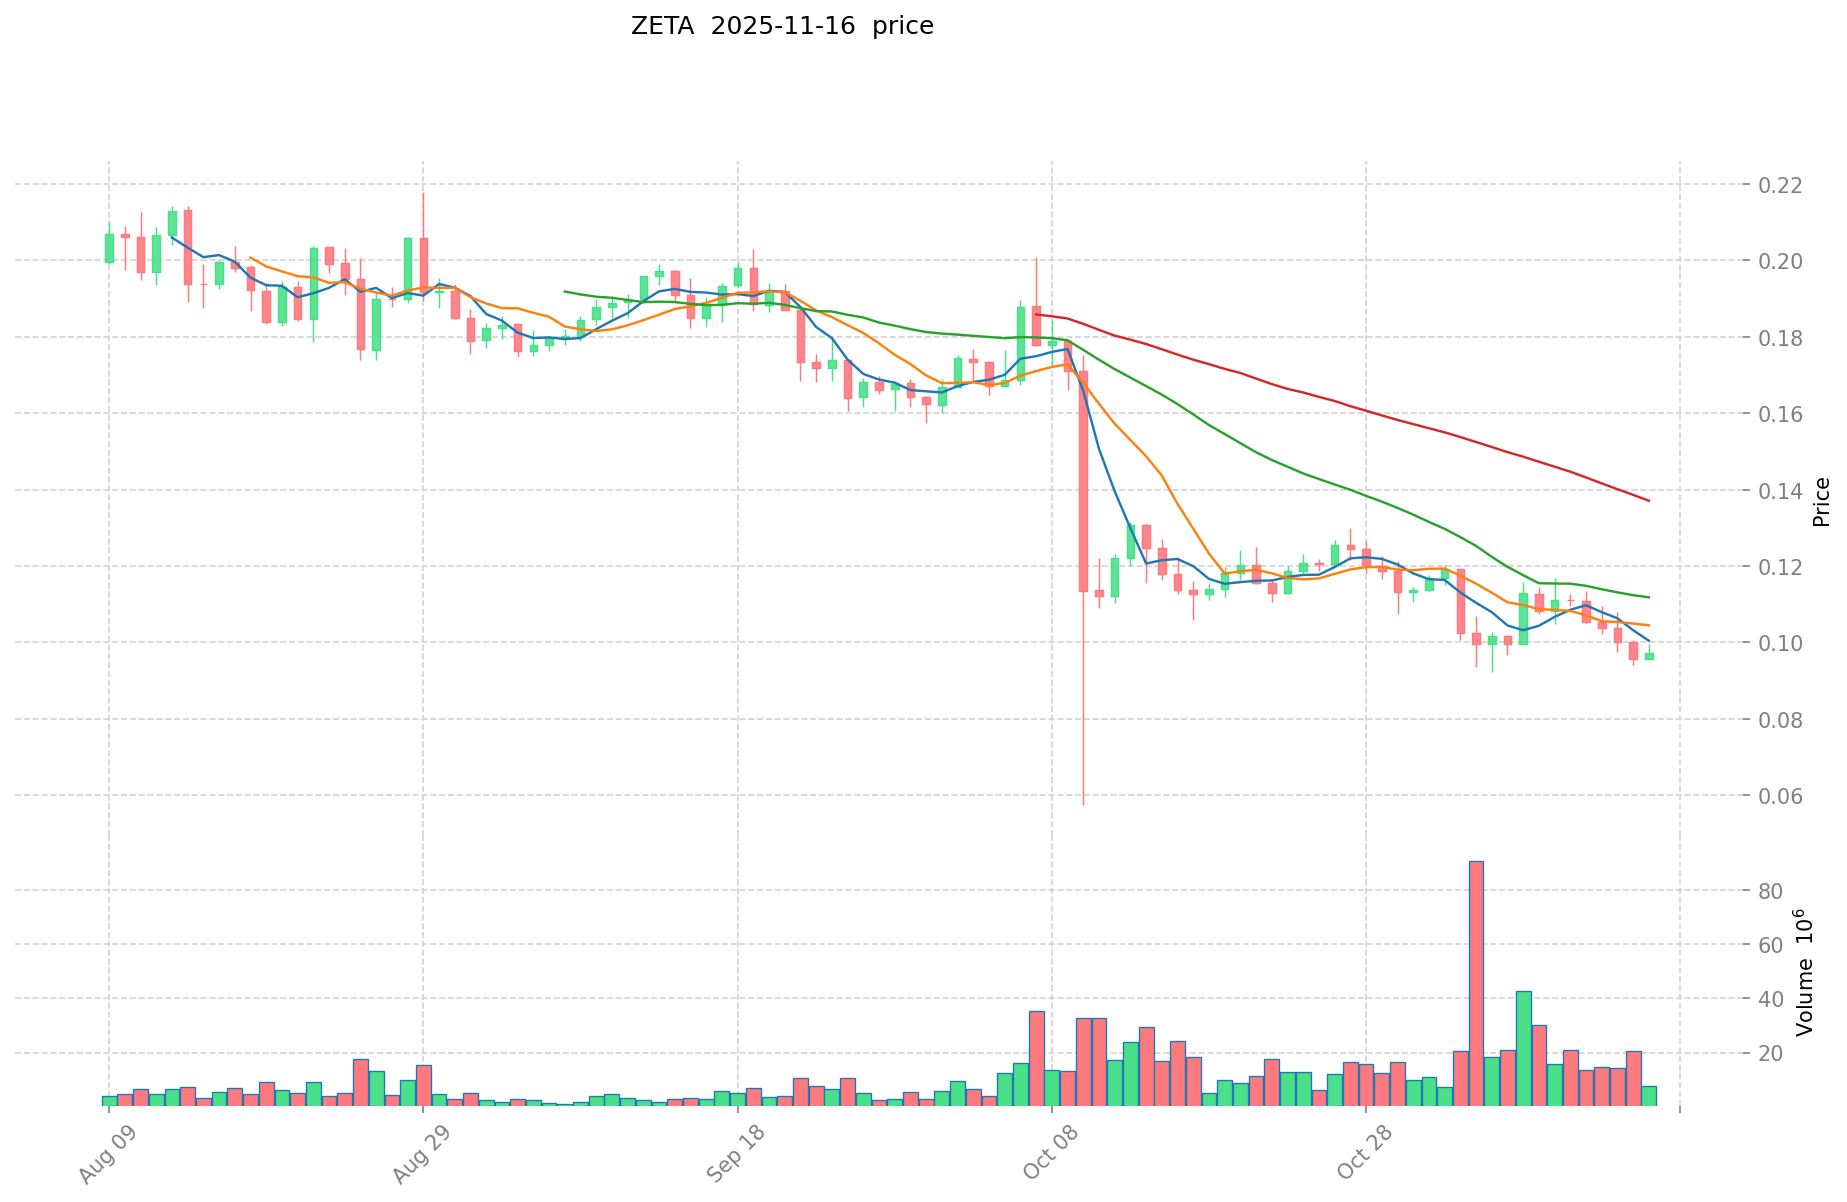
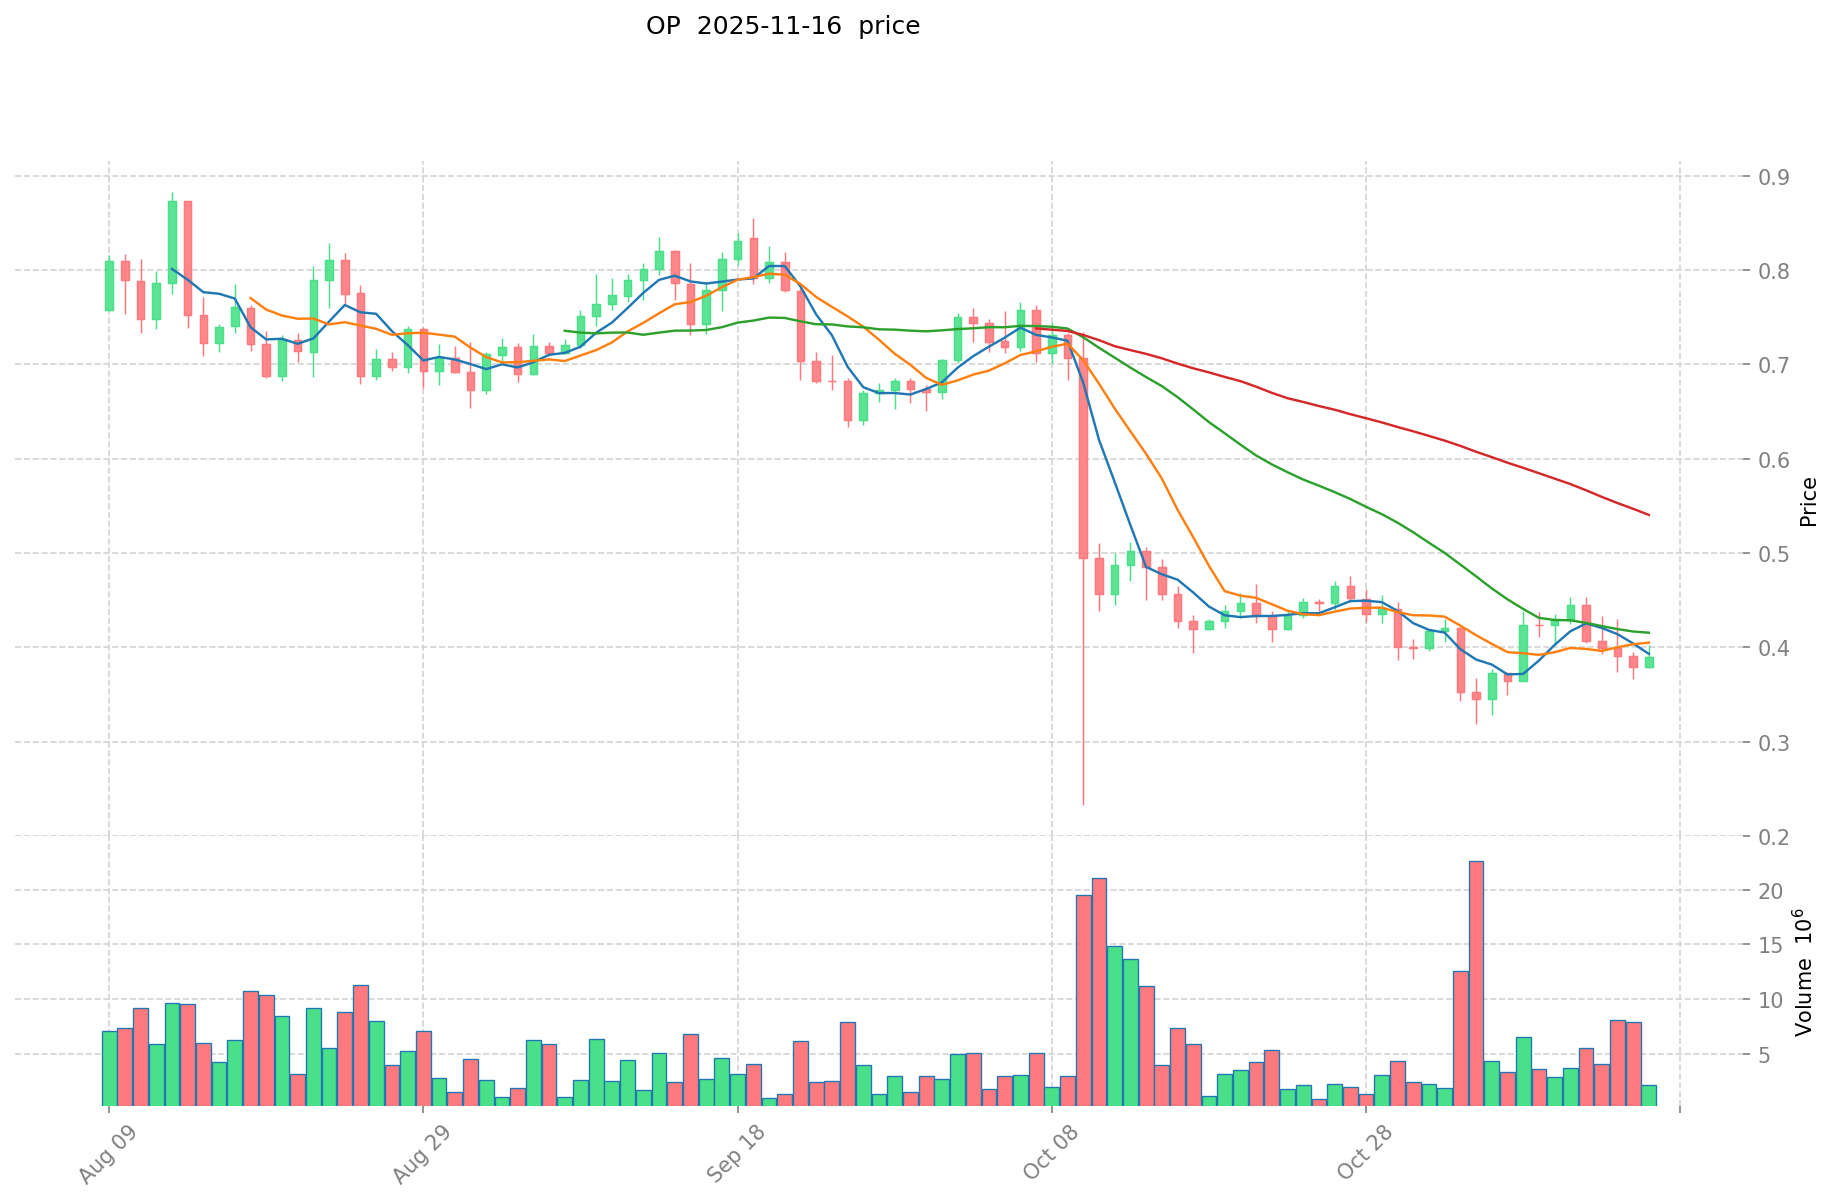
I. Price History Comparison and Current Market Status
ZetaChain (ZETA) and Optimism (OP) Historical Price Trends
- 2024: ZETA reached its all-time high of $2.87 on February 15, 2024.
- 2025: OP hit its all-time high of $4.84 on March 6, 2025.
- Comparative analysis: In the recent market cycle, ZETA dropped from its high of $2.87 to a low of $0.05735, while OP declined from $4.84 to $0.322746.
Current Market Situation (2025-11-16)
- ZETA current price: $0.1051
- OP current price: $0.3945
- 24-hour trading volume: ZETA $1,836,821.28 vs OP $687,861.16
- Market Sentiment Index (Fear & Greed Index): 10 (Extreme Fear)
Click to view real-time prices:
- Check ZETA current price Market Price
- Check OP current price Market Price
II. Core Factors Affecting Investment Value of ZETA vs OP
Supply Mechanisms Comparison (Tokenomics)
-
ZETA: Fixed maximum supply of 2.1 billion tokens, with deflationary mechanisms through burning a portion of transaction fees
-
OP: Total supply of 4.3 billion tokens, gradually released through ecosystem funding, governance, and user airdrops
-
📌 Historical Pattern: Deflationary models like ZETA's tend to support price appreciation during bull markets, while OP's distribution model focuses on ecosystem growth.
Institutional Adoption and Market Applications
- Institutional Holdings: Optimism has attracted more institutional attention with investments from a16z and other major VCs, while ZETA has less documented institutional backing
- Enterprise Adoption: Optimism has stronger enterprise integration through its role in Ethereum scaling, while ZETA focuses on derivatives and trading applications
- Regulatory Stance: Both operate in similar regulatory environments as L2 solutions, though Optimism's closer alignment with Ethereum may offer regulatory clarity advantages
Technical Development and Ecosystem Building
- ZETA Technical Upgrades: Focus on cross-margin trading, advanced order types, and increasing TPS capacity
- OP Technical Development: Advancing the OP Stack, implementing Bedrock upgrade for improved efficiency and security, and developing the Superchain vision
- Ecosystem Comparison: Optimism has a more diverse ecosystem spanning DeFi, NFTs and enterprise applications, while ZETA is primarily concentrated on derivatives trading and financial applications
Macroeconomic Factors and Market Cycles
- Performance During Inflation: Neither has been thoroughly tested in high inflation environments, but OP's stronger ties to Ethereum may provide some stability
- Monetary Policy Impact: Both are affected by crypto market sentiment shifts during interest rate changes
- Geopolitical Factors: Both benefit from increased demand for decentralized finance solutions during periods of financial uncertainty
III. 2025-2030 Price Prediction: ZETA vs OP
Short-term Prediction (2025)
- ZETA: Conservative $0.087897 - $0.1059 | Optimistic $0.1059 - $0.140847
- OP: Conservative $0.35514 - $0.3946 | Optimistic $0.3946 - $0.587954
Mid-term Prediction (2027)
- ZETA may enter a growth phase, with expected price range of $0.0715072806 - $0.1327992354
- OP may enter a strong growth phase, with expected price range of $0.275606397 - $0.788990862
- Key drivers: Institutional capital inflow, ETF, ecosystem development
Long-term Prediction (2030)
- ZETA: Base scenario $0.13245957581715 - $0.165574469771437 | Optimistic scenario $0.165574469771437 - $0.178820427353152
- OP: Base scenario $0.769661703167717 - $0.864788430525525 | Optimistic scenario $0.864788430525525 - $1.227999571346245
View detailed price predictions for ZETA and OP
Disclaimer: The above predictions are based on historical data and market analysis. Cryptocurrency markets are highly volatile and subject to rapid changes. These projections should not be considered as financial advice. Always conduct your own research before making investment decisions.
ZETA:
| 年份 |
预测最高价 |
预测平均价格 |
预测最低价 |
涨跌幅 |
| 2025 |
0.140847 |
0.1059 |
0.087897 |
0 |
| 2026 |
0.132009645 |
0.1233735 |
0.08142651 |
17 |
| 2027 |
0.1327992354 |
0.1276915725 |
0.0715072806 |
21 |
| 2028 |
0.164109208977 |
0.13024540395 |
0.096381598923 |
23 |
| 2029 |
0.183971633079375 |
0.1471773064635 |
0.104495887589085 |
40 |
| 2030 |
0.178820427353152 |
0.165574469771437 |
0.13245957581715 |
57 |
OP:
| 年份 |
预测最高价 |
预测平均价格 |
预测最低价 |
涨跌幅 |
| 2025 |
0.587954 |
0.3946 |
0.35514 |
0 |
| 2026 |
0.5895324 |
0.491277 |
0.47653869 |
24 |
| 2027 |
0.788990862 |
0.5404047 |
0.275606397 |
36 |
| 2028 |
0.72452058129 |
0.664697781 |
0.36558377955 |
68 |
| 2029 |
1.03496767990605 |
0.694609181145 |
0.416765508687 |
75 |
| 2030 |
1.227999571346245 |
0.864788430525525 |
0.769661703167717 |
118 |
IV. Investment Strategy Comparison: ZETA vs OP
Long-term vs Short-term Investment Strategies
- ZETA: Suitable for investors focused on cross-chain interoperability and derivatives trading
- OP: Suitable for investors interested in Ethereum scaling solutions and broader DeFi ecosystem growth
Risk Management and Asset Allocation
- Conservative investors: ZETA: 30% vs OP: 70%
- Aggressive investors: ZETA: 50% vs OP: 50%
- Hedging tools: Stablecoin allocation, options, cross-token portfolio diversification
V. Potential Risk Comparison
Market Risks
- ZETA: Higher volatility due to smaller market cap and narrower ecosystem focus
- OP: Dependency on Ethereum's performance and adoption of Layer 2 solutions
Technical Risks
- ZETA: Scalability, network stability, and cross-chain security vulnerabilities
- OP: Reliance on Ethereum's development, potential rollup technology limitations
Regulatory Risks
- Global regulatory policies may impact both differently, with OP potentially benefiting from closer alignment with Ethereum's regulatory status
VI. Conclusion: Which Is the Better Buy?
📌 Investment Value Summary:
- ZETA advantages: Unique cross-chain functionality, deflationary tokenomics, potential for high growth in emerging omnichain market
- OP advantages: Stronger institutional backing, broader ecosystem, established position in Ethereum scaling landscape
✅ Investment Recommendations:
- New investors: Consider a higher allocation to OP due to its more established ecosystem and lower volatility
- Experienced investors: Balanced approach with exposure to both, leveraging ZETA's growth potential and OP's stability
- Institutional investors: Focus on OP for its institutional adoption and alignment with Ethereum's future, while keeping a smaller allocation in ZETA for diversification
⚠️ Risk Warning: Cryptocurrency markets are highly volatile. This article does not constitute investment advice.
None
VII. FAQ
Q1: What are the main differences between ZETA and OP in terms of their technological focus?
A: ZETA focuses on enabling omnichain, generic smart contracts and messaging between any blockchain, while OP is designed as a low-cost, lightning-fast Ethereum Layer 2 blockchain for scaling Ethereum applications.
Q2: How do the supply mechanisms of ZETA and OP differ?
A: ZETA has a fixed maximum supply of 2.1 billion tokens with deflationary mechanisms through burning transaction fees. OP has a total supply of 4.3 billion tokens, gradually released through ecosystem funding, governance, and user airdrops.
Q3: Which token has shown better price performance in recent market cycles?
A: In the recent market cycle, ZETA dropped from its high of $2.87 to a low of $0.05735, while OP declined from $4.84 to $0.322746. OP has demonstrated relatively better price stability.
Q4: How do institutional adoption and market applications compare between ZETA and OP?
A: Optimism (OP) has attracted more institutional attention with investments from major VCs and has stronger enterprise integration through its role in Ethereum scaling. ZETA has less documented institutional backing and focuses more on derivatives and trading applications.
Q5: What are the long-term price predictions for ZETA and OP by 2030?
A: For ZETA, the base scenario predicts a range of $0.13245957581715 - $0.165574469771437, with an optimistic scenario of $0.165574469771437 - $0.178820427353152. For OP, the base scenario predicts $0.769661703167717 - $0.864788430525525, with an optimistic scenario of $0.864788430525525 - $1.227999571346245.
Q6: How should investors approach asset allocation between ZETA and OP?
A: Conservative investors might consider allocating 30% to ZETA and 70% to OP, while aggressive investors might opt for a 50-50 split. The specific allocation should be based on individual risk tolerance and investment goals.
Q7: What are the primary risks associated with investing in ZETA and OP?
A: For ZETA, key risks include higher volatility due to smaller market cap, scalability issues, and cross-chain security vulnerabilities. For OP, main risks involve dependency on Ethereum's performance, potential rollup technology limitations, and regulatory challenges related to Layer 2 solutions.
* The information is not intended to be and does not constitute financial advice or any other recommendation of any sort offered or endorsed by Gate.


