1. CryptoQuant’s Latest Assessment: Key Resistance Zone Is Emerging
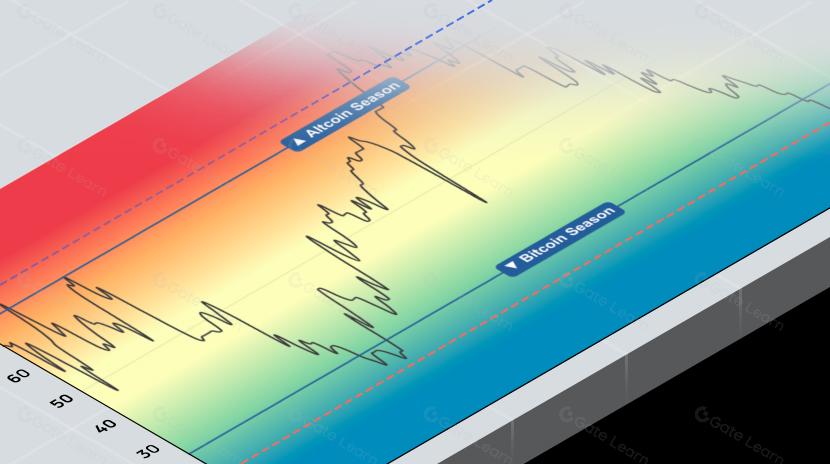
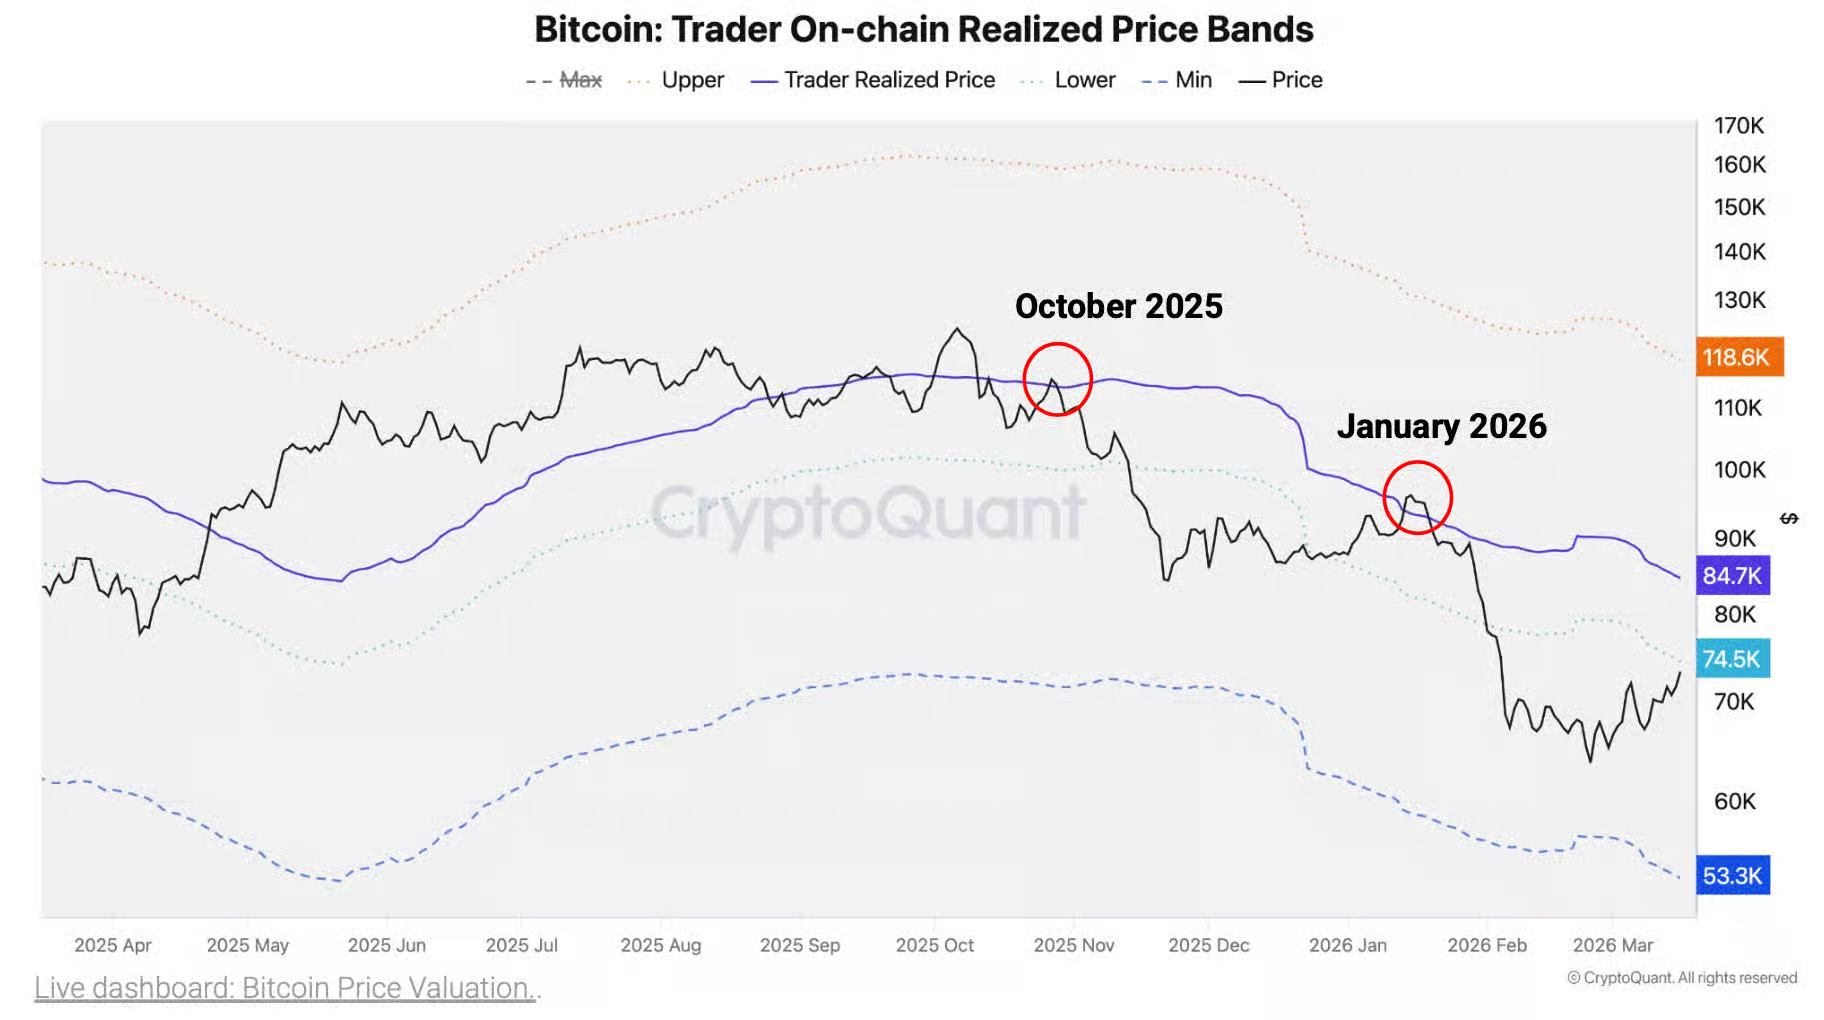 Image source: The Block
Bitcoin has reclaimed the $70,000 level, sparking renewed optimism and fueling discussions about the start of a new bull cycle. Yet, CryptoQuant’s latest analysis adopts a more cautious tone. The firm’s central finding: BTC is likely to face substantial resistance in the $75,000–$85,000 range, which could serve as a pivotal threshold for short-term gains.
This resistance isn’t traditional technical resistance, but a “cost-concentration zone” identified through on-chain data models. In effect, this price band represents a dense cluster of historic holding costs. As BTC approaches these levels, selling pressure naturally intensifies. Structurally, this indicates that the current market is more in a “recovery phase” rather than a sustained upward trend.
It’s crucial to note that on-chain resistance tends to be more restrictive than technical resistance, as it reflects actual capital movements—not just price patterns. Thus, this zone is not merely a price barrier, but a focal point for market psychology and capital dynamics.
2. On-Chain Cost Structure: Why $75,000–$85,000 Is Critical
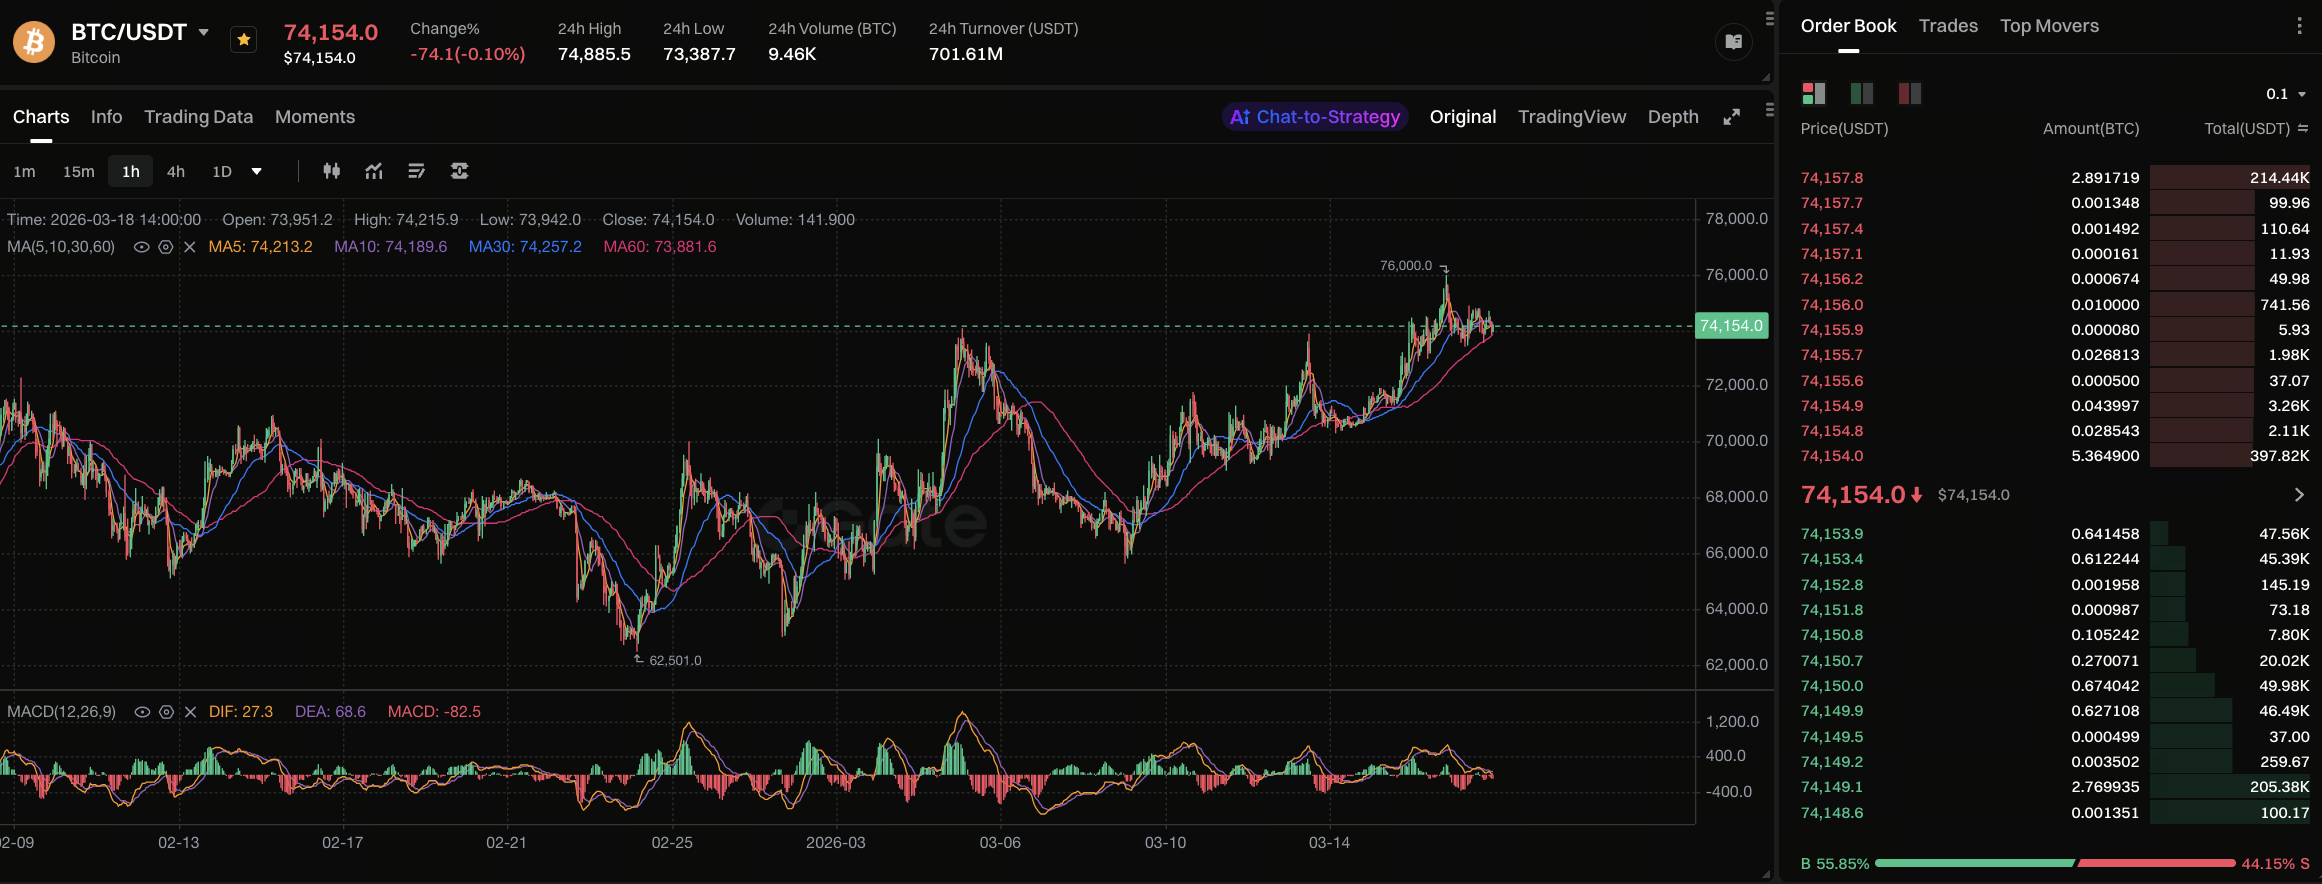 Image source: Gate Market Page
From an on-chain perspective, Bitcoin’s medium- and long-term price action often revolves around “holding costs.” CryptoQuant’s primary metrics include “Realized Price” and its derived ranges, which reveal the average holding cost for various participant groups.
In the current cycle, $75,000 marks the lower bound of short-term traders’ costs, while $85,000 aligns with the average cost for broader market participants. This setup means that as price enters this range, several classic behaviors emerge:
-
Underwater holders tend to sell near their cost basis to break even
-
Short-term traders are more likely to take profits
-
New entrants face higher uncertainty, dampening buying activity
Historical data shows that when price first reaches a major cost-concentration zone, markets typically experience:
-
Noticeable slowdown in upward momentum
-
Significant increase in volatility
-
Frequent false breakouts
Structurally, BTC is confronting not just resistance, but a “supply release zone.” Without sustained new capital absorbing sell pressure, price is unlikely to break through quickly.
3. Derivatives Market and Sentiment Indicators: Are Longs Overheated?
In contrast to on-chain signals, the derivatives market currently exhibits strong optimism. Key indicators show long positions steadily gaining dominance:
-
Perpetual contract funding rates have turned positive, signaling a willingness among longs to pay a premium
-
Open Interest continues to climb
-
Leverage in long positions is rising sharply
These signals typically reflect growing risk appetite, but the sustainability of this optimism is uncertain. Historically, when derivatives markets become uniformly bullish, short-term risks tend to accumulate. The main drivers:
-
Increased leverage amplifies volatility
-
Price pullbacks can trigger cascading liquidations
-
Crowded long trades may result in “long squeeze” scenarios
The current market can be summarized as:
This divergence suggests the market is entering a consolidation phase, rather than a straightforward upward move.
4. Macro Liquidity and Rate Environment: External Factors Constraining BTC
Beyond on-chain and structural factors, Bitcoin’s price is heavily influenced by macro conditions, especially interest rates and liquidity. At present, several variables remain unresolved:
-
The Federal Reserve has not definitively shifted toward easing
-
Inflation risks remain persistent
-
Global liquidity recovery is still limited
In a high-rate environment, risk assets face valuation pressure, as rising capital costs reduce investors’ willingness to allocate to volatile assets. A stronger dollar may also weigh on BTC. Historically, Bitcoin rallies have coincided with liquidity expansion cycles, including:
Currently, these conditions are not fully in place, so BTC’s upside depends more on structural capital flows—such as ETF inflows—than macro drivers.
5. Exchange Flows: Potential Sell Pressure and Market Dynamics
Exchange fund flows are another key indicator. Recent data shows a rise in Bitcoin inflows to exchanges, typically signaling increased potential selling pressure.
Behaviorally, funds moving to exchanges usually indicate:
As price nears key resistance, this signal becomes especially relevant. Market participants are more inclined to:
Current capital dynamics can be summarized as:
-
Long-term holders remain relatively stable
-
Short-term capital is becoming more active, gradually releasing positions
-
Market supply is increasing
This structure suggests that even if price continues rising, the slope may flatten and volatility may rise.
6. BTC Price Outlook: Three Core Scenarios
Based on current on-chain data, market structure, and macro context, BTC’s future trajectory can be analyzed through three main scenarios:
- Consolidation (highest probability): Bitcoin oscillates between $70,000 and $85,000, entering a phase of long-short competition. Key features:
-
Frequent but unsustainable breakout attempts
-
Gradually declining trading volume
-
Market awaits new macro or capital signals
- Upward Breakout (requires new drivers): If BTC breaks above $85,000, the following conditions must be met:
Once breached, this range becomes support and could unlock further upside.
- Correction (risk scenario): If macro conditions turn unfavorable or leverage liquidations occur, BTC may retreat to the $65,000–$70,000 range. Triggers include expectations of higher rates, broad risk asset declines, or concentrated liquidations in derivatives markets. While this scenario is less likely, it merits close attention in high-leverage environments.
7. Investment Strategy: Navigating the Current Market Structure
Given today’s complex market conditions, single judgments rarely suffice. A more effective approach is to build a “structural response framework,” guided by these principles:
-
Manage positions and timing: Avoid aggressive accumulation near resistance zones; stay flexible.
-
Monitor key indicators:
-
Operate in batches: Use phased entry and profit-taking strategies to reduce volatility risk.
-
Watch leverage risk: When derivatives market sentiment heats up, avoid high leverage to prevent losses from extreme volatility.
Conclusion
CryptoQuant’s view on the $75,000–$85,000 resistance zone highlights a fundamental rule in the Bitcoin market: price is shaped not just by sentiment, but by cost structure, capital flows, and macro environment.
BTC is currently in a classic transition phase, marked by:
-
Improving sentiment, but persistent structural pressure
-
Capital inflows alongside rising supply
-
Macro conditions not fully supporting risk asset appreciation
In this context, short-term consolidation is likely to dominate, while true trend breakthroughs will require stronger external drivers and capital support. For investors, understanding this structure is more valuable than simply forecasting price.