Ethereum Faces Critical Support: Can the $2,800 Level Hold?

2025-11-24 03:31:09
Ethereum (ETH) is approaching the key $2,800 support level once again. This article examines the importance of this price point and recent shifts in on-chain data. It also discusses possible future trends to provide investors with a clear and informed outlook.

Current Price Review and Market Context


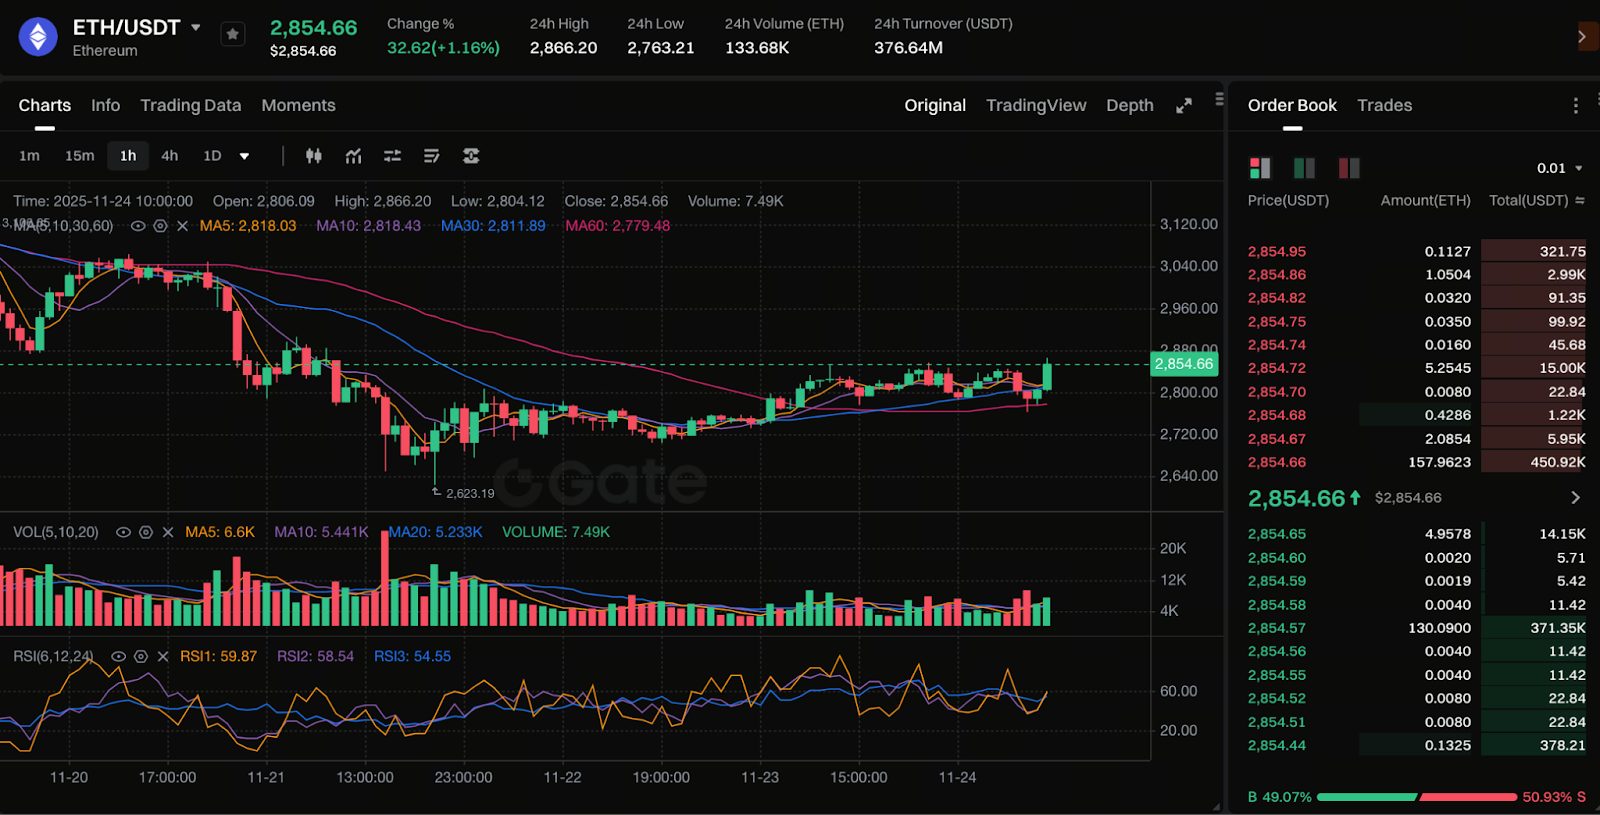
Chart: https://www.gate.com/trade/ETH_USDT

ETH has recently traded in a volatile range around $2,800, drawing intense focus from market participants. In recent sessions, buyers and sellers have battled for dominance at this level, making it the focal point of current market activity. On-chain and technical analysis both identify this zone as a key support area, which also aligns with the “realized price”—a critical metric reflecting the true average cost for holders. Historically, when ETH approaches this range, market sentiment tends to reverse in the short term. Whether ETH can hold above $2,800 will play a decisive role in shaping its next move.

Why Is $2,800 a Critical Support Level?

Technically, $2,800 stands out as a historically robust support zone, having served as the base for major bottoms multiple times. Across multiple timeframes, this range benefits from support from trendlines, heavy trading volume, and long-term moving averages—creating a confluence of support levels. On-chain data shows most ETH holders have an average cost basis in this zone. If ETH remains below this level, investors may become more reluctant to realize losses, which could fuel further selling pressure. Conversely, holding above $2,800 may trigger a short-term rebound.

Large “whale” addresses are steadily accumulating at this level, while smaller holders are reducing their exposure. This pattern signals a redistribution of tokens: weaker hands are exiting and stronger hands are accumulating, potentially signaling a trend reversal. As a result, many traders see this area as a potential “bottoming zone.”

What Are On-Chain and Technical Indicators Revealing?

Recent on-chain data indicates sustained buying support for ETH near $2,872, suggesting continued market willingness to absorb supply at these levels. From a technical pattern perspective, ETH has formed an “inverse head and shoulders” pattern. A breakout above the neckline could unleash renewed bullish momentum and offer a pathway to higher price targets. When combined with Fibonacci levels and the realized price distribution, these factors suggest that support is strong. If support holds, ETH could stage a short-term rebound.

Nevertheless, ETH’s trajectory is not dictated solely by technical or on-chain metrics—macroeconomic conditions remain highly influential. US employment reports, shifts in interest rate expectations, and overall risk sentiment across asset classes can quickly disrupt the current equilibrium.

What Are the Risks If Support Breaks?

If ETH drops below $2,800 with rising volume, it may trigger a cascading decline. Analysts warn that tightened liquidity, major capital outflows, or mass liquidations of leveraged positions could intensify selling and push ETH to lower levels.

Key technical zones are often marked by sharp volatility, so short-term traders should be especially vigilant about the directional risks associated with rapid breakdowns. During this phase, most investors should focus on disciplined risk management instead of trying to anticipate the next price movement.

Investor Strategies at Key Levels

When approaching critical price zones, investors should remain composed and make strategic decisions, considering the following:

  • Monitor whether ETH can maintain support above $2,800 and close consistently at or above this level to confirm the validity of support;
  • If ETH breaks key resistance or rallies with strong volume, treat this as a signal to watch, but avoid chasing momentum blindly;
  • If ETH demonstrates weakness or breaches key support, avoid increasing leverage or shorting aggressively to sidestep potential bull or bear traps;
  • Implement staggered entry strategies to reduce risk. Use stop-loss orders to protect against losses from concentrated positions;
  • Track macroeconomic indicators—such as employment data, interest rate trends, and dollar index fluctuations—as these often determine the direction of risk assets.

Conclusion

In summary, $2,800 is more than a technical support level for ETH—it represents a crossroads for capital flows and market sentiment. If ETH holds this range, it could build a strong foundation for a rebound and a potential interim bottom. However, if support fails, investors should remain alert to the risks and uncertainties of further declines. Patience, discipline, and a sound strategy that matches each investor’s risk tolerance are essential for navigating this phase.

Author: Max
Disclaimer
* The information is not intended to be and does not constitute financial advice or any other recommendation of any sort offered or endorsed by Gate.
* This article may not be reproduced, transmitted or copied without referencing Gate. Contravention is an infringement of Copyright Act and may be subject to legal action.

Share

Crypto Calendar
Tokenların Kilidini Aç
Wormhole, 3 Nisan'da 1.280.000.000 W token açacak ve bu, mevcut dolaşımdaki arzın yaklaşık %28,39'unu oluşturacak.
W
-7.32%
2026-04-02
Tokenların Kilidini Aç
Pyth Network, 19 May'da 2.130.000.000 PYTH tokenini serbest bırakacak ve bu, mevcut dolaşım arzının yaklaşık %36,96'sını oluşturacak.
PYTH
2.25%
2026-05-18
Tokenların Kilidini Aç
Pump.fun, 12 Temmuz'da 82,500,000,000 PUMP token'ı kilidini açacak ve bu, mevcut dolaşımdaki arzın yaklaşık %23,31'ini oluşturacak.
PUMP
-3.37%
2026-07-11
Token Kilidi Açma
Succinct, 5 Ağustos'ta mevcut dolaşımdaki arzın yaklaşık %104,17'sini oluşturan 208,330,000 PROVE token'ını serbest bırakacak.
PROVE
2026-08-04
sign up guide logosign up guide logo
sign up guide content imgsign up guide content img
Sign Up

Related Articles

What is Fartcoin? All You Need to Know About FARTCOIN
Intermediate

What is Fartcoin? All You Need to Know About FARTCOIN

Fartcoin (FARTCOIN) is a representative meme coin within the Solana ecosystem based on an AI-driven narrative. Its core concept originated from an experiment aimed at exploring the "boundaries between AI Agents and humor." More than just a digital asset with social attributes, the project deeply couples absurd humor culture with on-chain financial logic by integrating autonomous AI interaction models.
2026-03-04 05:38:51
Gold Price Forecast for the Next Five Years: 2026–2030 Trend Outlook and Investment Implications, Could It Reach $6,000?
Beginner

Gold Price Forecast for the Next Five Years: 2026–2030 Trend Outlook and Investment Implications, Could It Reach $6,000?

Analyze current gold price trends alongside authoritative five-year forecasts, integrating an evaluation of market risks and opportunities. This gives investors insight into the potential trajectory of gold prices and the main drivers expected to shape the market over the next five years.
2026-01-26 03:33:33
2026 Silver Price Forecast: Bull Market Continuation or High-Level Pullback? In-Depth Analysis of Silver Candlestick Chart
Beginner

2026 Silver Price Forecast: Bull Market Continuation or High-Level Pullback? In-Depth Analysis of Silver Candlestick Chart

2026 Silver Price Forecast: Latest Outlook This article integrates current market trends, silver candlestick chart analysis, and momentum factors to assess the potential key support and resistance levels, upside targets, and pullback risks for silver prices. The goal is to help investors make informed, rational decisions.
2026-01-28 08:36:39
Crypto Future Profit Calculator: How to Calculate Your Potential Gains
Beginner

Crypto Future Profit Calculator: How to Calculate Your Potential Gains

Crypto Future Profit Calculator helps traders estimate potential earnings from futures contracts by considering entry price, leverage, fees, and market movement.
2025-02-09 17:28:28
Gate Alpha Launches Points System: Trade On-Chain, Earn Points, Unlock Airdrops
Beginner

Gate Alpha Launches Points System: Trade On-Chain, Earn Points, Unlock Airdrops

Gate Alpha has officially launched its points mechanism, built around four core strengths: speed, simplicity, quality, and security. It offers a seamless connection between centralized exchange (CEX) and decentralized exchange (DEX) trading ecosystems. Gate Alpha enables users to explore high-quality assets with minimal barriers and trade early-stage, high-potential on-chain tokens directly using USDT from their exchange accounts. The new points mechanism brings strong time sensitivity, diverse user engagement formats, and substantial incentives. As part of a limited three-week Points Carnival, Gate Alpha is rolling out five themed campaigns that deliver multi-layered rewards, including token airdrops, mystery boxes, and access to a prize pool worth hundreds of thousands of dollars. Individual accounts can earn over 130 USDT in rewards during the event.
2025-05-29 05:44:43
What is Oasis Network (ROSE)?
Beginner

What is Oasis Network (ROSE)?

The Oasis Network is driving the development of Web3 and AI through smart privacy technology. With its privacy protection, high scalability, and cross-chain interoperability, the Oasis Network is providing new possibilities for the future development of decentralized applications.
2025-05-20 09:41:15