Why Did Gold Suddenly Plunge? An Unexpected Market Correction
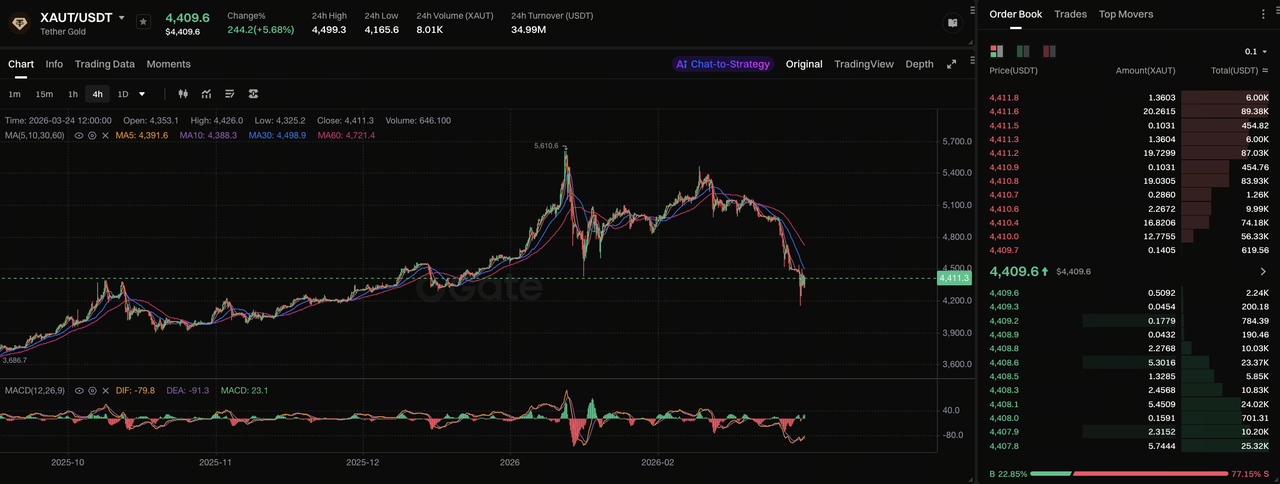 Image source: Gate Market Page
Following a year-long rally, the gold market saw a dramatic correction. Prices retreated sharply from their recent highs, dropping more than 20% in just a few trading sessions. This was not a gradual trend reversal, but a classic case of “accelerated decline”—marked by heightened volatility, surging trading volume, and a rapid shift in market sentiment.
Notably, the speed of this downturn far exceeded historical averages, signaling a shift in the market’s internal structure rather than simply weaker fundamentals.
Macro Variables Reverse: Dual Pressure from the Dollar and Interest Rates
As a non-yielding asset, gold’s price is highly sensitive to macroeconomic conditions—especially the US dollar and interest rates.
Gold typically benefits when markets expect rates to fall; however, when those expectations reverse, gold comes under pressure. In this downturn, a stronger dollar and upwardly revised rate projections set the backdrop.
Inflation expectations have resurfaced due to rising energy prices, prompting investors to reassess the sustainability of loose monetary policy.
At the same time, capital has started to flow back into dollar-denominated assets, strengthening the dollar index and putting additional pressure on gold.
While these macro shifts provide a logical explanation for gold’s correction, they alone do not account for the severity of the decline.
The Real Trigger: Leverage Structure and a Liquidity Crunch
The true catalyst behind gold’s rapid drop was the market’s internal leverage structure.
During the previous rally, significant capital entered leveraged long positions in gold via futures, derivatives, and similar instruments, creating a crowded long-side trade. Once prices began to pull back, this structure quickly unraveled.
- Prices broke through key technical levels, triggering algorithmic trading and stop-loss orders;
- Exchanges raised margin requirements, forcing some highly leveraged positions to liquidate;
- Forced liquidations drove prices down further, setting off a chain reaction.
This sequence is a textbook “liquidity crunch”—not all investors turned bearish on gold, but many were forced to sell.
The Significance of Silver’s Plunge: Amplified Risk
Silver’s decline was even more severe than gold’s, offering important insight. Silver serves as both a precious and industrial metal, and when risk appetite falls, it tends to be more volatile. As a result, during deleveraging phases, silver often acts as an “amplifier.”
When silver falls much more sharply than gold, it typically signals that the market is experiencing a deeper risk unwinding, not just a price correction. This further supports the view that the current move is a structural deleveraging, not a routine pullback.
Changing Fund Flows: Who’s Exiting and Who’s Accumulating?
From a capital flow perspective, this correction has revealed clear divergence.
Short-term capital—particularly investors using ETFs and derivatives—has exited rapidly. These funds are highly sensitive to price swings and tend to pull out quickly when trends reverse.
Long-term capital, especially central banks, continues to hold gold allocations. While the pace of accumulation may have slowed, the overall direction remains unchanged.
This divergence indicates that short-term price volatility is driven by trading behavior, while the long-term investment thesis remains intact.
Historical Review: The “Standard Script” of Gold Sell-Offs
Historically, major gold sell-offs have followed a familiar pattern:
- Macro environment shifts (higher rates or a stronger dollar)
- Market expectations turn
- Leverage is unwound in concentrated fashion
- Prices drop sharply, completing a valuation reset
This pattern held true in both the high-rate cycle of 1980 and the prolonged correction after 2011. Gold is not just a safe-haven asset—its price is also deeply influenced by financial structure and market sentiment.
The Essence of This Downturn: A Correction After Overtrading
This episode represents a price correction following “overtrading.” During the rally, markets priced in bullish expectations in advance, pushing prices above fundamental value. When new bullish catalysts failed to materialize, prices began to revert.
This reversion is rarely gradual—it typically happens through sharp volatility.
Will Gold Rebound or Enter a Bear Market?
Future trends can be analyzed from three perspectives:
- Short term: The market is still deleveraging, so prices may remain volatile or even retest recent lows.
- Medium term: The key factors are the dollar and interest rates. If high rates persist, gold’s upside will remain limited.
- Long term: Global debt levels, changes in monetary systems, and geopolitical risks continue to support gold’s value. This means gold’s long-term allocation value remains substantial.
Conclusion:
Gold’s decline does not mark the end of its safe-haven role—it reflects a structural adjustment in the market. Under the combined influence of macro factors and leverage, prices have undergone a sharp correction.
For investors, the priority is not to predict short-term moves but to understand the underlying market drivers. In an environment where uncertainty remains, gold continues to be an indispensable component of global asset allocation.