Why Stablecoins Are the Top Entry Point for Monitoring Market Liquidity
In traditional markets, risk appetite analysis typically starts with interest rates, credit spreads, funding costs, and transaction structures. In the crypto market, stablecoins serve as the most direct “cash equivalent.” Nearly all trading activities—whether buying BTC, increasing ETH allocations, or engaging in high-volatility sectors—begin with stablecoin settlement.
This means stablecoins are more than just payment instruments; they’re also the primary vehicles for risk budgeting.
When the supply of stablecoins expands and available balances rise, the market’s buying power strengthens. Conversely, when stablecoin totals contract or exit trading venues, risk assets generally face greater downside pressure.
Start with three foundational principles:
-
An increase in stablecoins doesn’t mean prices will rise immediately, but it typically signals more “available ammunition.”
-
A flat stablecoin trend suggests the market is shifting to a stock-based game, with faster rotations and less sustained trends.
-
A decline in stablecoins often aligns with periods of deleveraging, risk-off moves, or profit taking.
From a research efficiency perspective, the advantage of this “single line” is that it confirms trends slightly after price, but it’s often more stable than sentiment indicators and less noisy than daily trading volume.
How to Interpret the “Single Line”: Direction, Slope, and Inflection Points
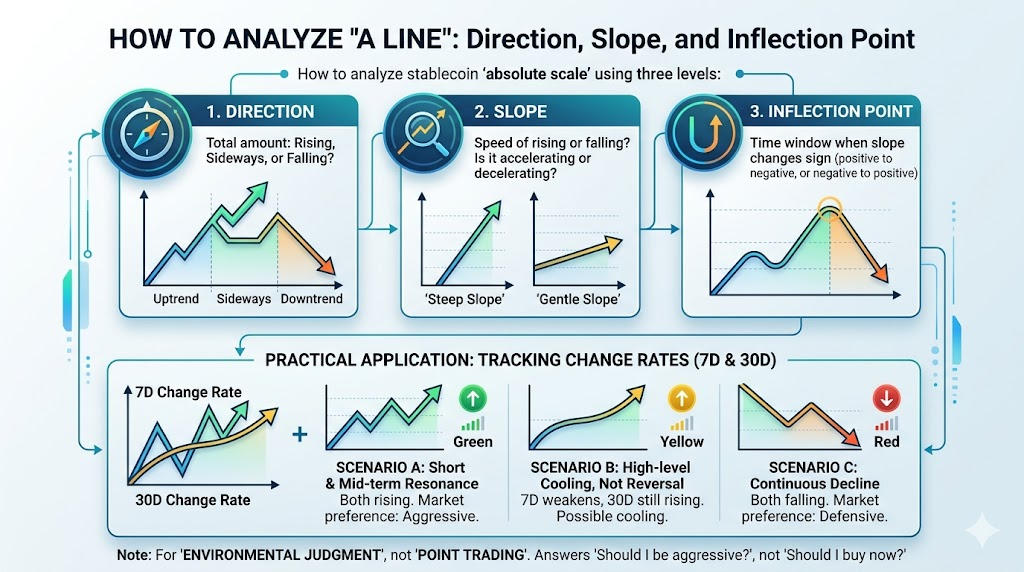
Many investors focus only on the “absolute scale” of stablecoins, overlooking more important marginal signals. In practice, break down the “single line” into three layers:
-
Direction: Is the total supply rising, flat, or falling?
-
Slope: Is the rate of increase or decrease accelerating?
-
Inflection Point: When does the slope shift from positive to negative, or vice versa?
A practical approach is to track both 7-day and 30-day rates of change.
If both the 7-day and 30-day rates are climbing, short- and medium-term capital preferences are in sync. If the 7-day weakens but the 30-day remains up, it’s usually a “cooling off at highs,” not a trend reversal. If both decline together, it’s time to raise your defensive posture.
It’s important to note: stablecoin indicators are best for “environmental assessment,” not for pinpointing entry or exit points. They help answer, “Should I be more aggressive?”—not “Should I chase this rally right now?”
Two Confirmation Dimensions: Avoiding Single-Indicator Misjudgments
Looking only at total stablecoin supply can lead to misreading cross-chain transfers, institutional settlements, or other non-risk trades as real buying. To avoid this, add two confirmation dimensions.
Dimension One: Changes in Exchange Stablecoin Reserves
If total stablecoin supply rises and exchange available reserves also increase, funds are more likely “ready to trade.”
If total supply rises but exchange reserves don’t, it could be cross-chain movement, custodial migration, or OTC settlement—so market signals should be discounted.
Key metrics to monitor:
-
Net inflow trends of stablecoins into major centralized exchanges
-
Synchronization between reserve changes and spot trading volume surges
-
Price response efficiency within 24 to 72 hours after large inflows
Dimension Two: BTC Market Share and the Risk Diffusion Sequence
Stablecoin inflows don’t reach all assets at once. The typical flow is:
BTC → ETH → High Beta Altcoins.
BTC market share helps identify which rotation stage the market is in.
-
Stablecoin inflows + rising BTC market share: Risk appetite is improving, but capital focuses on core assets first.
-
Stablecoin inflows + declining BTC market share: Capital is spreading to secondary assets and altcoins.
-
Stablecoin flat + broad small-cap rallies: More sentiment-driven, so watch for vulnerability at highs.
From Liquidity to Rotation: A Four-Stage Market Behavior Model
Turning liquidity analysis into actionable strategies means identifying the market’s current stage. Use this model for weekly reviews and portfolio decisions.
-
Stage A: Replenishing Ammunition (Early Recovery)
Features: Stablecoins just flip positive from lows, BTC leads the recovery, volatility stays high.
Response: Scale in positions gradually, prioritize high-liquidity assets, avoid chasing narratives.
-
Stage B: Risk Diffusion (Trend Strengthening)
Features: Stablecoins see sustained net inflows, exchange reserves improve, ETH and major sectors begin to rotate.
Response: Gradually increase structural allocations to core assets while maintaining cash buffers.
-
Stage C: High-Level Game (Marginal Slowdown)
Features: Prices remain strong, but stablecoin growth slows or flattens, and sector rotation accelerates.
Response: Reduce chasing rallies, tighten take-profit discipline, monitor trade depth and drawdown quality.
-
Stage D: Risk Contraction (Defensive Mode)
Features: Stablecoins decline for several periods, rebounds lose steam, correlations rise.
Response: Focus on lowering volatility before seeking returns; increase stablecoin allocation, shorten holding periods.
Practical Template: Turning Research Into Weekly Action
To avoid “knowing a lot but executing chaotically,” manage decisions with a fixed checklist.
Weekly Monitoring Checklist
-
Are the 7-day and 30-day stablecoin supply changes moving in the same direction?
-
Are exchange stablecoin reserves showing net inflows or outflows?
-
Is BTC market share rising, flat, or declining?
-
Is spot trading’s share increasing, or are derivatives still dominant?
-
Are shifts between major and altcoin strength aligned with liquidity trends?
Position Adjustment Rules (Sample)
-
If three or more core indicators point upward: Increase risk exposure up to 70%–80% of strategy limits.
-
If indicators are mixed: Stay neutral, wait for confirmation, don’t add leverage.
-
If most indicators weaken: Cut risk positions to 30%–40%, prioritize high-liquidity holdings.
Risk Control Discipline
-
Don’t increase annual return targets after a single day’s rally.
-
Don’t add low-liquidity positions when liquidity is weakening.
-
Don’t let any single theme exceed your portfolio’s risk budget.
Common Pitfalls and How to Fix Them
-
Pitfall 1: Treating indicators as real-time signals
Stablecoin inflows mean an improved environment, not an instant buy signal. Using macro indicators for minute-level trades often leads to repeated stop-losses in volatile markets.
-
Pitfall 2: Ignoring structural differences
USDT and USDC serve different use cases and have distinct on-chain distributions; the same increase can affect risk assets differently.
-
Pitfall 3: Focusing only on total supply, not the flow path
“Minting more” doesn’t mean those stablecoins are entering exchanges or becoming bids. Without path confirmation, market trend sustainability is often overestimated.
-
Pitfall 4: Ignoring macro constraints
USD liquidity, interest rate outlook, and regulatory shocks all shift capital preferences. The stablecoin framework must be integrated with macro context—not used in isolation.
Conclusion: Use the “Single Line” to Set Your Rhythm, Not Chase Market Noise
Stablecoin liquidity matters not because it predicts every price swing, but because it consistently answers a more critical question:
Is there new risk capital in the market, and where is it flowing?
-
If the answer is “yes, and it’s spreading,” raise risk exposure moderately.
-
If the answer is “yes, but slowing,” curb your impulse to chase highs.
-
If the answer is “contracting,” focus first on controlling drawdowns.
For most investors, this structured approach is more sustainable than chasing the latest hot spot. In the high-volatility, narrative-driven, fast-rotating crypto market, the core skill for long-term survival and generating excess returns remains:
Managing an unstable market with stable methods.