2025 Review: Gold’s Performance as a Safe-Haven Asset
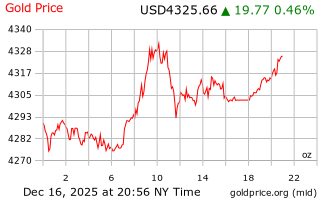
Chart: https://goldprice.org/
Throughout 2025, gold maintained a robust upward trajectory, repeatedly setting new record highs. Strong demand for safe-haven investments and increased gold holdings by global central banks provided significant support. This performance reinforced gold’s status as a premier global safe-haven asset and a key portfolio hedging instrument, establishing a solid foundation for the 2026 market outlook.
Moreover, expectations of mid-term volatility in the US Dollar Index and persistent global economic uncertainty have driven capital flows from risk assets toward defensive assets like gold.
Key Fundamental Drivers for Gold Prices in 2026
Fundamentally, several factors will play a pivotal role in shaping gold prices in 2026:
Federal Reserve Monetary Policy Outlook: Anticipated interest rate cuts are likely to reduce real yields and spur demand for gold. This expectation is already largely priced into the market.
Global Political and Economic Uncertainty: Heightened geopolitical tensions and ongoing trade disputes continue to enhance gold’s appeal as a safe-haven asset.
Central Bank Gold Purchases: Central banks worldwide—especially those in emerging markets—are steadily increasing their gold reserves. This structural demand underpins the medium- and long-term price trajectory.
Mainstream Institutional Gold Price Forecasts for 2026
Major financial institutions generally hold similar views on 2026 gold prices, though some differences remain:
- Investment Bank Projections: Most leading banks forecast gold’s trading range in 2026 to be between $4,000 and $5,300 per ounce.
- Morgan Stanley projects year-end prices to reach approximately $4,800 per ounce.
- Analysts at Citi and Bank of America see potential for gold to hit $5,000 per ounce.
- Extreme scenario models suggest the possibility of even higher “outlier” price forecasts.
While some outlooks remain cautious, the overwhelming majority of forecasts reflect a neutral-to-bullish sentiment for gold prices in 2026.
Candlestick Chart Analysis: Key Trends, Resistance, and Support Levels
Candlestick charts are an essential tool in technical analysis for evaluating gold price movements:
Trend Structure Analysis: Spot gold has recently sustained an upward channel, with close monitoring of major support and resistance zones. On the daily chart, the long-term support line remains intact, while short-term resistance is positioned near historic highs.
Critical Support and Resistance Levels:
- Support: $4,100–$4,200 per ounce range
- Resistance: $4,350–$4,400 per ounce range
If prices remain above support and decisively break through resistance, a new rally could emerge. Conversely, failure to hold key support may lead to short-term corrections.
2026 Gold Investment: Risk and Opportunity Assessment
Opportunities
- Anticipated low interest rates are boosting demand for physical gold and gold ETFs
- Geopolitical and macroeconomic uncertainty is driving increased safe-haven demand
Risks
- A strengthening US dollar could limit gold price gains
- Shifts in market liquidity may trigger short-term volatility
- If economic growth accelerates, demand for safe-haven assets may decline
How to Use Candlestick Charts to Sharpen Trading Strategies
Investors can leverage candlestick charts alongside moving averages, MACD, and other indicators to boost trading strategy precision:
- Trend-following approach: Focus on long-term moving average support levels
- Breakout strategy: Confirm signals using Bollinger Bands or volume breakouts
- Risk management: Set stop-loss levels to safeguard capital


