RSI Heatmap Explained: Understanding Crypto Market Sentiment

2025-09-10 06:49:31
Beginner
Quick Reads
The RSI Heatmap allows investors to rapidly spot overheated assets and potentially undervalued ones, without examining the technical indicators for each coin individually.

What Is the RSI Heatmap?

The RSI Heatmap provides a visual display of the Relative Strength Index (RSI) values across multiple assets, presenting this information in a heatmap format.

  • When the RSI is high (for example, above 70), the heatmap typically uses red or orange to indicate a potential overbought condition.
  • When the RSI is low (for example, below 30), blue or green is used to signal that the market may be experiencing heavy selling pressure.

This visualization enables investors to instantly identify which cryptocurrencies are overheating or possibly undervalued—eliminating the need to check individual technical indicators for each asset.

How the RSI Heatmap Works

The RSI formula is: RSI = 100 - (100 / (1 + RS))

Where RS stands for Average Gain divided by Average Loss. The standard calculation period is 14 days, though this can be adjusted based on specific needs. On the heatmap, RSI values are mapped to different colors, enabling investors to quickly spot trends. For example:

  • RSI above 70 → Indicates that the market may be overheated and approaching a potential overbought zone.
  • RSI below 30 → Indicates that the market may be oversold and entering a potential buying opportunity.

Crypto Market RSI Heatmap: Use Cases

In the cryptocurrency space, the RSI Heatmap is especially valuable due to the sector’s high volatility, 24/7 trading activity, and wide range of investment options. For example, a Crypto Market RSI Heatmap can simultaneously reveal:

  • Whether Bitcoin (BTC) is nearing overbought territory, alerting investors to the potential for a price correction.
  • Whether Ethereum (ETH) has dropped to oversold levels, presenting long-term entry opportunities.
  • The aggregate sentiment in altcoins—showing whether the market is caught in a speculative buying spree or a panic-driven sell-off.
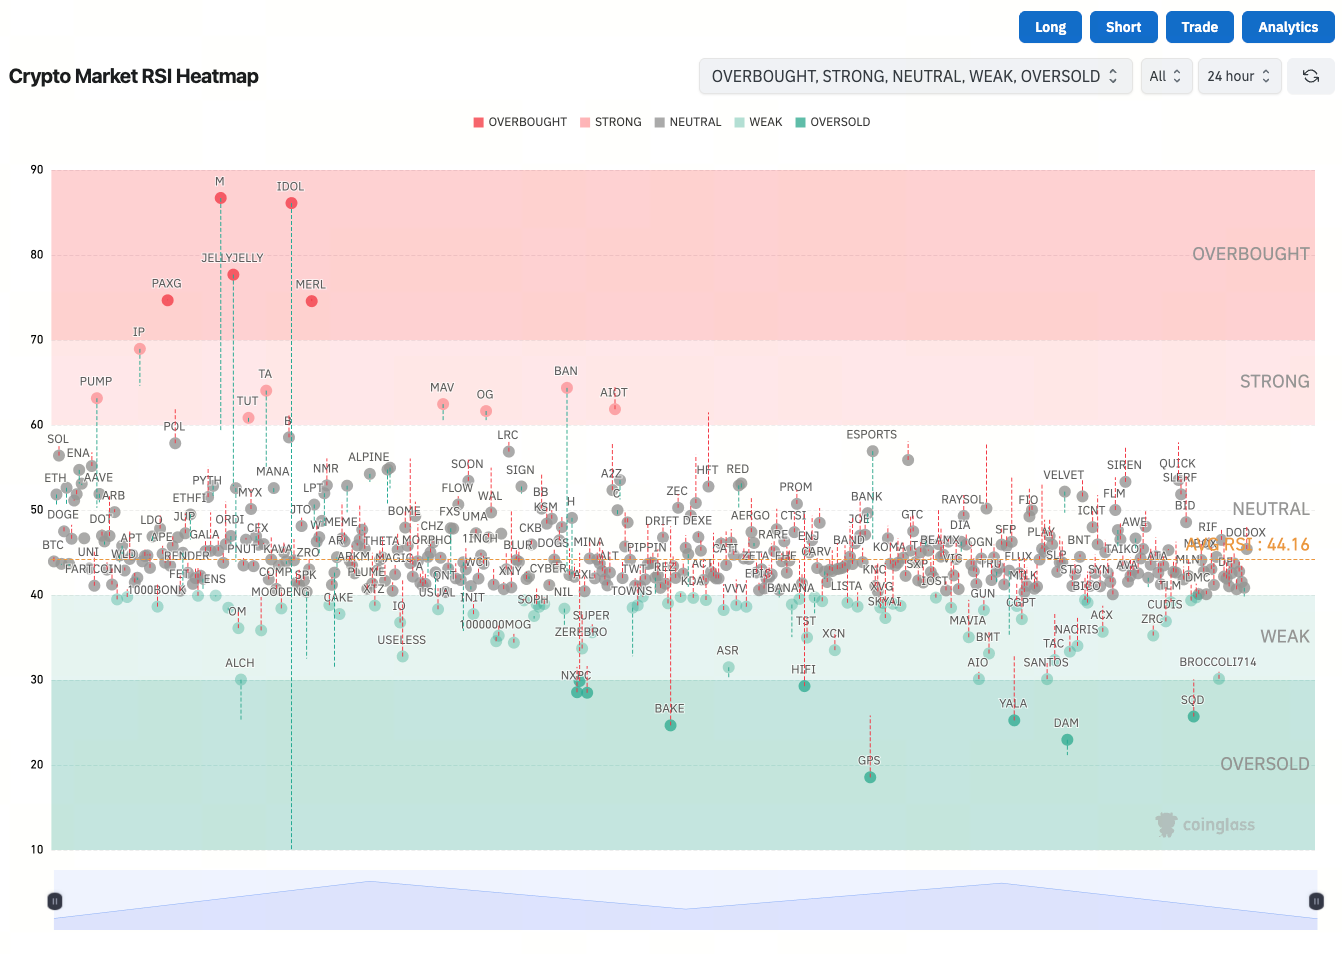

(Source: coinglass)

With this broad, real-time perspective, investors can manage portfolios more efficiently and reduce emotion-driven decisions.

Key Advantages of the RSI Heatmap

  1. Highly intuitive: Colors are easier to interpret than raw numbers, making the heatmap ideal for short-term traders.
  2. Broad coverage: Enables simultaneous tracking of dozens of coins to gauge overall market sentiment.
  3. Sentiment signals: Helps determine if the market is in a panic or greed phase.
  4. Strategic support: Combines well with other technical indicators (e.g., MACD, Bollinger Bands) for sharper decision-making.

Limitations and Risks of the RSI Heatmap

While the RSI Heatmap offers a user-friendly overview, investors should remain aware of its limitations:

  • Signals may be too simplistic: Colors are visually clear but do not capture every technical nuance.
  • Potential for misleading signals: Solely relying on RSI can lead to oversight of fundamental or news-driven factors.
  • Sensitive to short-term volatility: Crypto markets are often influenced by sudden events, which can instantly distort RSI readings.

As a result, the RSI Heatmap should be used as a supplementary tool—not as the sole basis for investment decisions.

For more in-depth Web3 content, click to register: https://www.gate.com/

Summary

The RSI Heatmap is a powerful market sentiment analysis tool, particularly well-suited for volatile environments like cryptocurrency. By leveraging its intuitive color-coding, investors can rapidly gauge whether assets are overheated or oversold, supporting more rational investment decisions. However, the RSI Heatmap is not a standalone solution—it works best as part of a holistic strategy that includes fundamental analysis, macroeconomic trends, and additional technical indicators. As the digital asset market continues to mature into 2025, tools like the Crypto Market RSI Heatmap will be indispensable for investors, providing reliable guidance in a rapidly changing landscape.

Author: Allen
Disclaimer
* The information is not intended to be and does not constitute financial advice or any other recommendation of any sort offered or endorsed by Gate.
* This article may not be reproduced, transmitted or copied without referencing Gate. Contravention is an infringement of Copyright Act and may be subject to legal action.

Share

Crypto Calendar
Tokenların Kilidini Aç
Wormhole, 3 Nisan'da 1.280.000.000 W token açacak ve bu, mevcut dolaşımdaki arzın yaklaşık %28,39'unu oluşturacak.
W
-7.32%
2026-04-02
Tokenların Kilidini Aç
Pyth Network, 19 May'da 2.130.000.000 PYTH tokenini serbest bırakacak ve bu, mevcut dolaşım arzının yaklaşık %36,96'sını oluşturacak.
PYTH
2.25%
2026-05-18
Tokenların Kilidini Aç
Pump.fun, 12 Temmuz'da 82,500,000,000 PUMP token'ı kilidini açacak ve bu, mevcut dolaşımdaki arzın yaklaşık %23,31'ini oluşturacak.
PUMP
-3.37%
2026-07-11
Token Kilidi Açma
Succinct, 5 Ağustos'ta mevcut dolaşımdaki arzın yaklaşık %104,17'sini oluşturan 208,330,000 PROVE token'ını serbest bırakacak.
PROVE
2026-08-04
sign up guide logosign up guide logo
sign up guide content imgsign up guide content img
Sign Up

Related Articles

What is Fartcoin? All You Need to Know About FARTCOIN
Intermediate

What is Fartcoin? All You Need to Know About FARTCOIN

Fartcoin (FARTCOIN) is a representative meme coin within the Solana ecosystem based on an AI-driven narrative. Its core concept originated from an experiment aimed at exploring the "boundaries between AI Agents and humor." More than just a digital asset with social attributes, the project deeply couples absurd humor culture with on-chain financial logic by integrating autonomous AI interaction models.
2026-03-04 05:38:51
Gold Price Forecast for the Next Five Years: 2026–2030 Trend Outlook and Investment Implications, Could It Reach $6,000?
Beginner

Gold Price Forecast for the Next Five Years: 2026–2030 Trend Outlook and Investment Implications, Could It Reach $6,000?

Analyze current gold price trends alongside authoritative five-year forecasts, integrating an evaluation of market risks and opportunities. This gives investors insight into the potential trajectory of gold prices and the main drivers expected to shape the market over the next five years.
2026-01-26 03:33:33
2026 Silver Price Forecast: Bull Market Continuation or High-Level Pullback? In-Depth Analysis of Silver Candlestick Chart
Beginner

2026 Silver Price Forecast: Bull Market Continuation or High-Level Pullback? In-Depth Analysis of Silver Candlestick Chart

2026 Silver Price Forecast: Latest Outlook This article integrates current market trends, silver candlestick chart analysis, and momentum factors to assess the potential key support and resistance levels, upside targets, and pullback risks for silver prices. The goal is to help investors make informed, rational decisions.
2026-01-28 08:36:39
Crypto Future Profit Calculator: How to Calculate Your Potential Gains
Beginner

Crypto Future Profit Calculator: How to Calculate Your Potential Gains

Crypto Future Profit Calculator helps traders estimate potential earnings from futures contracts by considering entry price, leverage, fees, and market movement.
2025-02-09 17:28:28
Crypto Futures Calculator: Easily Estimate Your Profits & Risks
Beginner

Crypto Futures Calculator: Easily Estimate Your Profits & Risks

Use a crypto futures calculator to estimate profits, risks, and liquidation prices. Optimize your trading strategy with accurate calculations.
2025-02-11 02:25:44
What is Oasis Network (ROSE)?
Beginner

What is Oasis Network (ROSE)?

The Oasis Network is driving the development of Web3 and AI through smart privacy technology. With its privacy protection, high scalability, and cross-chain interoperability, the Oasis Network is providing new possibilities for the future development of decentralized applications.
2025-05-20 09:41:15