Although Bitcoin (BTC) is currently trading 42% below its all-time high of $126,000, some technical signals suggest that the price range from $60,000 to $72,000 could become an important support level, marking a new bottom before the market enters a sustainable recovery phase.
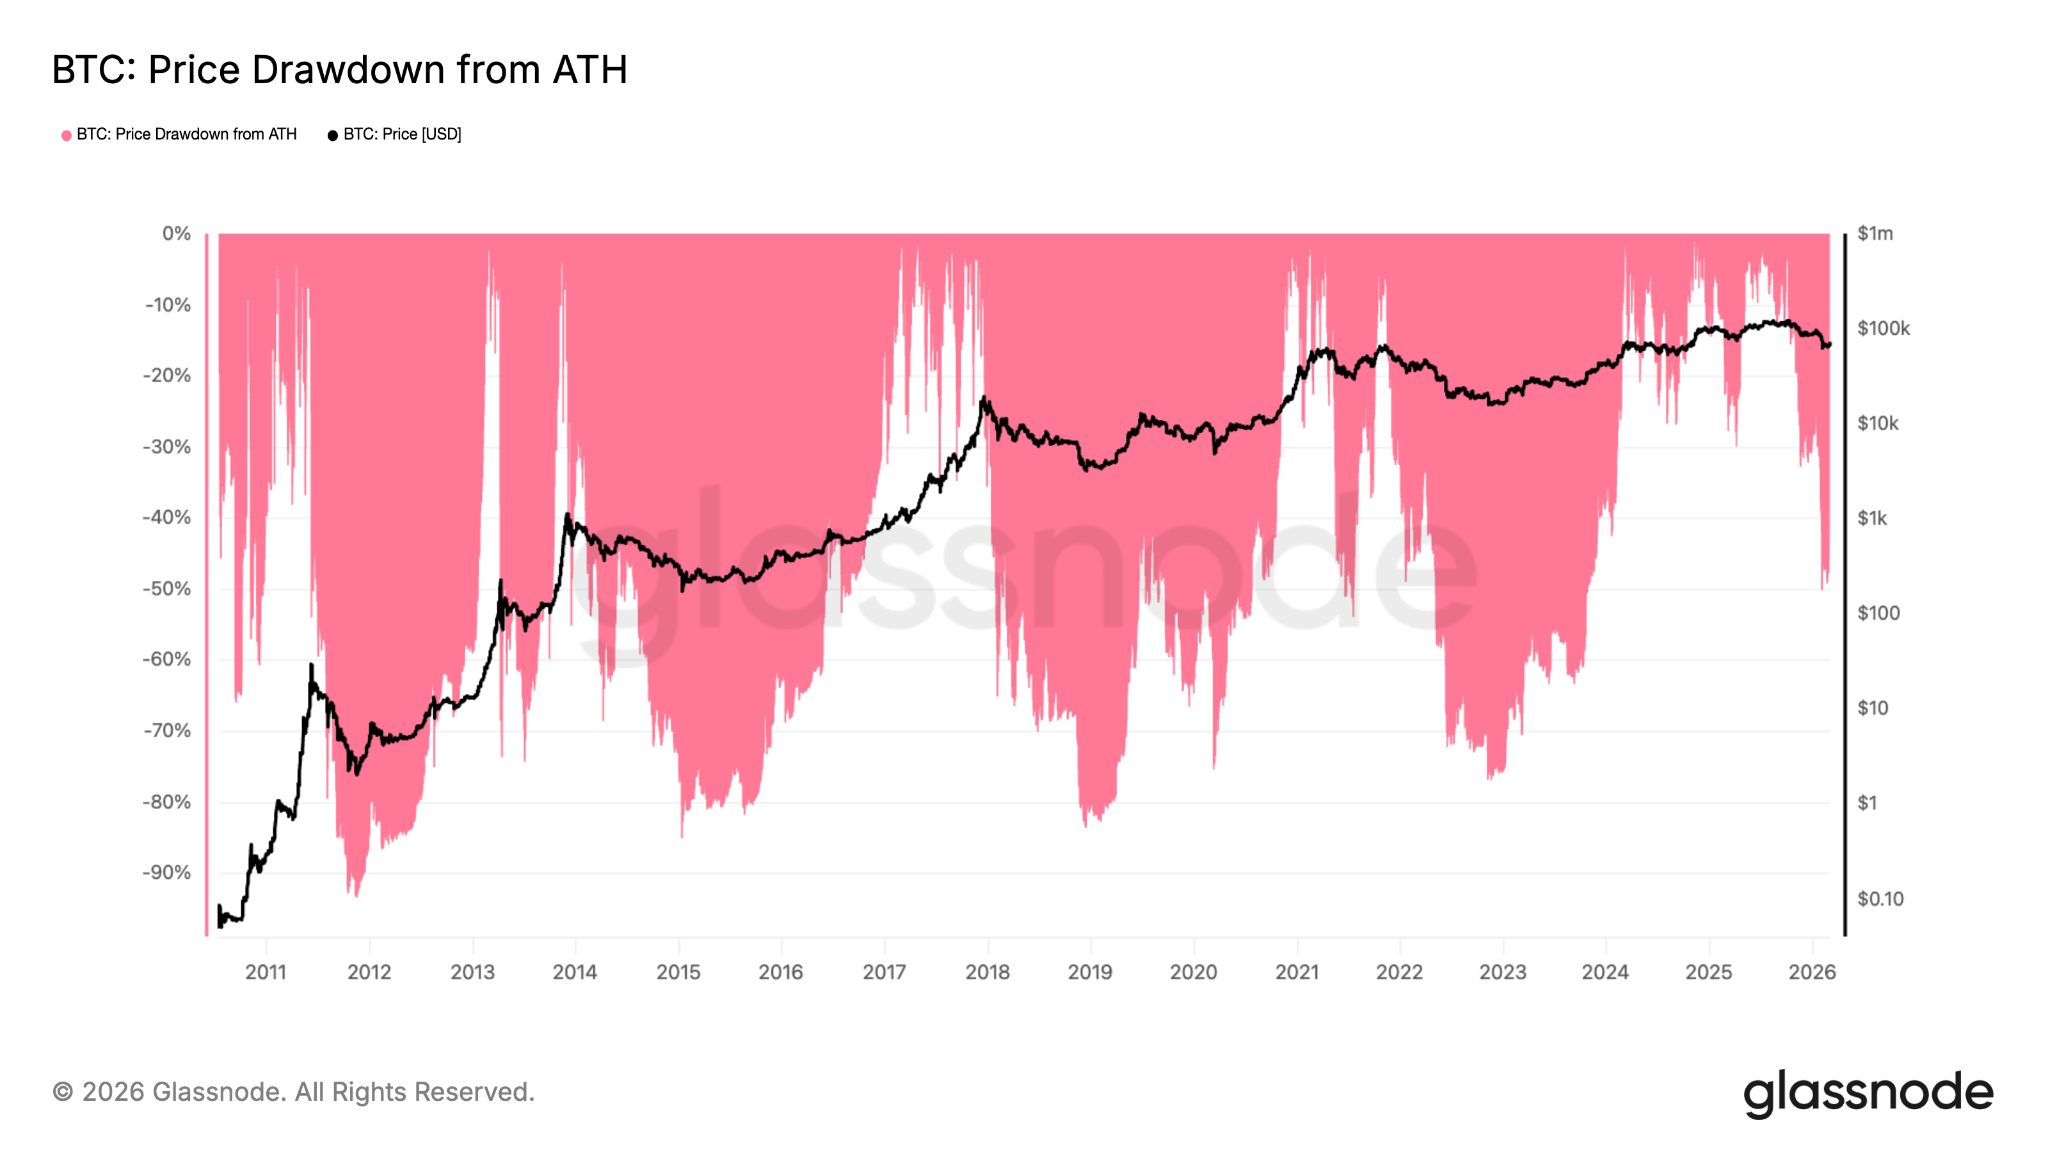 BTC price drops sharply from all-time high | Source: Glassnode## The “double bottom” pattern of Bitcoin signals a potential trend reversal
After hitting a multi-year low of $60,000 on February 6, Bitcoin rebounded strongly by 21%, reaching a 30-day high of $74,000 before correcting to $72,500 on Thursday.
Cryptocurrency analyst Jelle noted that the “Adam and Eve” bottom pattern is still forming on Bitcoin’s 12-hour chart.
The “Adam and Eve” bottom is a bullish reversal pattern indicating a shift from a downtrend to an uptrend. It is a variation of the classic “double bottom” pattern, often appearing after a sharp decline and showing that selling pressure is gradually weakening.
This pattern is confirmed when the price breaks and closes above the neckline— the peak between the two bottoms— at $70,000 on Wednesday, as illustrated in the chart below.
Jelle also emphasized: “Buyers need to hold this breakout area; otherwise, we could see a negative correction before the price continues to decline further.”
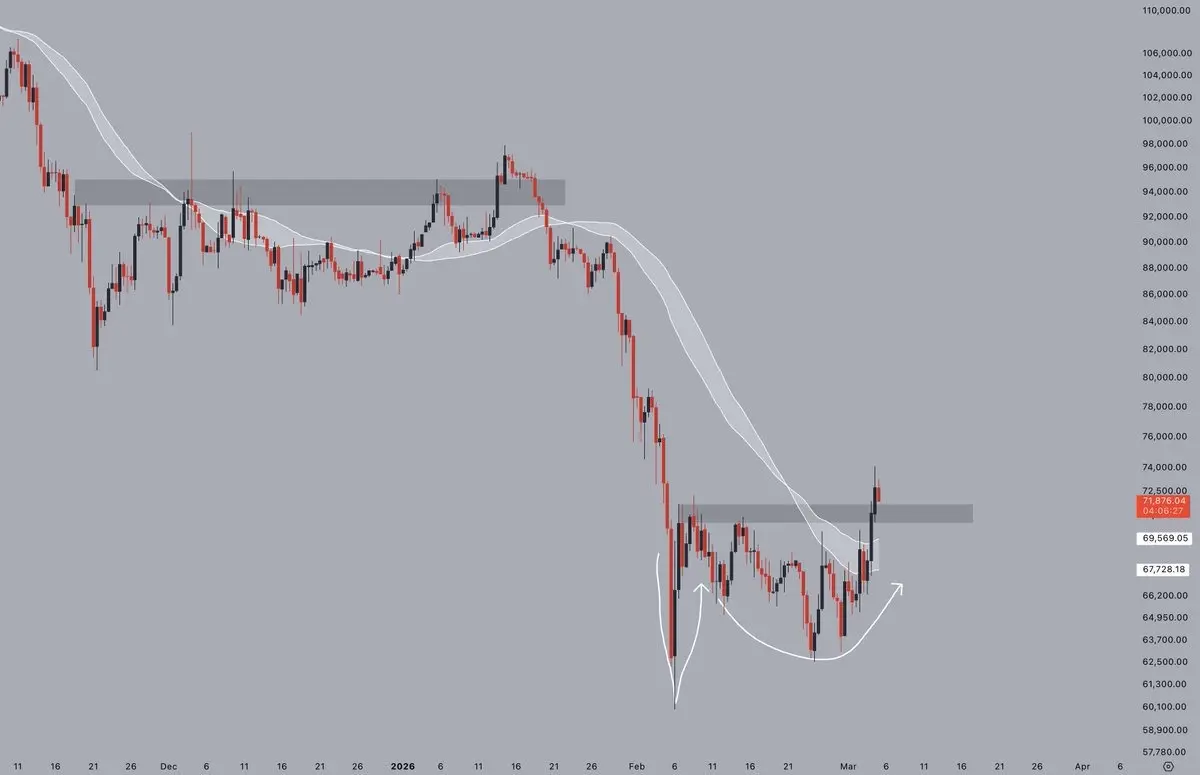 BTC/USD 12-hour chart | Source: JellePreviously, Coinphoton reported that slowing profit-taking is a necessary condition for Bitcoin to sustain the $70,000 level and confirm a recovery trend.
Bitcoin-Gold ratio signals a bottom
As of March, the Bitcoin-to-gold price ratio has maintained a downward trend for 13 months since peaking in December 2024.
The decline of Bitcoin relative to gold often reflects investors’ risk-avoidance sentiment, as they reduce exposure to digital assets. This typically occurs amid macroeconomic instability, geopolitical tensions, or liquidity crises, making gold a safer haven.
Nic, CEO of Coinbureau, commented on X: “In the previous three cycles, it took about 14 months for the market to go from peak to bottom,” emphasizing that:
“These cycles also coincide with market bottoms during bear phases.”
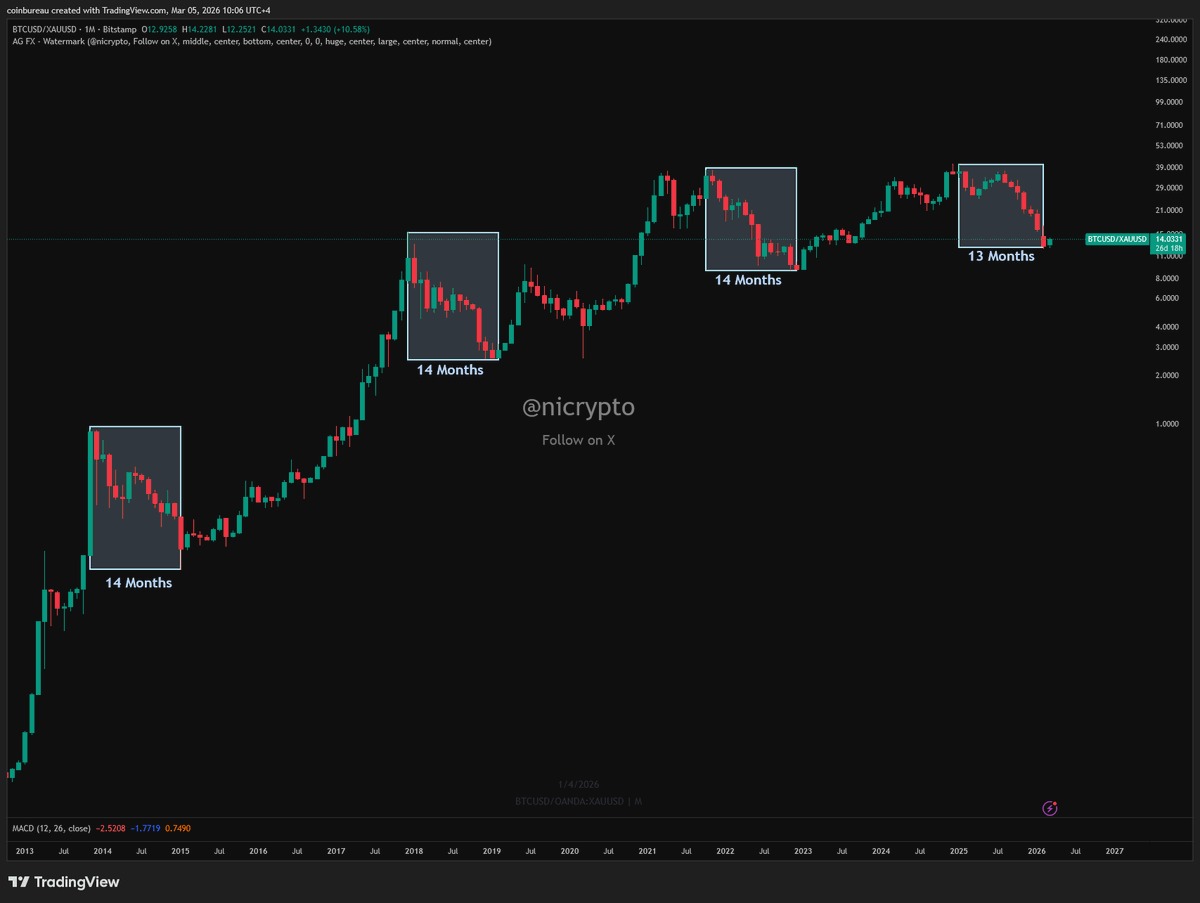 Bitcoin-Gold ratio comparison chart | Source: Nic PuckrinWhen the BTC/gold ratio bottomed out at the end of 2022, Bitcoin’s price also fell to a macro low of $15,500 before rallying 352% to reach an all-time high of $73,800 in March 2024.
A similar scenario played out in 2018 and 2014, when Bitcoin’s price increased by 300% to 450% within a year after the BTC/XAU pair hit bottom.
Therefore, the 13-month down cycle since the recent peak suggests that a new bottom may be approaching.
Bitcoin’s upward price channel hints at a cycle bottom
Data from TradingView shows that Bitcoin’s price is testing a long-term support trendline on the monthly timeframe.
The chart below indicates that this trendline has historically marked Bitcoin’s bear market bottoms in 2018 and 2022.
“Currently, Bitcoin is approaching its historical bottom at this trendline,” said a trader and analyst from Coinvo Trading in a video posted on X. He also added:
“If history repeats itself, Bitcoin will test this trendline again and could then reach a peak of $500,000.”
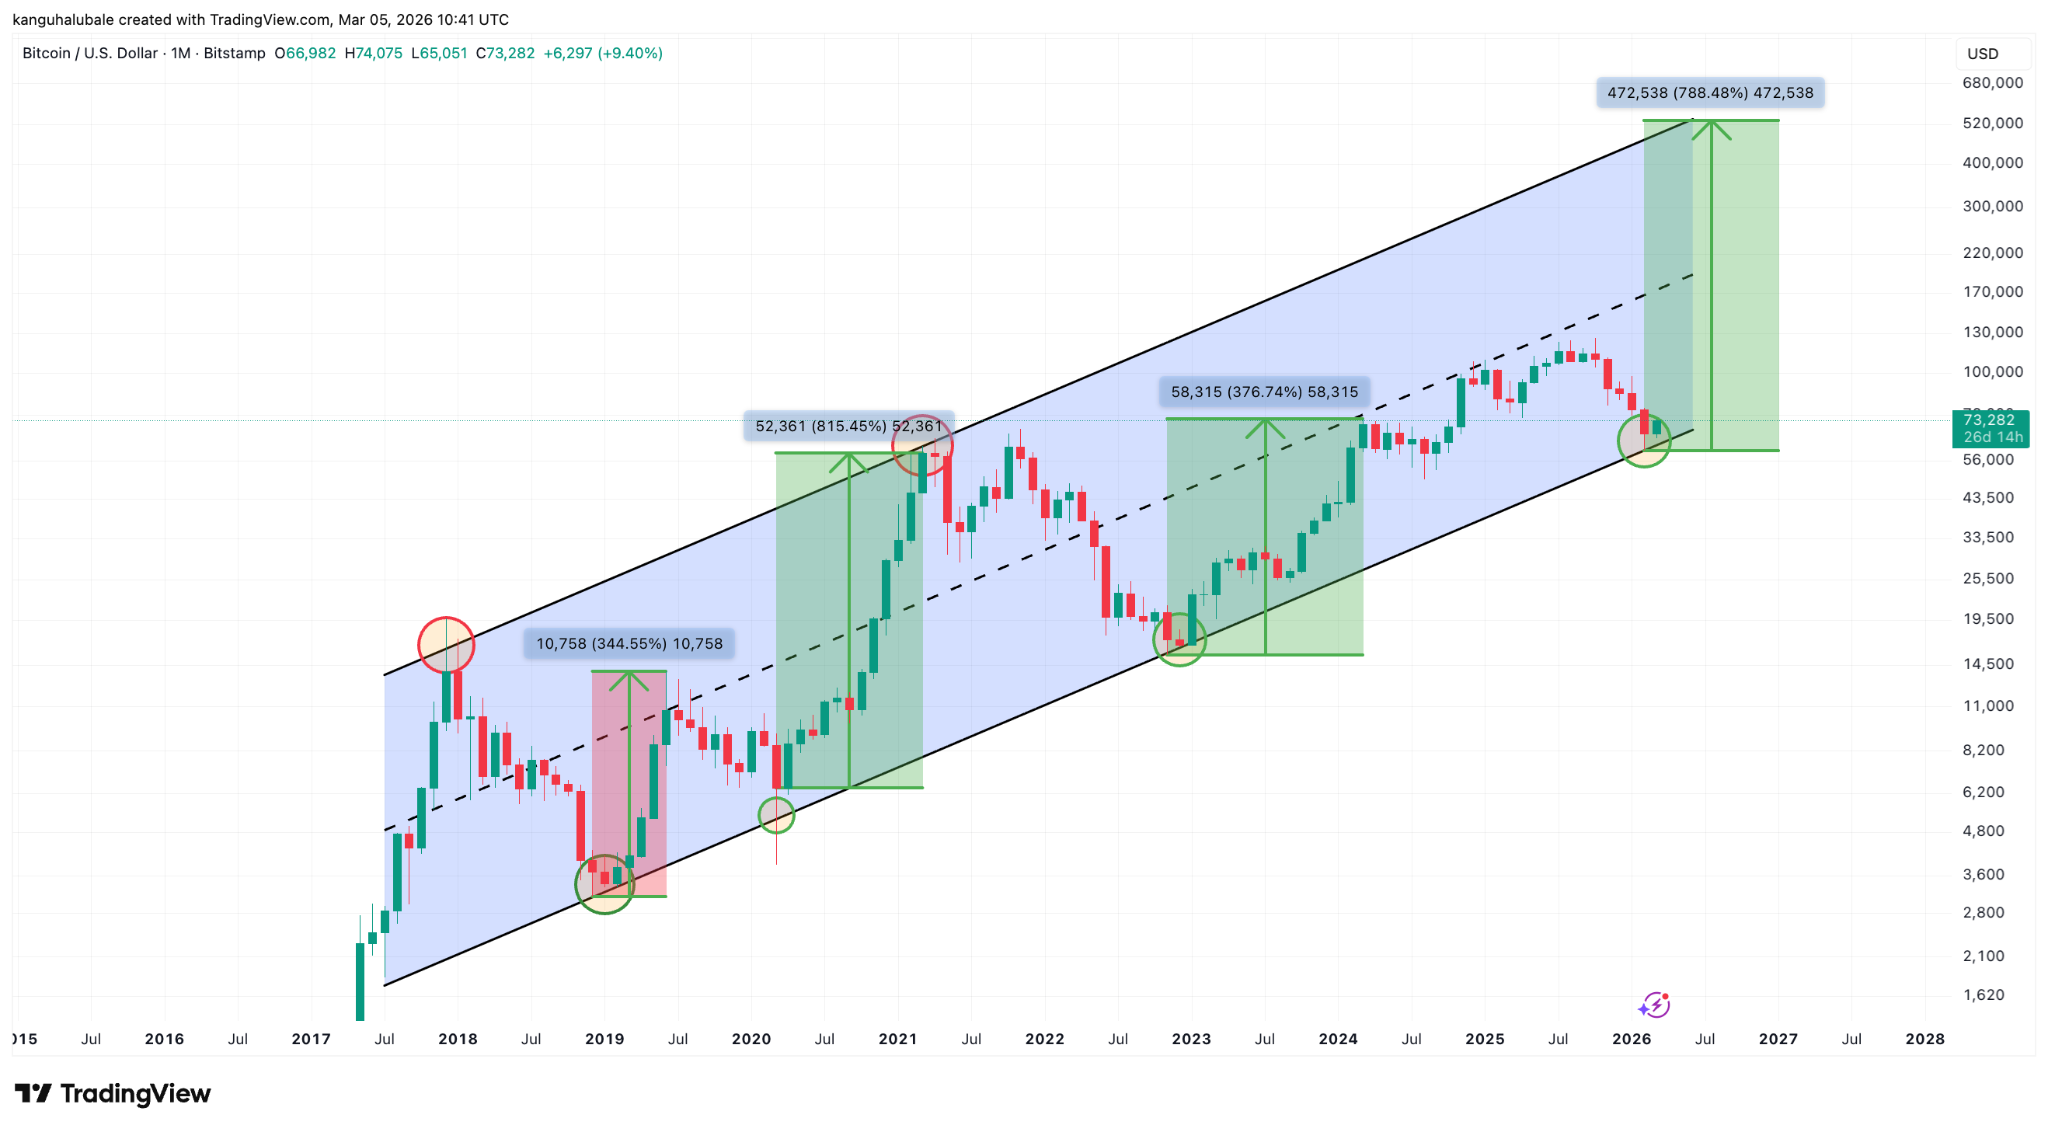 BTC/USD monthly chart | Source: Cointelegraph/TradingViewAnother analyst, Rekt Fencer, also stated that he “believes Bitcoin’s bottom has been established” after identifying a similar pattern on the weekly timeframe, where the price is testing the trendline that marked the bottom in 2022.
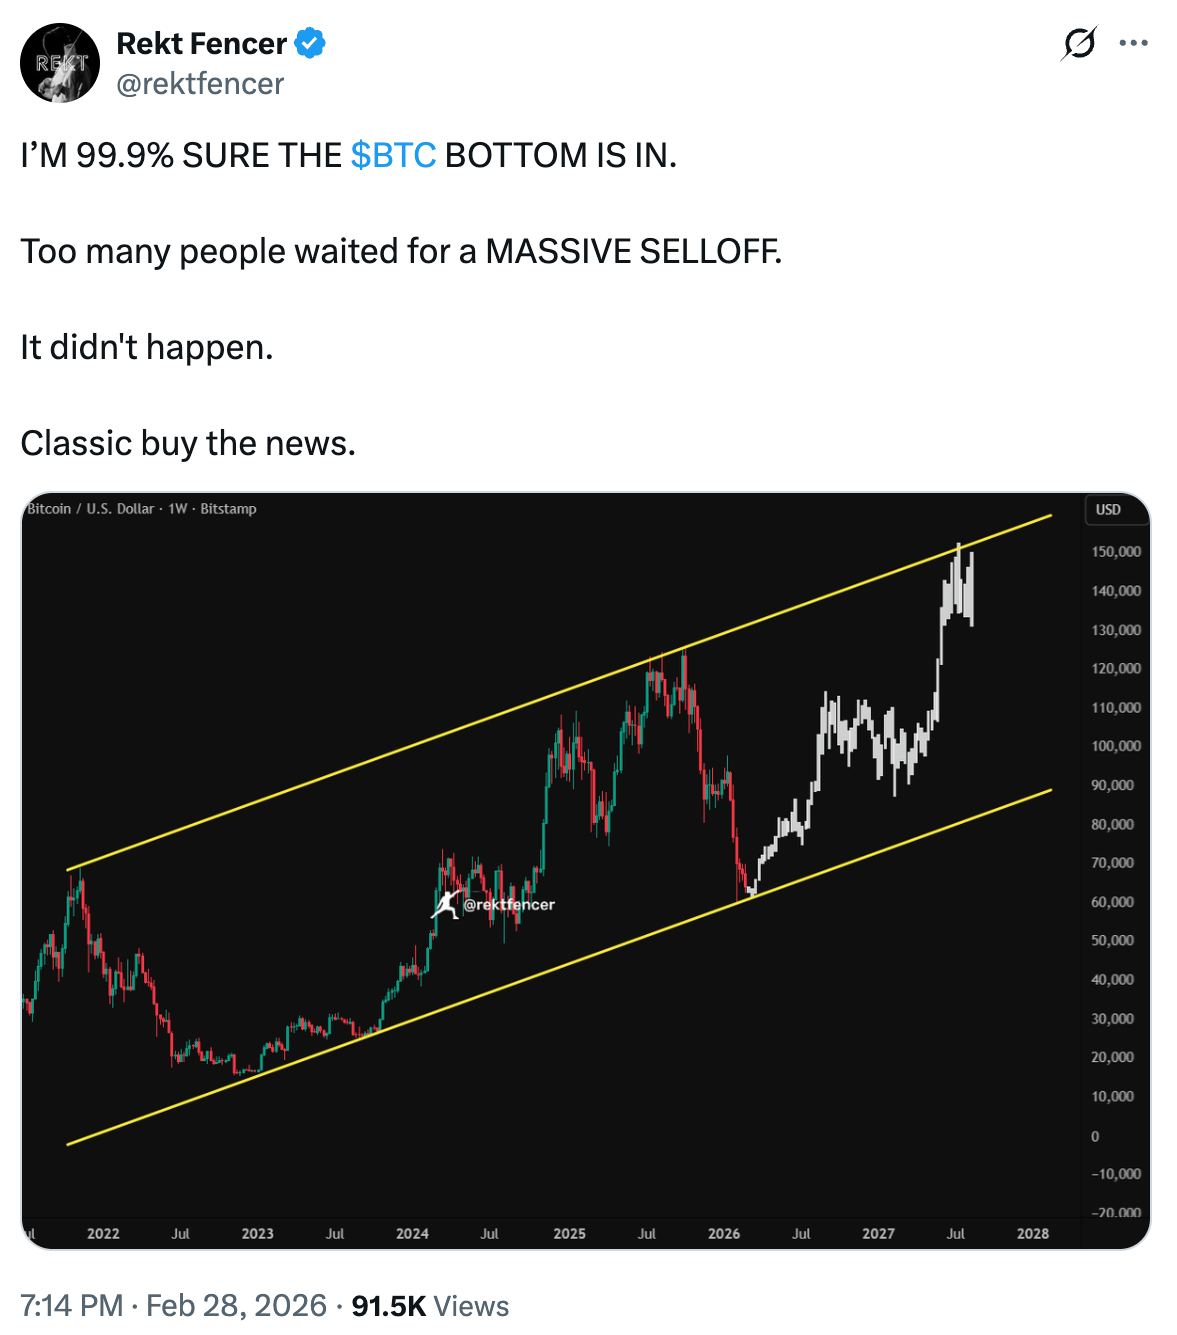 BTC/USD weekly chart | Source: Rekt FencerAs Coinphoton reported, many technical indicators currently suggest that Bitcoin may be close to bottoming out, including the Relative Strength Index (RSI).
Disclaimer: The information on this page may come from third parties and does not represent the views or opinions of Gate. The content displayed on this page is for reference only and does not constitute any financial, investment, or legal advice. Gate does not guarantee the accuracy or completeness of the information and shall not be liable for any losses arising from the use of this information. Virtual asset investments carry high risks and are subject to significant price volatility. You may lose all of your invested principal. Please fully understand the relevant risks and make prudent decisions based on your own financial situation and risk tolerance. For details, please refer to
Disclaimer.