Zcash was unable to maintain its upward momentum after being rejected at the $251 level, quickly losing the important support zone at $238 shortly afterward. Since then, the altcoin has continuously weakened, closing lower in three consecutive sessions, even dropping as deep as $205 at one point.
At the time of writing, Zcash (ZEC) is trading around $207, down 8.29% in the past 24 hours. The prolonged decline has caused ZEC to fall below both its short-term and long-term moving averages, signaling that selling pressure is clearly dominant and the bearish trend is still prevailing in the market.
Buying liquidity weakens as selling pressure increases
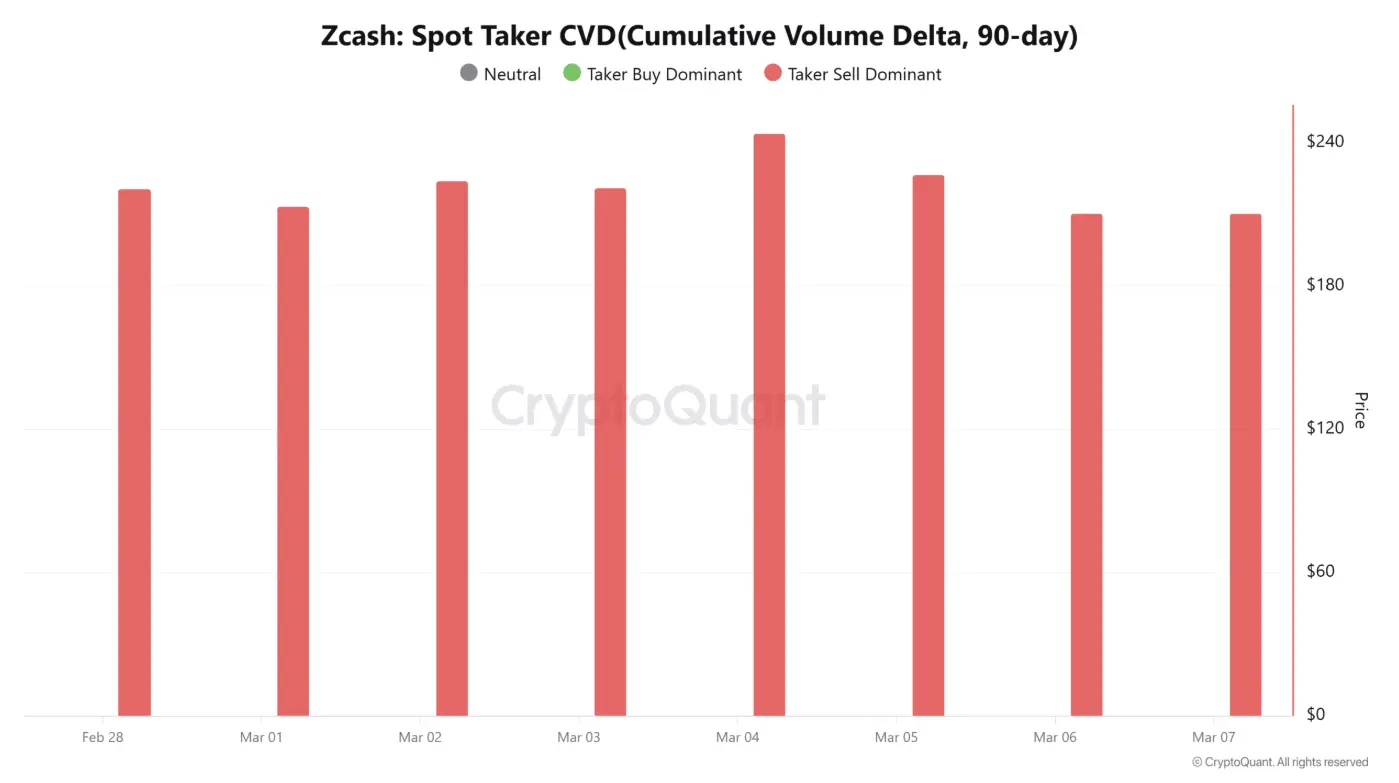
After a prolonged decline across the market, Zcash holder sentiment has started to weaken significantly. Many investors are choosing to close positions to limit risk, while speculators are temporarily on the sidelines observing. Market data also reflects this trend, with trading volume increasing notably, as shown by the Spot Taker CVD indicator.
Selling pressure especially intensified when this altcoin dropped below the $250 mark. Many short-term investors were forced to capitulate and exit their positions, adding further downward pressure and causing the price to weaken even more.
In the past two days, the decline has become more pronounced as the bears repeatedly defended strongly around the $210 level. Every attempt at recovery was quickly halted, causing the market to lose its upward momentum and pushing the price down more sharply.
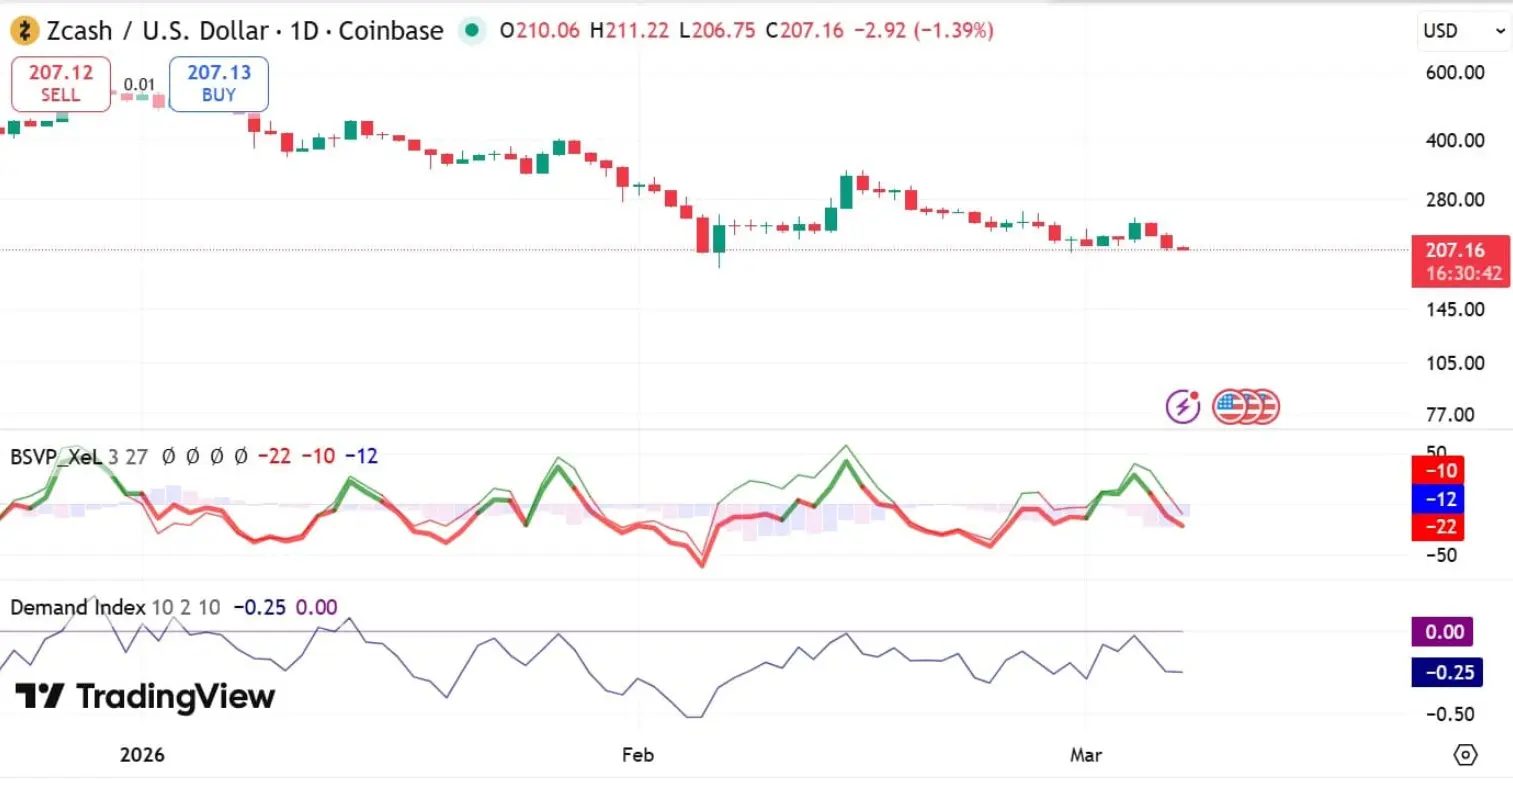
 Source: CryptoQuant Meanwhile, the Buy Sell Volume to Price Pressure index remains negative for two consecutive sessions. Currently, VPO1 is around -22, and VPO2 is approximately -10. These negative values indicate that price pressure from both sides is negative, and even net buying flows are not enough to reverse the trend. In other words, selling still clearly dominates buying.
 Source: Tradingview Additionally, the Demand Index has fallen deep into negative territory, currently oscillating around -25. This reflects weakening market demand relative to supply. As this index continues to decline in the negative zone, it further supports the scenario that the market is losing strength.
According to market principles, when demand weakens while supply increases, the downward momentum tends to accelerate, pushing prices to lower levels. The current momentum indicators for this altcoin also clearly reflect this negative outlook.
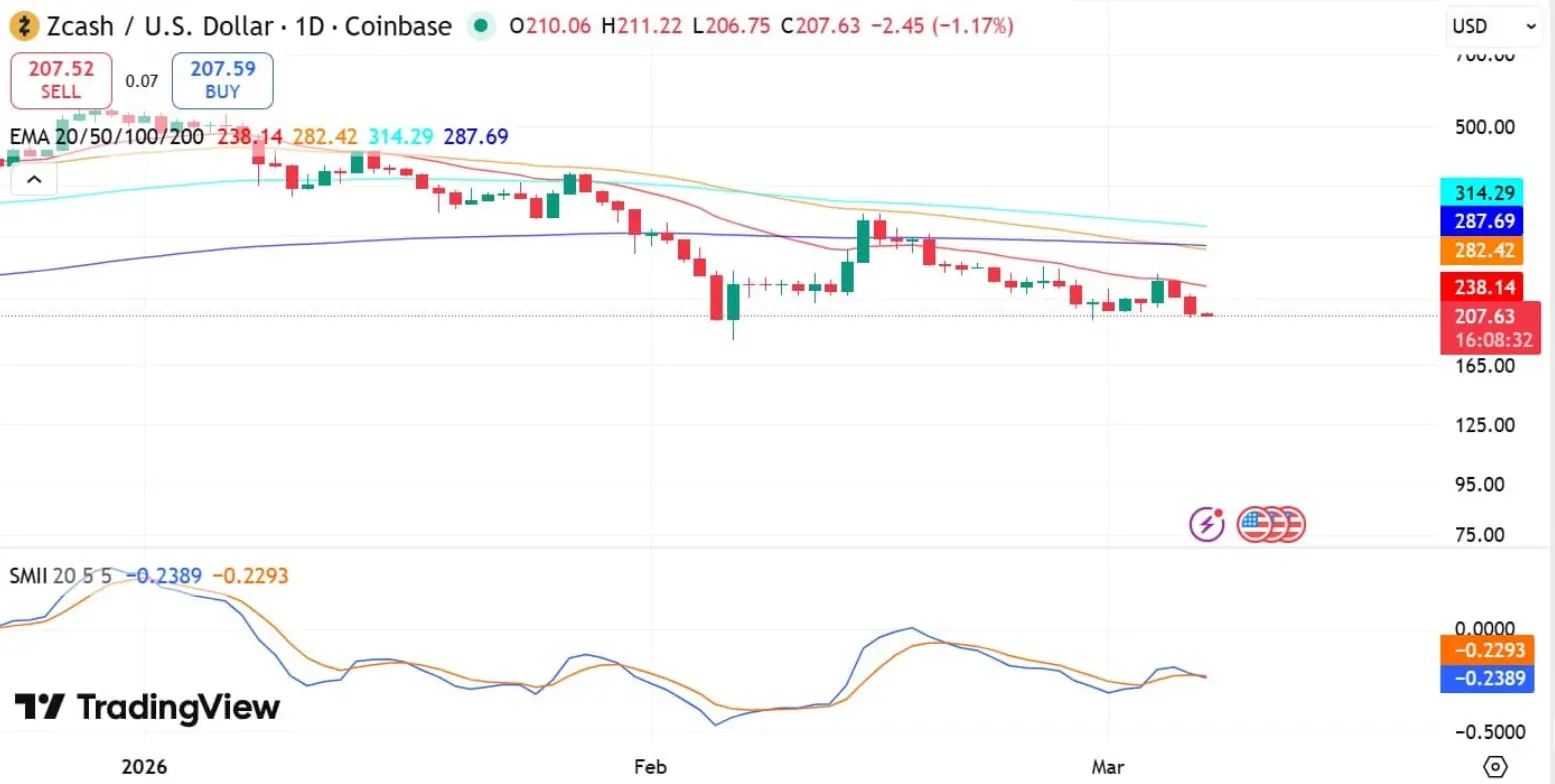 Source: Tradingview Specifically, the Stochastic Ergodic Indicator (SMII) has formed a bearish crossover and slid down to -0.23. When this indicator enters negative territory, it often signals increased downside risk and suggests that the bears are gaining control of the market.
Historically, similar technical conditions have appeared before deeper declines, indicating that prices are likely to continue under pressure in the near future.
Retail investors try to absorb the pressure
Despite the market showing clear signs of weakening, some retail investors on exchanges are taking advantage of the dip to accumulate assets at attractive discounted prices.
Data from CoinGlass shows that over the past three days, more than $48.3 million has been withdrawn from exchanges, while deposits only amounted to $43.9 million. Notably, this net outflow occurred precisely as ZEC’s price plunged sharply, indicating that “bottom-fishing” activity is gradually increasing in the market.
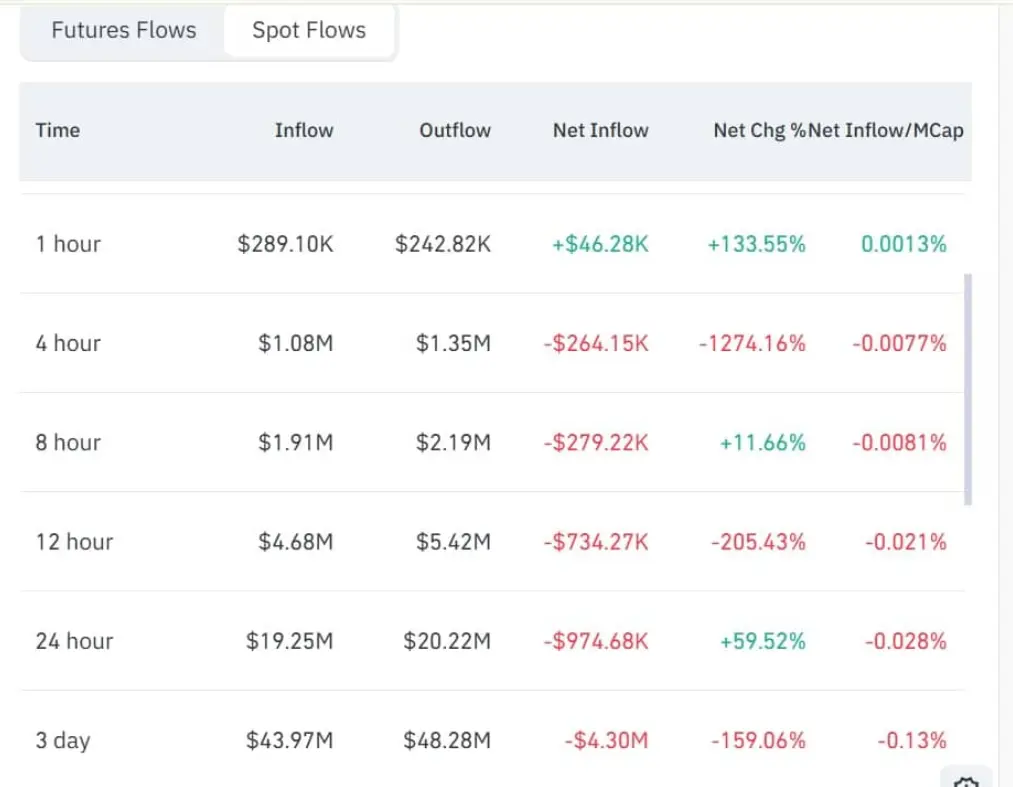 Source: Coinglass This accumulation wave could become an important support factor, helping ZEC limit further deep declines. In many cases, increased buying pressure absorbs selling activity, opening the possibility for a rebound.
If demand continues to rise and is clearly reflected through market flows, ZEC could potentially reverse its trend and aim to regain the short-term resistance zone around $238.
Conversely, if the bears maintain their dominance as they currently do, Zcash could lose the $200 support level, pushing the price further down toward the $185 zone.
SN_Nour
Disclaimer: The information on this page may come from third parties and does not represent the views or opinions of Gate. The content displayed on this page is for reference only and does not constitute any financial, investment, or legal advice. Gate does not guarantee the accuracy or completeness of the information and shall not be liable for any losses arising from the use of this information. Virtual asset investments carry high risks and are subject to significant price volatility. You may lose all of your invested principal. Please fully understand the relevant risks and make prudent decisions based on your own financial situation and risk tolerance. For details, please refer to
Disclaimer.