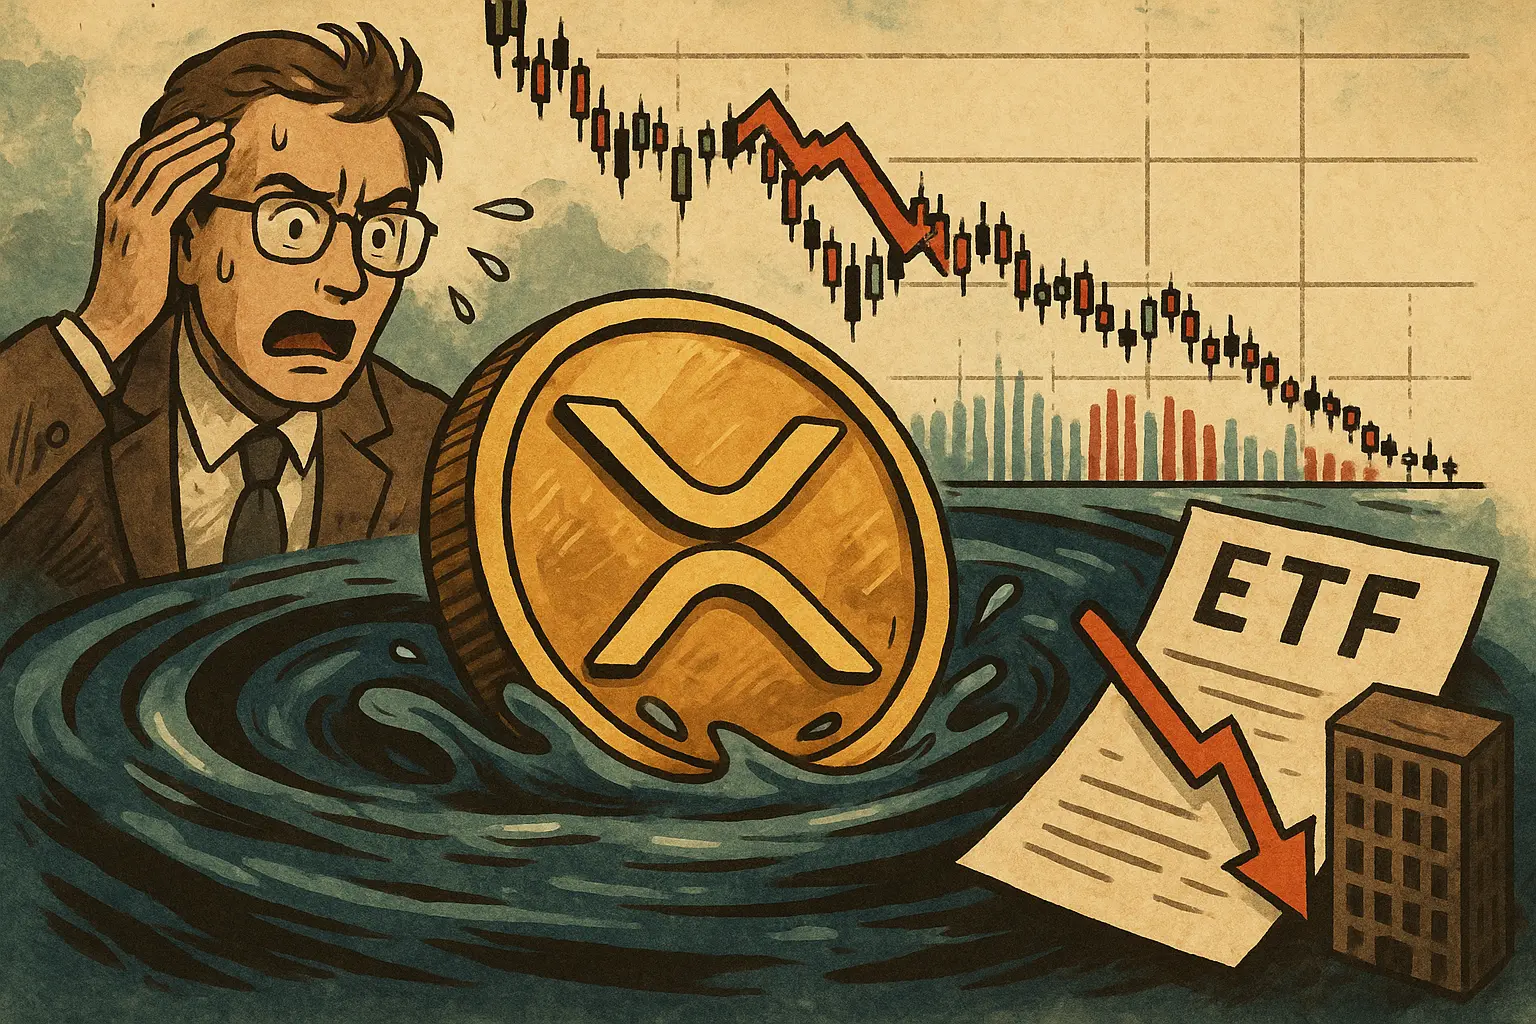
XRP is oscillating under multiple pressures, reporting $1.35 on March 9, after briefly hitting a low of $1.347 during a surge in trading volume. On-chain analyst ChartNerd predicts XRP could drop to $1 before triggering a liquidity crisis. SoSoValue data shows XRP ETF experienced its first weekly net outflow since January 30 last week, totaling just over $4 million.
ChartNerd’s “Liquidity Hunt” Scenario: Rise to $1.80 Then Drop to $1
(Source: Trading View)
Analyst ChartNerd’s prediction on X has become this week’s most discussed bearish outlook. He points out that there is significant liquidity buildup between $1 and $1.20, with another concentration around $1.80. Based on this, ChartNerd sketches out the most likely price path for March: an initial rebound to $1.80 to trigger long stops, followed by a sharp decline to the $1 range to trigger short stops, completing a “Liquidity Hunt” — where the market first breaks upward or downward, triggering existing stops, then quickly reverses.
It’s important to note that “dropping to $1” isn’t seen as the final direction by ChartNerd, but rather a stepping stone in this liquidity-cleansing move. He believes such large swings are more a necessary market correction than a trend collapse.
XRP ETF Capital Flows: First Weekly Outflow in Weeks, Record Single-Day Outflow on March 6
(Source: SoSoValue)
The shift in XRP ETF capital flow is another key signal this week:
- Weekly Net Outflow: Total net outflow of just over $4 million, ending a streak of multiple weeks of net inflows.
- Single-Day Peak Outflow: On March 6, outflows reached $16.62 million, the largest single-day outflow since January 29.
- Intra-week Divergence: The first three trading days saw inflows, but outflows concentrated on March 5 and 6, indicating a clear shift in market sentiment in the latter half of the week.
- Cross-Asset Outflows: Bitcoin ETF outflows of $349 million, Ethereum ETF outflows of $83 million, and Solana ETF outflows of $8 million, showing institutional capital is retreating across the crypto ETF market this week.
Positive Signs: Whale Return and Garlinghouse’s Long-Term Outlook
Despite bearish forecasts and ETF outflows dampening market sentiment, two positive signals stand out. On-chain data shows XRP whale activity, measured by 30-day moving average flow rate, has turned positive for the first time in over three months, indicating large holders are re-accumulating, a traditional on-chain sign of bottoming.
At the XRP Australia 2026 Conference, Ripple CEO Garlinghouse directly addressed investors, saying current holders could be “very happy” five years from now. He emphasized that institutional adoption of tokenization, stablecoins, and blockchain-based settlement systems is accelerating. Evernorth CEO Ashish Bhira added that true financial infrastructure transformation typically takes nearly a decade, and short-term price volatility often doesn’t reflect the underlying technological progress.
FAQs
What is the core basis for ChartNerd’s prediction that XRP will drop to $1?
ChartNerd’s analysis relies on liquidity buildup theory: there are large clusters of stop-loss and buy orders between $1 and $1.20, and another around $1.80. The market needs to trigger these orders through a liquidity hunt (initial rise or fall) before establishing a solid bottom. His scenario involves an initial rise to $1.80 to trigger long stops, then a drop to $1 to trigger short stops, paving the way for the next trend.
Does the weekly outflow from XRP ETF indicate institutional withdrawal?
A single week’s outflow isn’t enough to confirm a trend of institutional withdrawal. Especially since Bitcoin, Ethereum, and Solana ETFs also experienced large outflows this week, it suggests a broader systemic adjustment in the crypto market rather than a specific loss of confidence in XRP. Coupled with the positive 30-DMA whale flow indicator, on-chain large holder behavior and ETF short-term flows show a divergence.
What does the positive 30-DMA whale flow indicate for XRP’s future?
A positive 30-day moving average of whale flow means large transfers have shifted from net outflows to inflows over the past month, indicating strategic accumulation by big holders. Historically, such a shift in whale activity during the bear market’s late stage often precedes improved retail sentiment and can serve as a bottom indicator in on-chain analysis, but it shouldn’t be used alone as a buy signal.
Disclaimer: The information on this page may come from third parties and does not represent the views or opinions of Gate. The content displayed on this page is for reference only and does not constitute any financial, investment, or legal advice. Gate does not guarantee the accuracy or completeness of the information and shall not be liable for any losses arising from the use of this information. Virtual asset investments carry high risks and are subject to significant price volatility. You may lose all of your invested principal. Please fully understand the relevant risks and make prudent decisions based on your own financial situation and risk tolerance. For details, please refer to
Disclaimer.