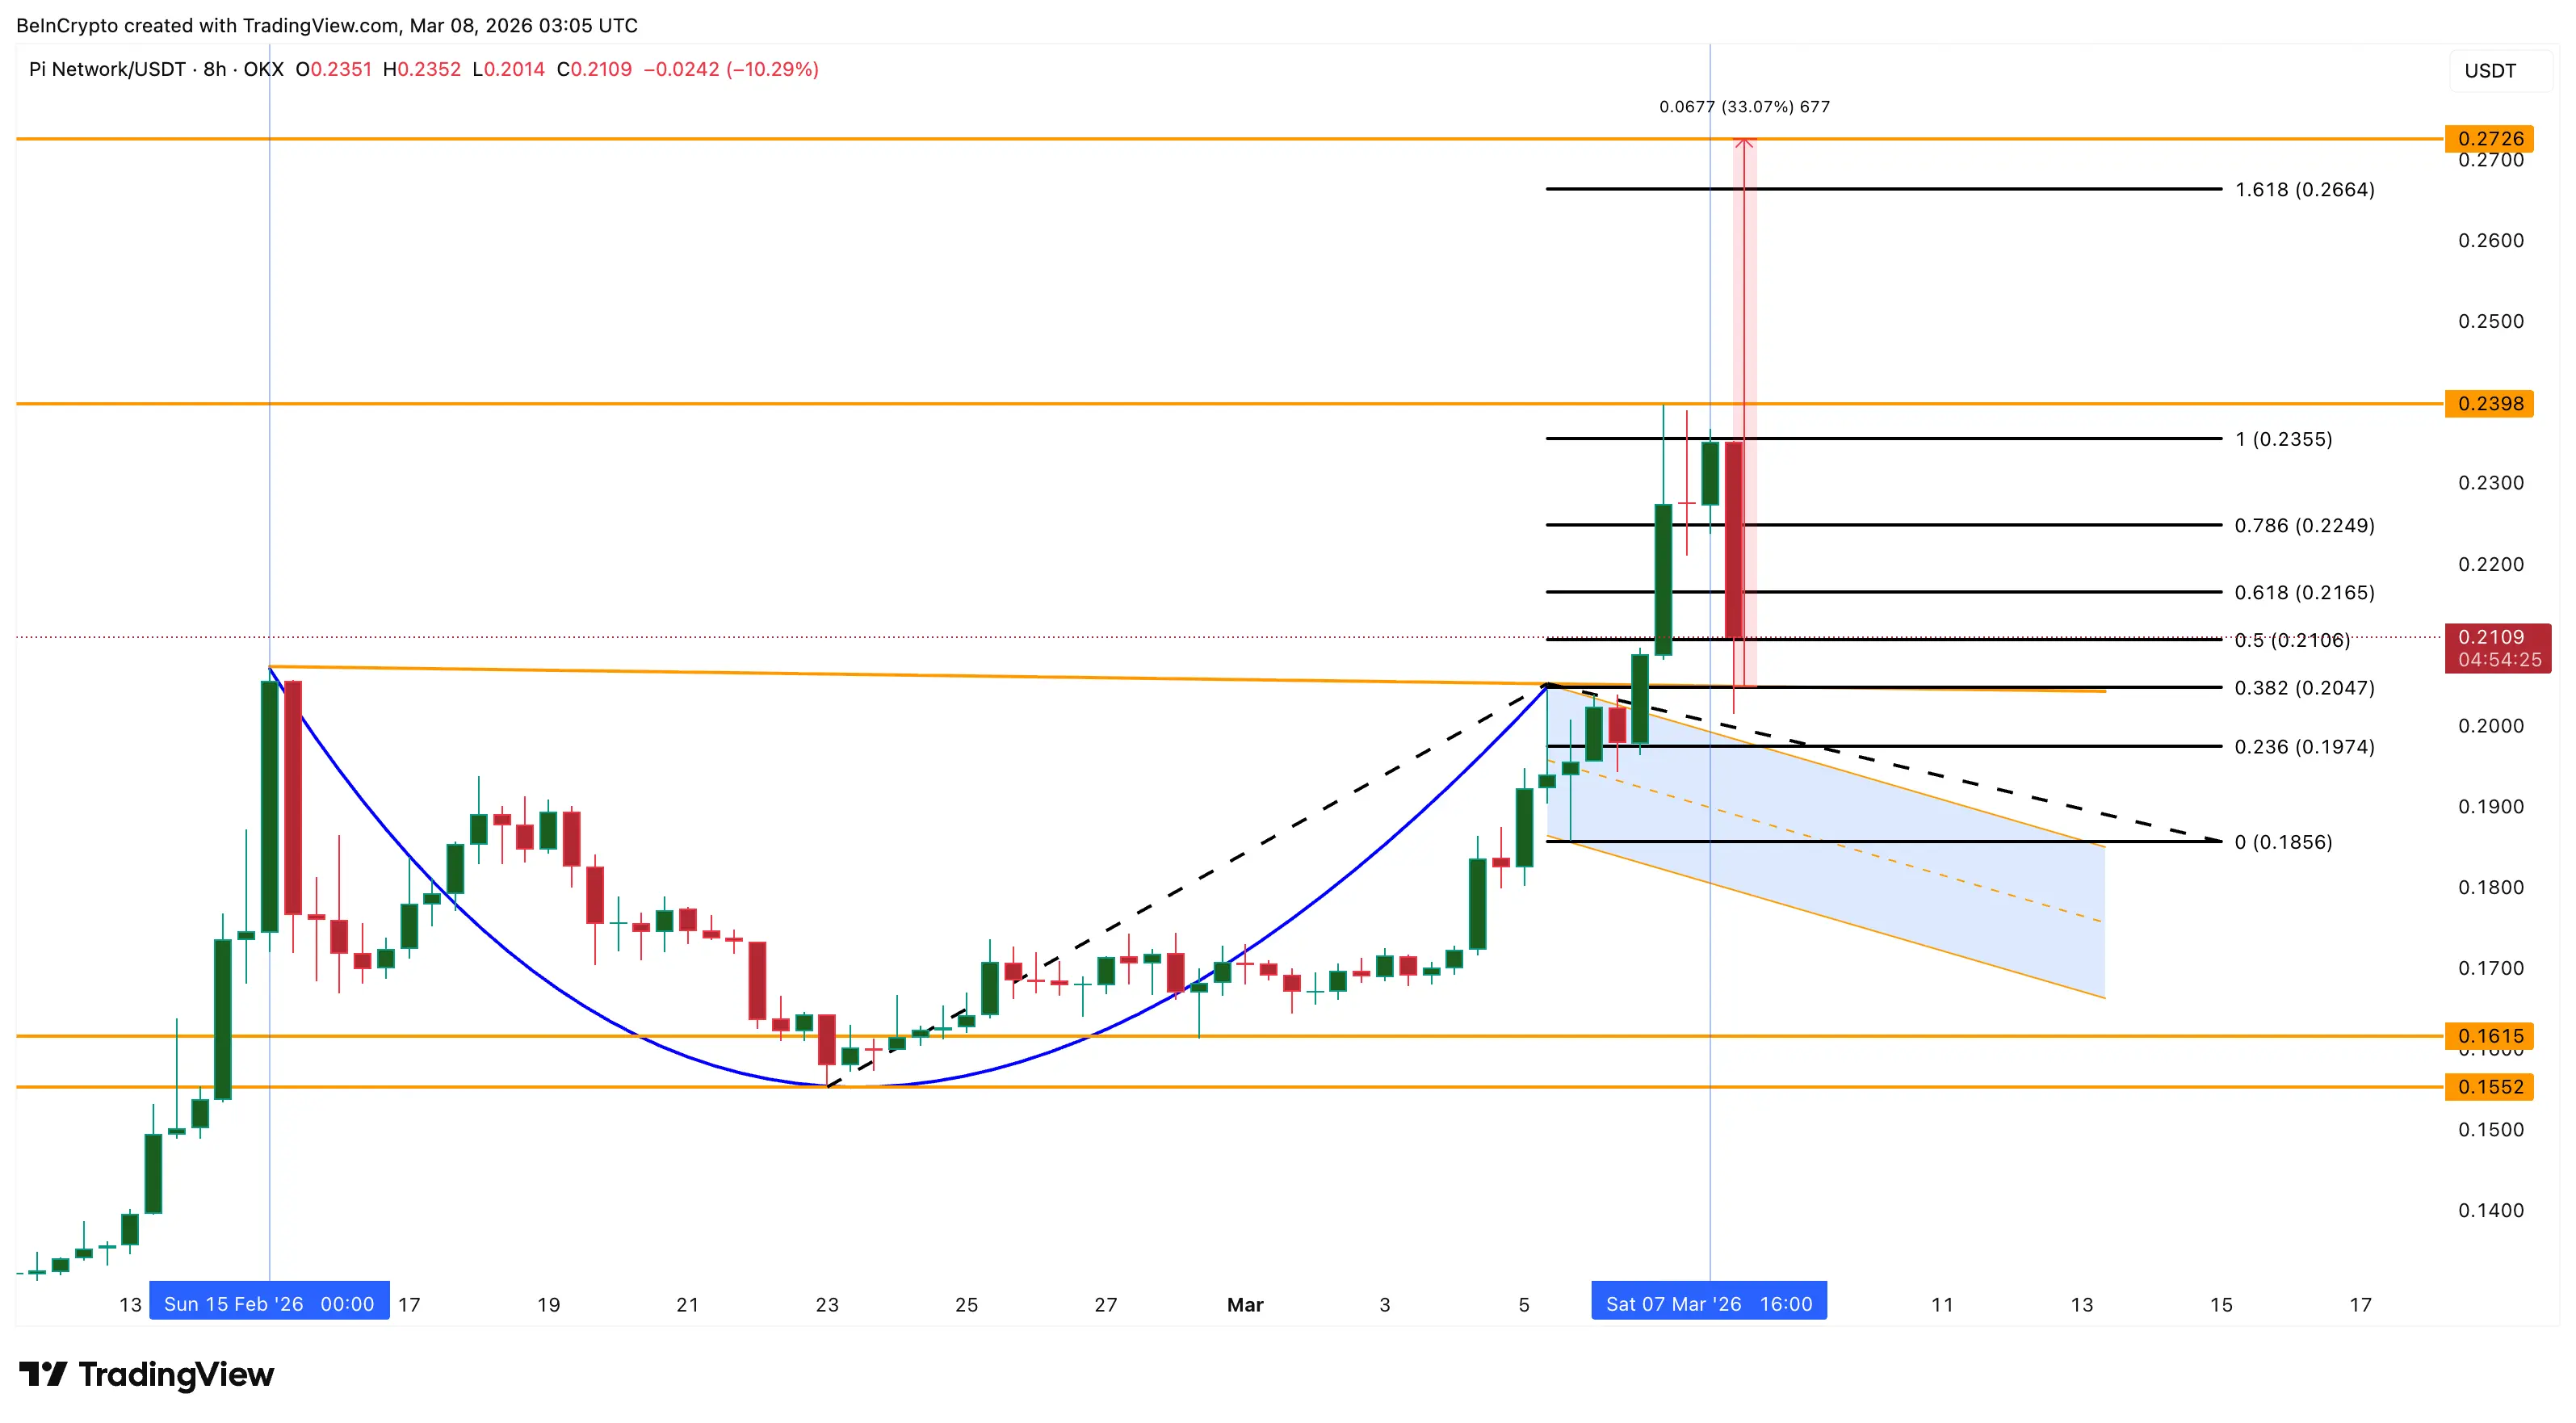
 Pi Coin confirmed a breakout above the $0.204 neckline of a cup-and-handle pattern but quickly encountered heavy resistance near $0.239, triggering a sharp 14 percent pullback to the $0.204 region.
Technical indicators, including the Relative Strength Index, Chaikin Money Flow, and Money Flow Index, all registered bearish divergence before the rejection, signaling weakening momentum and fading capital inflows as the rally progressed.
Breakout and Rejection Analysis
Cup-and-Handle Pattern Completion
Pi Coin successfully broke above the $0.204 neckline of a cup-and-handle pattern, a technical formation typically associated with trend continuation. The breakout initially suggested that the projected measured move toward $0.272 remained in play.
However, the rally stalled at $0.239, where sellers entered aggressively, pushing the price back toward the breakout region. At press time, Pi Coin trades near $0.209 as traders evaluate whether the broader bullish structure can withstand the latest pullback.
Bearish Divergence Signals
The Relative Strength Index, a momentum oscillator measuring the speed and magnitude of price movements, revealed a standard bearish divergence during the rally. Between February 15 and March 7, Pi Coin’s price formed higher highs while the RSI formed lower highs while remaining in overbought territory.
This configuration indicates that while prices continued climbing, the underlying buying momentum weakened. The signal was validated when the subsequent 8-hour candle on March 8 triggered the sharp correction.
Capital Flow Indicators Confirm Weakness
Chaikin Money Flow Analysis
The Chaikin Money Flow indicator, which tracks capital inflows and outflows by combining price movement with trading volume, showed deteriorating conditions despite the rally. Between March 5 and March 7, Pi Coin’s price continued rising, but CMF formed lower highs while remaining above the zero line.
This pattern suggests that although capital inflows remained present, they were not strong enough to sustain the rising price. Large capital flows slowed even as the rally extended.
Money Flow Index Signals
The Money Flow Index, which measures buying pressure using both price and trading volume as a proxy for dip-buying activity, told a similar story. During the same March 5-7 period, MFI also formed lower highs while Pi Coin moved higher.
This combination indicates that dip buyers were not stepping in strongly enough during the rally, leaving the market vulnerable to selling pressure when sellers finally intervened near $0.239.
Indicator Convergence
The three indicators formed a clear chain reaction: RSI showed buyers losing momentum, CMF showed weakening capital inflows, and MFI showed fading dip-buying demand. With all pointing in the same direction, the market became susceptible to the sharp pullback that followed.
Technical Structure and Moving Averages
Potential Golden Crossover
Despite the bearish signals, Pi Coin retains one technical factor that could support recovery. On the 8-hour chart, the 50-period Exponential Moving Average has nearly crossed above the 200-period EMA, approaching a golden crossover formation.
EMAs are trend indicators that give greater weight to recent prices, helping traders identify shifts in market direction. A golden crossover often signals strengthening bullish momentum and can attract new buyers.
If completed, the crossover could improve market structure by potentially pushing CMF higher, signaling renewed capital inflows, allowing MFI to recover as dip buyers return, and aligning momentum with price to invalidate the RSI divergence.
However, the crossover is not guaranteed to translate into sustained rally momentum, as weakening momentum could still prevent the signal from developing into a strong bullish trend.
Key Price Levels to Monitor
Resistance Zones
The recent rejection near $0.239 has established this level as key resistance. For bullish momentum to return, Pi Coin needs a clear 8-hour close above $0.224, signaling that buyers are regaining control after the correction.
If the price pushes above $0.224, the next major hurdle remains $0.239, where the latest rally was rejected. A successful break above this resistance could allow Pi Coin to resume the projected move from the cup-and-handle structure, with the full measured move still pointing toward $0.272, representing the remaining portion of the roughly 33 percent breakout rally.
Support Levels
 (Source: TradingView)
Downside risks remain significant. If Pi Coin falls back below $0.204, the breakout structure would begin to weaken. A deeper drop below $0.185 would likely signal that the bullish breakout has lost momentum and the market could return to its previous downtrend.
Current Status
The breakout technically remains valid as Pi Coin trades above the $0.204 neckline. However, after the sharp rejection and momentum divergence signals, the path toward the $0.272 target may depend on whether buyers can regain control above the newly established resistance levels.
FAQ: Pi Coin Technical Analysis
Q: Why did Pi Coin pull back after breaking out above $0.204?
A: The pullback was triggered by bearish divergence across multiple technical indicators. While price formed higher highs, the RSI showed weakening momentum, CMF indicated slowing capital inflows, and MFI signaled fading dip-buying demand. This combination left the market vulnerable to selling pressure when sellers stepped in near $0.239.
Q: What are the key price levels for Pi Coin to watch?
A: Resistance levels are $0.224 (needed to signal buyer control) and $0.239 (the recent rejection zone). The upside target from the cup-and-handle pattern remains $0.272. Support levels are $0.204 (breakout neckline) and $0.185 (level that would invalidate the bullish structure).
Q: What is a golden crossover and why does it matter for Pi Coin?
A: A golden crossover occurs when a shorter-term moving average crosses above a longer-term moving average, in this case the 50-period EMA crossing above the 200-period EMA on the 8-hour chart. This pattern often signals strengthening bullish momentum and can attract new buyers, potentially improving market structure and supporting further upside.
Q: Does Pi Coin’s breakout remain valid after the pullback?
A: The breakout technically remains valid as long as Pi Coin holds above the $0.204 neckline. However, the momentum divergence and sharp rejection suggest the path toward higher targets may require renewed buying strength and confirmation above resistance levels.