DeXe (DEXE), Chiliz (CHZ), and LayerZero (ZRO) are emerging as some of the most impressive cryptocurrencies in the past 24 hours. However, from a technical perspective, the altcoin market still carries significant risks as overall sentiment remains pressured by escalating tensions between the US and Iran.
Meanwhile, Bitcoin (BTC) is trading around $66,000 at the time of writing on Monday, after four consecutive days of decline. The sharp rise in oil prices, driven by the closure of the Strait of Hormuz and increasing unrest in the Middle East, is putting considerable pressure on the cryptocurrency market. This development raises the risk of Bitcoin losing the critical support zone of $60,000 — a price level established since early February.
Oil prices surpass $100, exerting pressure on Bitcoin
U.S. crude oil is trading around $113 per barrel in Monday morning Asian session — the highest since July 2022 — amid escalating geopolitical tensions in the Middle East. Disruptions in shipping through key maritime routes are causing supply shocks for many Asian economies. The surge in oil prices not only heightens inflation risks but may also force central banks to maintain tighter monetary policies longer than expected, adding significant pressure on risk assets like Bitcoin.
In this context, Bitcoin is currently trading around $66,000, down slightly from the $66,700 level set earlier in the day, indicating selling pressure remains persistent. This scenario raises concerns about a possible continuation of the four-day decline, especially after last week’s recovery was halted by the 50-day EMA near $73,000.
From a technical standpoint, the most probable scenario now is that Bitcoin could retest the support zone at $62,500, established since February. If the price decisively closes below this level, the downtrend could extend to the Fibonacci 1.272 level at $55,360, calculated from the October 6 high of $126,199, the November 21 low of $80,600, and the January 14 high of $97,924.
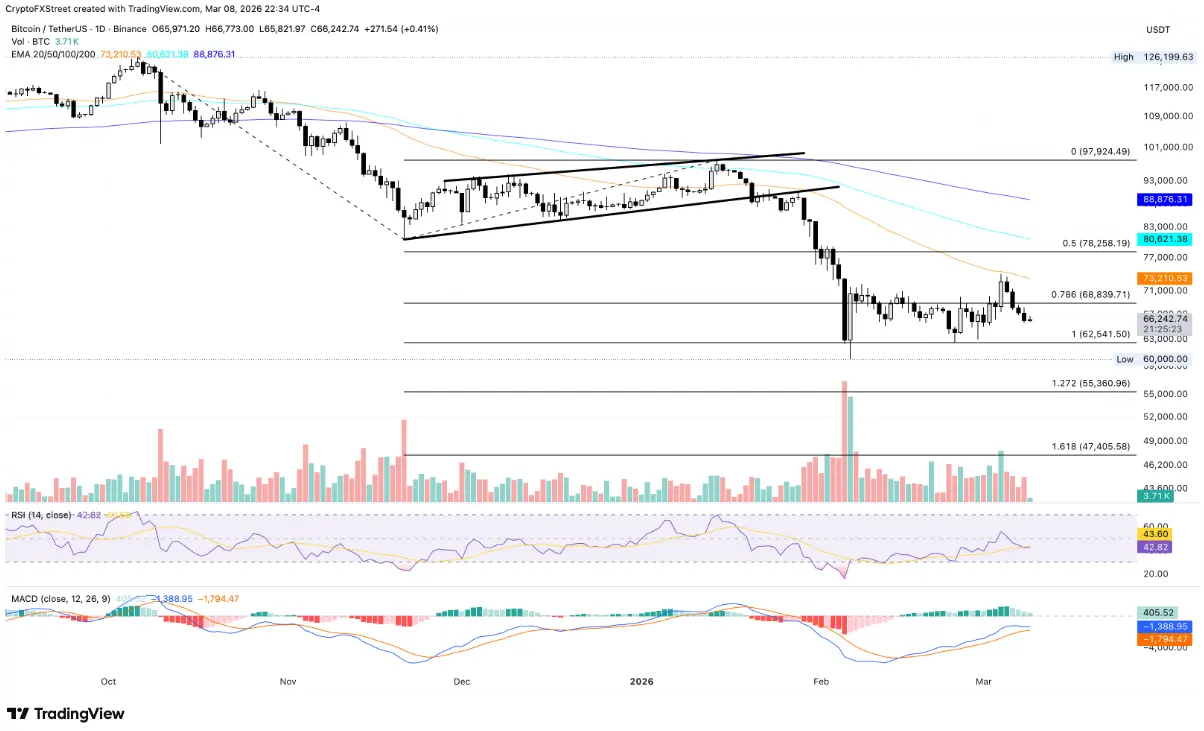 Daily BTC/USDT chart | Source: TradingView Momentum indicators also lean bearish. RSI is at 43, having fallen below the neutral threshold after four days of decline, reflecting increasing selling pressure. Meanwhile, the MACD line is slightly below zero and at risk of forming a bearish crossover with the signal line, with the histogram narrowing — signs that upward momentum is weakening.
Conversely, to restore bullish prospects, Bitcoin needs to break back above the 78.6% Fibonacci retracement at $68,839 and surpass the 50-day EMA around $73,220. Only then can the market confirm a sufficiently strong and sustainable recovery.
DeXe surges past $4, showing no signs of slowing down
DeXe is trading around $4 at the time of writing on Monday, up nearly 9% for the day, following a 7% rebound on Sunday. The continuous upward momentum indicates buying interest remains active in the market.
From a technical perspective, DEXE’s short-term outlook remains positive as the price stays above the 100-day EMA at around $3.59. This suggests the short-term trend continues to align with the previous upward move, based on the Fibonacci structure from the $1.7260 bottom to the $4.2870 top.
However, the 200-day EMA, currently at $5.02, remains above the current price, indicating the long-term picture is only gradually emerging from a previous downtrend and has not yet confirmed a sustainable bullish cycle.
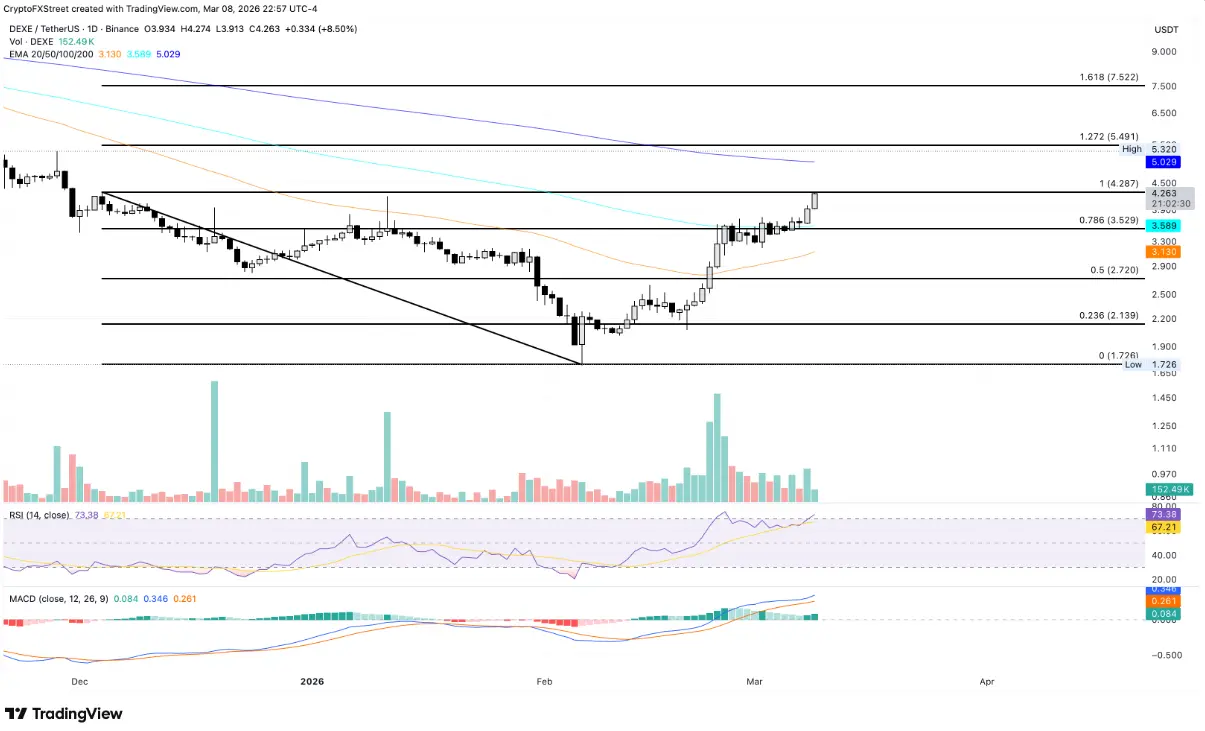 Daily DEXE/USDT chart | Source: TradingView Momentum indicators still favor the bulls. The MACD line is above the signal line and remains above zero, with the positive histogram slightly expanding, reflecting increasing buying pressure. RSI is at 73, deep into overbought territory, suggesting buyers are in control but also warning of potential short-term correction as the price reaches high levels.
If DEXE closes the day firmly above $4.28, key resistance levels to watch include:
In a correction scenario, the nearest support zones are:
Overall, the current technical structure still leans toward a short-term bullish trend, but the overbought RSI indicates the market could see some short-term pullbacks before resuming upward momentum.
Chiliz maintains recovery momentum as buying interest returns
Chiliz (CHZ) has gained about 3% at the time of writing on Monday, following a 5% rebound the previous session, signaling a slight short-term recovery.
However, the technical structure remains somewhat neutral to slightly bearish. The short-term trend is assessed as neutral but leaning bearish, with the 50, 100, and 200-day EMAs still above the price and all trending downward — indicating selling pressure has not yet fully eased.
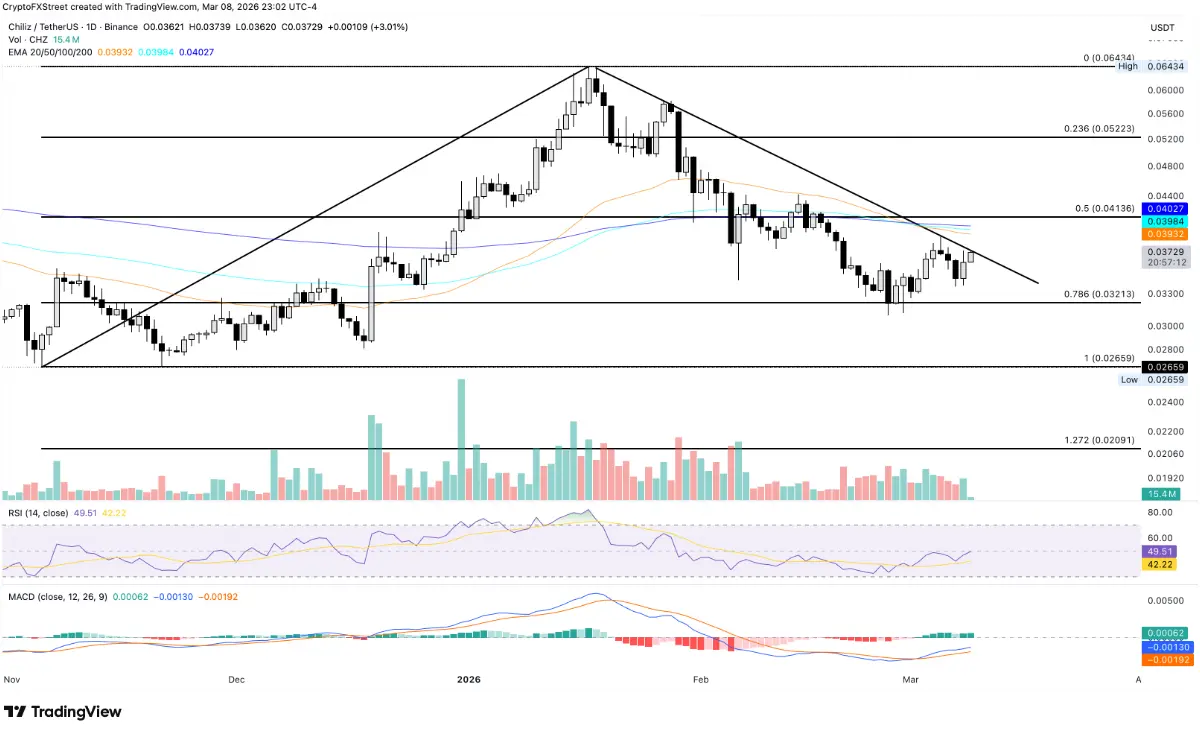 Daily CHZ/USDT chart | Source: TradingView From a momentum perspective, the MACD remains above the signal line and in positive territory, suggesting slightly stronger buying. RSI hovers around 49 — close to neutral — reflecting market indecision and the absence of a clear trend.
To confirm a more sustainable upward move, CHZ needs to break above the 50% Fibonacci level at $0.04136, measured from the November 5 bottom of $0.02659 to the January 17 top of $0.06424. Successfully crossing this resistance could open the way toward the 23.6% Fibonacci retracement at $0.05223.
On the downside, the key support zone is at the 78.6% Fibonacci level around $0.03213. Falling below this area would weaken the recovery scenario and increase the risk of retesting the recent bottom at $0.02659.
LayerZero aims to recover above $2 with potential Golden Cross formation
LayerZero (ZRO) is trading around $2.00, up nearly 3% for the day, with three consecutive recovery sessions indicating renewed buying interest.
If ZRO can break above the $2.057 level, the upward momentum could extend toward $2.599 — a significant resistance zone that previously halted the rally on February 11.
From a technical perspective, ZRO is currently above the 200-day EMA, while the 50-day EMA is trending upward and approaching the 200-day EMA. A bullish crossover of these two moving averages would form a Golden Cross — a notable buy signal for price action traders, often indicating a strengthening short-term trend relative to the long-term trend.
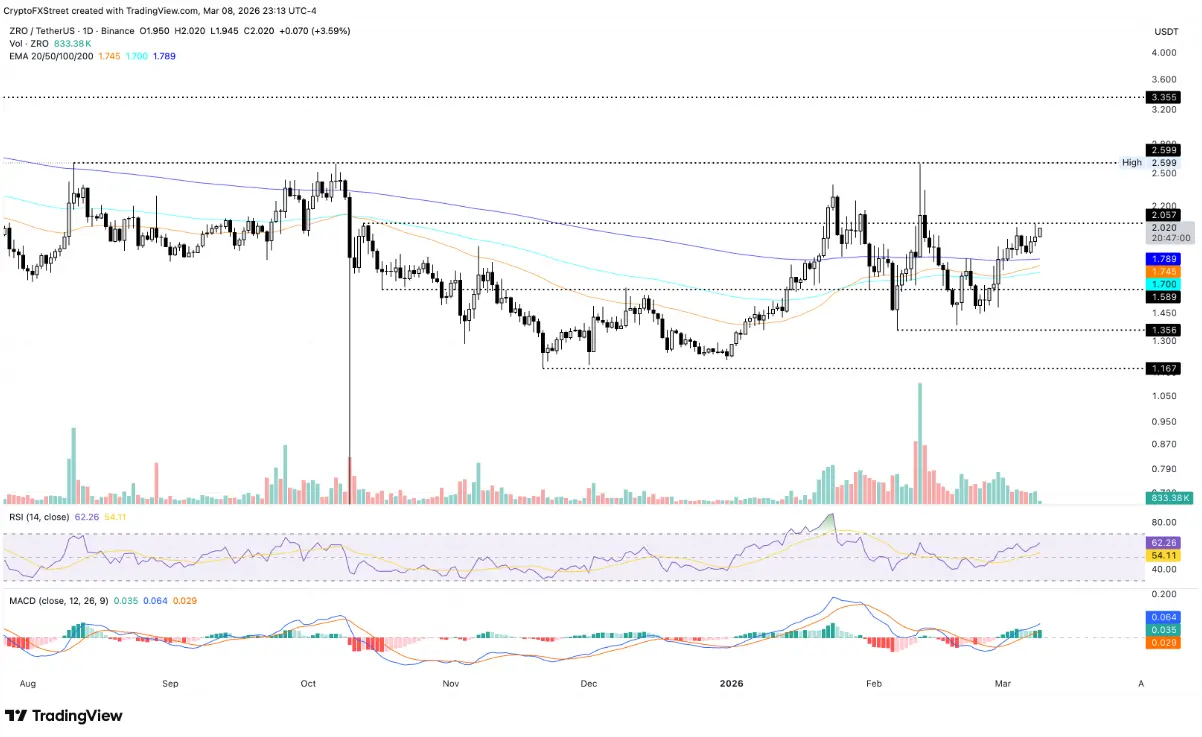 Daily ZRO/USDT chart | Source: TradingView Momentum indicators also support a positive outlook. The MACD remains above the signal line with a slight green histogram, and RSI is at 60, indicating momentum remains steady without entering overbought territory.
In a correction scenario, key support zones for ZRO include:
These levels are considered important technical buffers that could help sustain the current bullish structure if selling pressure increases.