Pi Network (PI), Kaia (KAIA), and Virtuals Protocol (VIRTUAL) continue their upward trend for the third consecutive day this week, despite Bitcoin (BTC) still hovering around the $70,000 mark and unable to establish a clear breakout. As buying interest gradually returns to the market, the technical outlook for PI, KAIA, and VIRTUAL is focusing on the nearest resistance levels — key thresholds that could determine whether the current recovery momentum can be sustained.
Bitcoin’s Recovery Stalls Near $70,000
Bitcoin remains in a familiar accumulation zone, unable to break out convincingly. The downward trendline formed from the peaks on January 14 and January 28 continues to act as a significant ceiling, exerting ongoing pressure on the price’s upward movement. Meanwhile, mixed signals surrounding US-Iran tensions are causing both the global financial markets and the cryptocurrency market to remain cautious.
On the positive side, the stabilization of oil prices and prospects for easing Middle East tensions could improve investors’ risk appetite. West Texas Intermediate (WTI) crude oil has retreated to around $82 in early Asian trading, down sharply from the $112 high recorded on Monday. This move reflects a cooling of the energy market after the International Energy Agency (IEA) proposed the largest oil reserve release in history.
 Daily BTC/USDT Chart | Source: TradingView
From a technical perspective, a decisive close above $73,165 (the high on February 5) would confirm a breakout of the downtrend and the current accumulation zone, signaling a potential bullish reversal. This could strengthen Bitcoin’s upward momentum and open the way toward the $80,000 level.
Daily BTC/USDT Chart | Source: TradingView
From a technical perspective, a decisive close above $73,165 (the high on February 5) would confirm a breakout of the downtrend and the current accumulation zone, signaling a potential bullish reversal. This could strengthen Bitcoin’s upward momentum and open the way toward the $80,000 level.
Conversely, if the price reverses and closes weaker, a rejection at the upper trendline would be reinforced, increasing the risk of a deeper correction back toward $62,345 — the low set on February 5.
Pi Network Approaching the 200-Day EMA
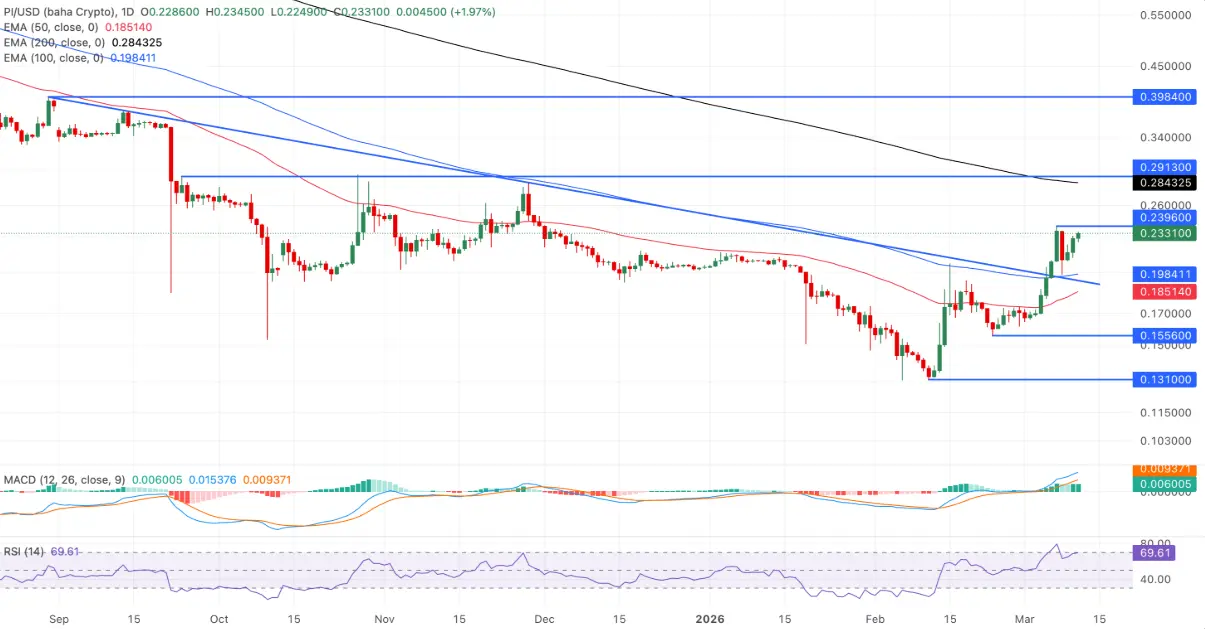
As of Wednesday, Pi Network has gained about 2%, bringing its weekly rally to over 10% after three consecutive recovery sessions. Notably, PI’s price has broken above the long-term downtrend and surpassed the 100-day EMA at $0.1984, indicating a short-term bullish reversal.
The 50-day and 100-day EMAs are now trending upward, suggesting a developing short-term bullish structure, although the 200-day EMA remains sloped downward at $0.2843, reflecting ongoing long-term resistance.
 Daily PI/USDT Chart | Source: TradingView
In an upward scenario, the nearest resistance for PI is at Saturday’s high of $0.2396. If the price convincingly breaks through this level, it could extend its rally toward the 200-day EMA at $0.2843.
Daily PI/USDT Chart | Source: TradingView
In an upward scenario, the nearest resistance for PI is at Saturday’s high of $0.2396. If the price convincingly breaks through this level, it could extend its rally toward the 200-day EMA at $0.2843.
Daily technical indicators are showing improving bullish momentum. The MACD remains above its signal line and in positive territory, with a slight positive histogram — a sign that buying pressure is gaining strength. Meanwhile, the RSI is at 69, indicating strong upward momentum but also nearing overbought conditions.
However, if the price fails to break above $0.2396 and gets rejected, PI could retrace to test the support zone around the 100-day EMA at $0.1984, which coincides with the recently broken downtrend line — a key short-term support level.
Kaia Approaching a Critical Resistance
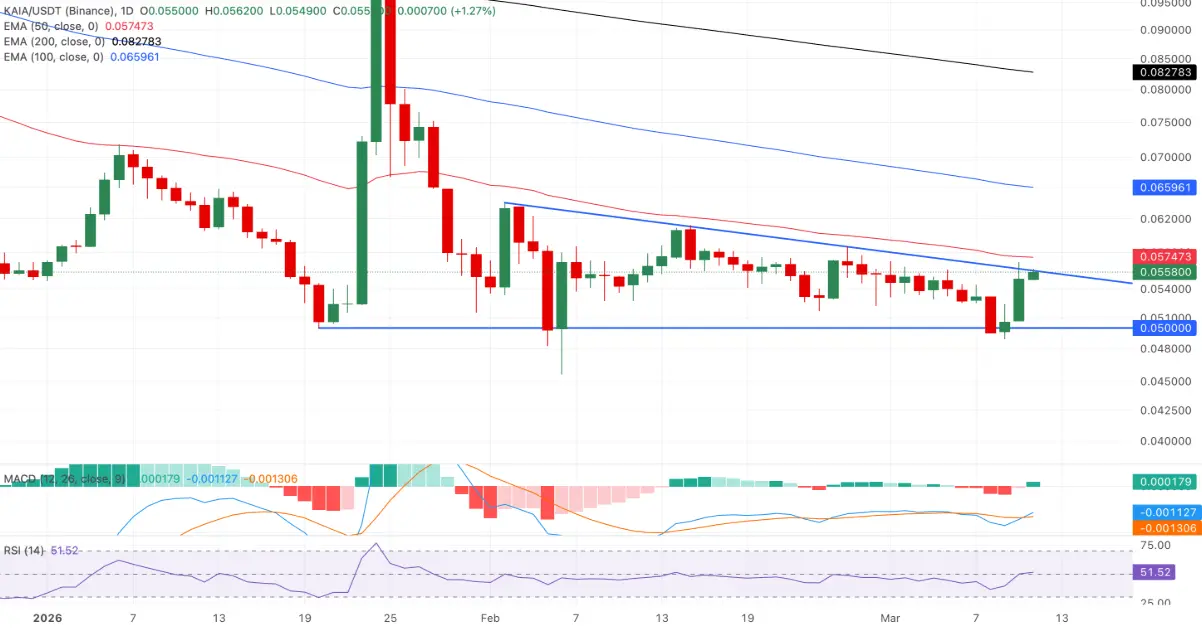
Kaia (KAIA) is regaining upward momentum after a steady rebound from the psychological support at $0.05000. The price is approaching the short-term downtrend line, aligned with the 50-day EMA at approximately $0.05745 — an important technical level testing the strength of the recovery. Although the weekly gain has reached about 12%, the downward sloping resistance still somewhat limits the bulls’ efforts.
On a broader technical scale, KAIA remains below the 50, 100, and 200-day EMAs, indicating the dominant trend still faces downward pressure despite signs of stabilization. If the price can close firmly above the 50-day EMA, the recovery scenario could strengthen, opening room to challenge the 100-day EMA at $0.06599.
 Daily KAIA/USDT Chart | Source: TradingView
Momentum indicators are also cautiously improving. The 50-day EMA has crossed above its signal line near $0.050, reflecting initial recovery momentum, but more buying volume is needed to confirm a clear reversal. The RSI at 51 suggests a balanced state between supply and demand, though market sentiment remains fragile after bouncing from the $0.0500 support.
Daily KAIA/USDT Chart | Source: TradingView
Momentum indicators are also cautiously improving. The 50-day EMA has crossed above its signal line near $0.050, reflecting initial recovery momentum, but more buying volume is needed to confirm a clear reversal. The RSI at 51 suggests a balanced state between supply and demand, though market sentiment remains fragile after bouncing from the $0.0500 support.
On the downside, if selling pressure resumes, the $0.05000 zone will continue to serve as a critical short-term support level for the bulls.
Virtuals Protocol Strengthens Its Recovery
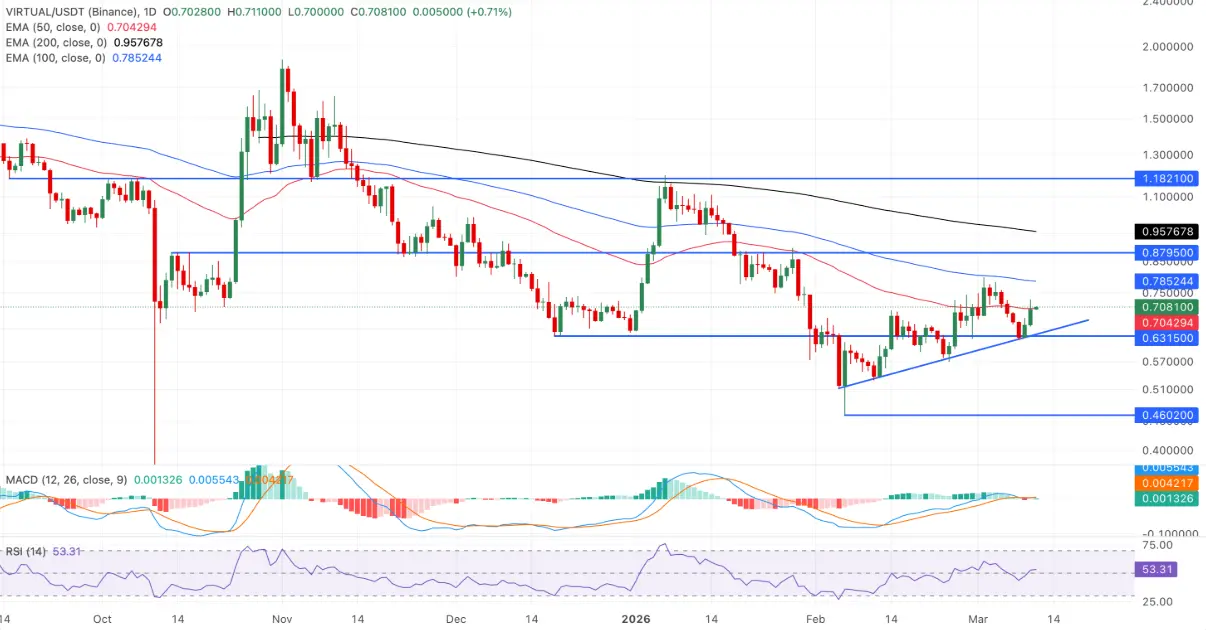
Similar to Kaia, Virtuals Protocol (VIRTUAL) is approaching the 50-day EMA at $0.7042 — a key short-term resistance that could determine the next move. At the time of writing, VIRTUAL has recorded three consecutive gains after a roughly 6% increase in the previous session, indicating renewed buying interest.
A daily close above $0.7042 could extend the rally toward the 100-day EMA at $0.7852. However, the long-term outlook remains cautious as the 200-day EMA continues to slope downward, reflecting that the overall trend has not yet fully reversed.
 Daily VIRTUAL/USDT Chart | Source: TradingView
From a technical standpoint, the MACD line is slightly above its signal line and oscillating around zero, with the histogram turning positive — signs that bullish momentum is emerging but still relatively weak. The RSI at around 53 indicates a neutral-to-positive stance, suggesting the market is recovering cautiously rather than entering a strong rally.
Daily VIRTUAL/USDT Chart | Source: TradingView
From a technical standpoint, the MACD line is slightly above its signal line and oscillating around zero, with the histogram turning positive — signs that bullish momentum is emerging but still relatively weak. The RSI at around 53 indicates a neutral-to-positive stance, suggesting the market is recovering cautiously rather than entering a strong rally.
On the downside, the nearest support is at the upward trendline passing through the $0.6600 area. If this level is broken, selling pressure could increase, pushing the price back to retest the reaction low of $0.6315, established on December 18.
Disclaimer: The information on this page may come from third parties and does not represent the views or opinions of Gate. The content displayed on this page is for reference only and does not constitute any financial, investment, or legal advice. Gate does not guarantee the accuracy or completeness of the information and shall not be liable for any losses arising from the use of this information. Virtual asset investments carry high risks and are subject to significant price volatility. You may lose all of your invested principal. Please fully understand the relevant risks and make prudent decisions based on your own financial situation and risk tolerance. For details, please refer to
Disclaimer.