The price of Shiba Inu (SHIB) is fluctuating around $0.0000056 as of writing on Wednesday, after rising nearly 7% over the past two days. This recovery appears as on-chain indicators and derivatives market data begin to signal positive momentum. Trading volume has increased significantly, while the number of long positions has reached its highest level in over a month, indicating investor optimism is gradually returning to the market.
Meme coin SHIB shows positive signals
Data from Santiment shows that trading volume within the Shiba Inu ecosystem — the total value of transactions generated by on-chain applications — surged to $214.28 million on Wednesday, the highest since February 6. This strong increase reflects a surge in trader interest and liquidity for the meme coin featuring the dog mascot, reinforcing short-term bullish expectations.
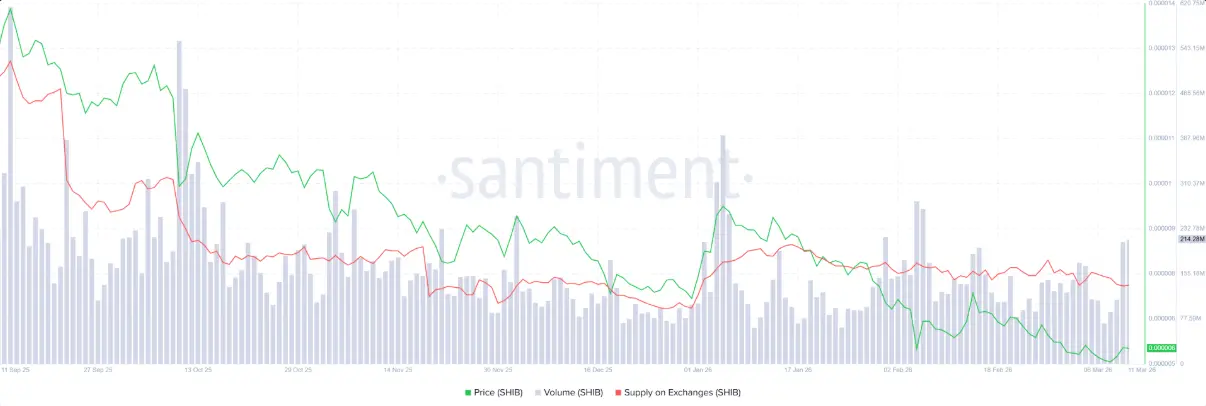 Shiba Inu trading volume chart | Source: Santiment In the derivatives market, data from CoinGlass indicates that the SHIB long/short ratio rose to 1.36 on Wednesday — the highest in over a month. A ratio above 1 suggests most traders are leaning toward further price increases, with long positions dominating.
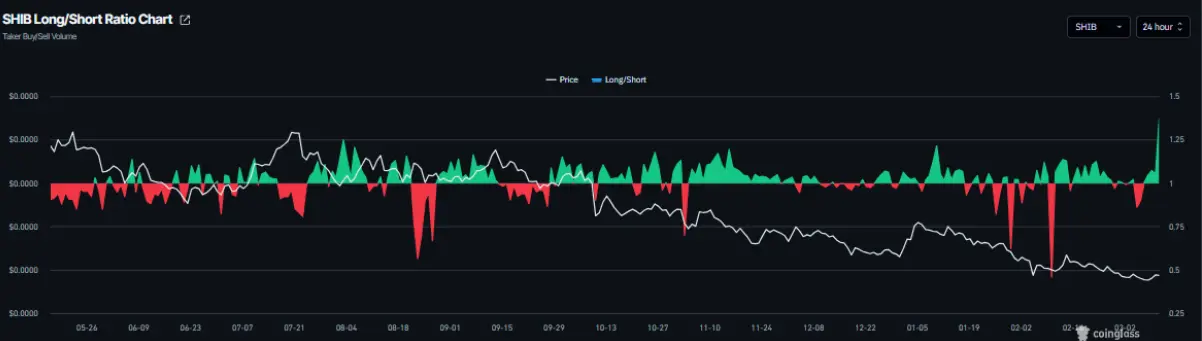 SHIB long/short ratio chart | Source: Coinglass Despite the rising trading volume and the wave of long positions, the SHIB community should remain cautious. Data from CryptoQuant presents a mixed picture of the market.
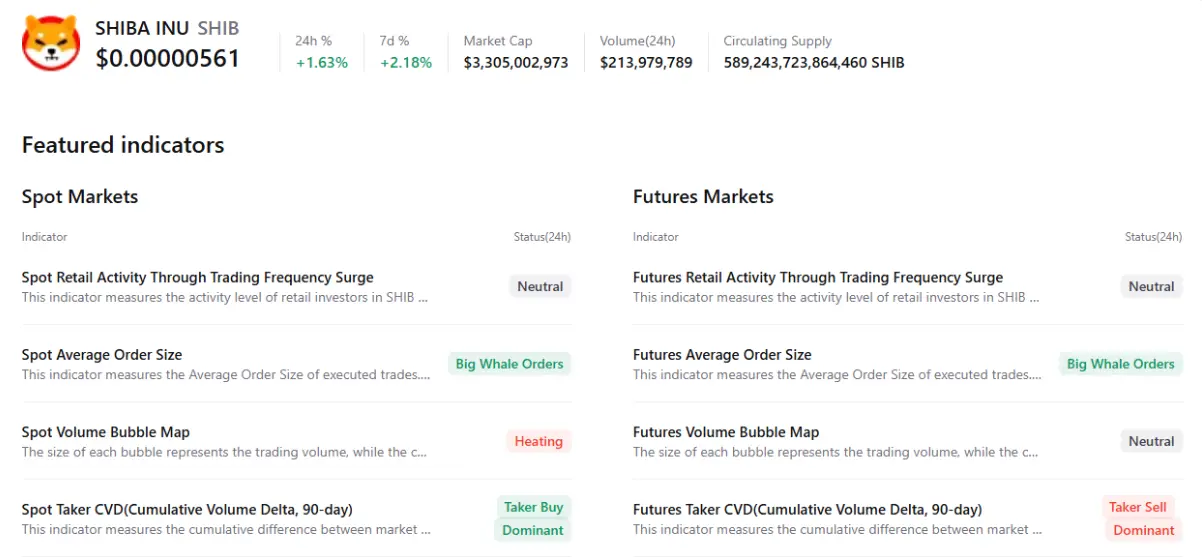
Specifically, activity in both spot and futures markets is slightly tilted toward positive, thanks to large buy orders from whales and buying pressure in the spot market. However, the overheated state of the spot market combined with selling pressure dominating the futures market reflects a cautious, even pessimistic, sentiment among some investors.
Shiba Inu price forecast: Momentum indicators show weakening downward pressure
Shiba Inu broke above the resistance level of $0.0000054 on Monday and closed higher, then continued to rise about 4% in the following session. As of Wednesday, SHIB is trading around $0.0000056, indicating the short-term recovery trend remains intact.
If buying momentum continues, SHIB could extend its rally toward the 50-day EMA at $0.0000063 — an important technical level. A solid close above this level could open the door for a new upward move, with the next weekly resistance zone around $0.0000067.
 Daily SHIB/USDT chart | Source: TradingView Technical signals are gradually supporting a bullish scenario. The daily RSI is at 43 and trending toward the neutral 50 level, suggesting selling pressure is weakening. If RSI breaks above this threshold, bullish momentum could strengthen further.
Meanwhile, the MACD indicator has formed a bullish crossover on Tuesday, signaling early signs that a recovery trend may be taking shape.
However, caution is still warranted. If buying pressure diminishes, SHIB could reverse and test the February 6 bottom around $0.0000050.
Disclaimer: The information on this page may come from third parties and does not represent the views or opinions of Gate. The content displayed on this page is for reference only and does not constitute any financial, investment, or legal advice. Gate does not guarantee the accuracy or completeness of the information and shall not be liable for any losses arising from the use of this information. Virtual asset investments carry high risks and are subject to significant price volatility. You may lose all of your invested principal. Please fully understand the relevant risks and make prudent decisions based on your own financial situation and risk tolerance. For details, please refer to
Disclaimer.