Author: Michel Athayde, Bitget Wallet BD Ambassador
Summary
In traditional financial markets, long-term deep out-of-the-money (OTM) puts are often seen as a classic “black swan insurance” strategy: constantly paying premiums with small losses during normal times, but once extreme risk events occur, they pay off big or even generate substantial profits. The question is, does this logic still hold in the more volatile, crash-prone crypto markets?
This backtest provides a nuanced answer. Using historical data from 2018-01-01 to 2026-03-14, we systematically tested BTC and ETH: buying one deep OTM put each month at fixed intervals, holding until expiration, without timing the market. The results show this isn’t a “consistently profitable” strategy but rather an extremely right-skewed, low-win-rate tail insurance tool with strong path dependence. Under the benchmark portfolio, BTC’s total return is 97.62%, while ETH’s is -73.07%. In other words, the same logic can lead to completely different long-term outcomes across assets.
Background
“Long-term insurance buying” has long been a controversial strategy. Supporters argue that long-term capital fate is determined not by daily volatility but by a few systemic crashes; opponents believe that paying premiums year after year amounts to a deterministic loss betting on uncertain disasters.
Crypto markets make this debate even more interesting. On one hand, BTC and ETH exhibit much higher volatility than traditional assets, with crashes being common; on the other hand, extreme events occur more frequently, theoretically making tail hedging more viable. So a key question arises: if you buy a deep OTM put mechanically every month from 2018 onward, without timing or judgment, can this “dumb” tail insurance strategy be profitable in the long run?
Strategy Design
The rules for this test are simple and strict. Each month, on the first calendar day, open a position; if no data is available that day, defer to the next trading day. Buy one European-style put, hold until expiration, with no early take-profit or stop-loss. The target delta for the position is 0.01, with a 30-day expiration. Starting capital is $2,000, investing 2% of the current account net value each time. If funds are insufficient to buy a full contract, scale the position accordingly.
For sensitivity analysis, the backtest was extended to delta 0.02 and 0.05, investment ratios 1%, 2%, 5%, and expiration days 14, 30, 45, totaling 54 parameter combinations.
Methodology
Pricing uses Black-Scholes, assuming a risk-free rate of 0, with volatility proxying the annualized standard deviation of the past 30 days’ returns. Strike prices are derived via delta inversion, not arbitrarily set. Data coverage for BTC and ETH spans to 2026-03-14, with no missing dates or prices after cleaning—3055 BTC records and 3048 ETH records, with no gaps needing correction. Missing trades are only due to expiration dates beyond the backtest period, with no silent failures.
In other words, the conclusions are based on a comprehensive historical replay of BTC and ETH under the same rules, not on limited samples or incomplete data.
Results
First, look at the benchmark: the version closest to “monthly fixed deep OTM put buying”—delta 0.01, 2% investment, 30-day hold.
Results are highly divergent. BTC executed 98 trades, ending with a total return of 97.62%, annualized return of 8.66%. ETH also executed 98 trades but ended with a -73.07% total return, annualized -14.78%. Simply put, this strategy would be profitable over the long term for BTC but not for ETH.
But more important than the returns themselves is the cost of those returns. BTC’s maximum drawdown reached -97.24%, ETH’s -93.82%. BTC’s win rate was only 2.04%, ETH’s even lower at 1.02%. The median profit per trade was -100%, and the worst trades also lost 100%. This means that most of the time, the strategy isn’t just “small losses” but ends up losing all premiums at expiration.
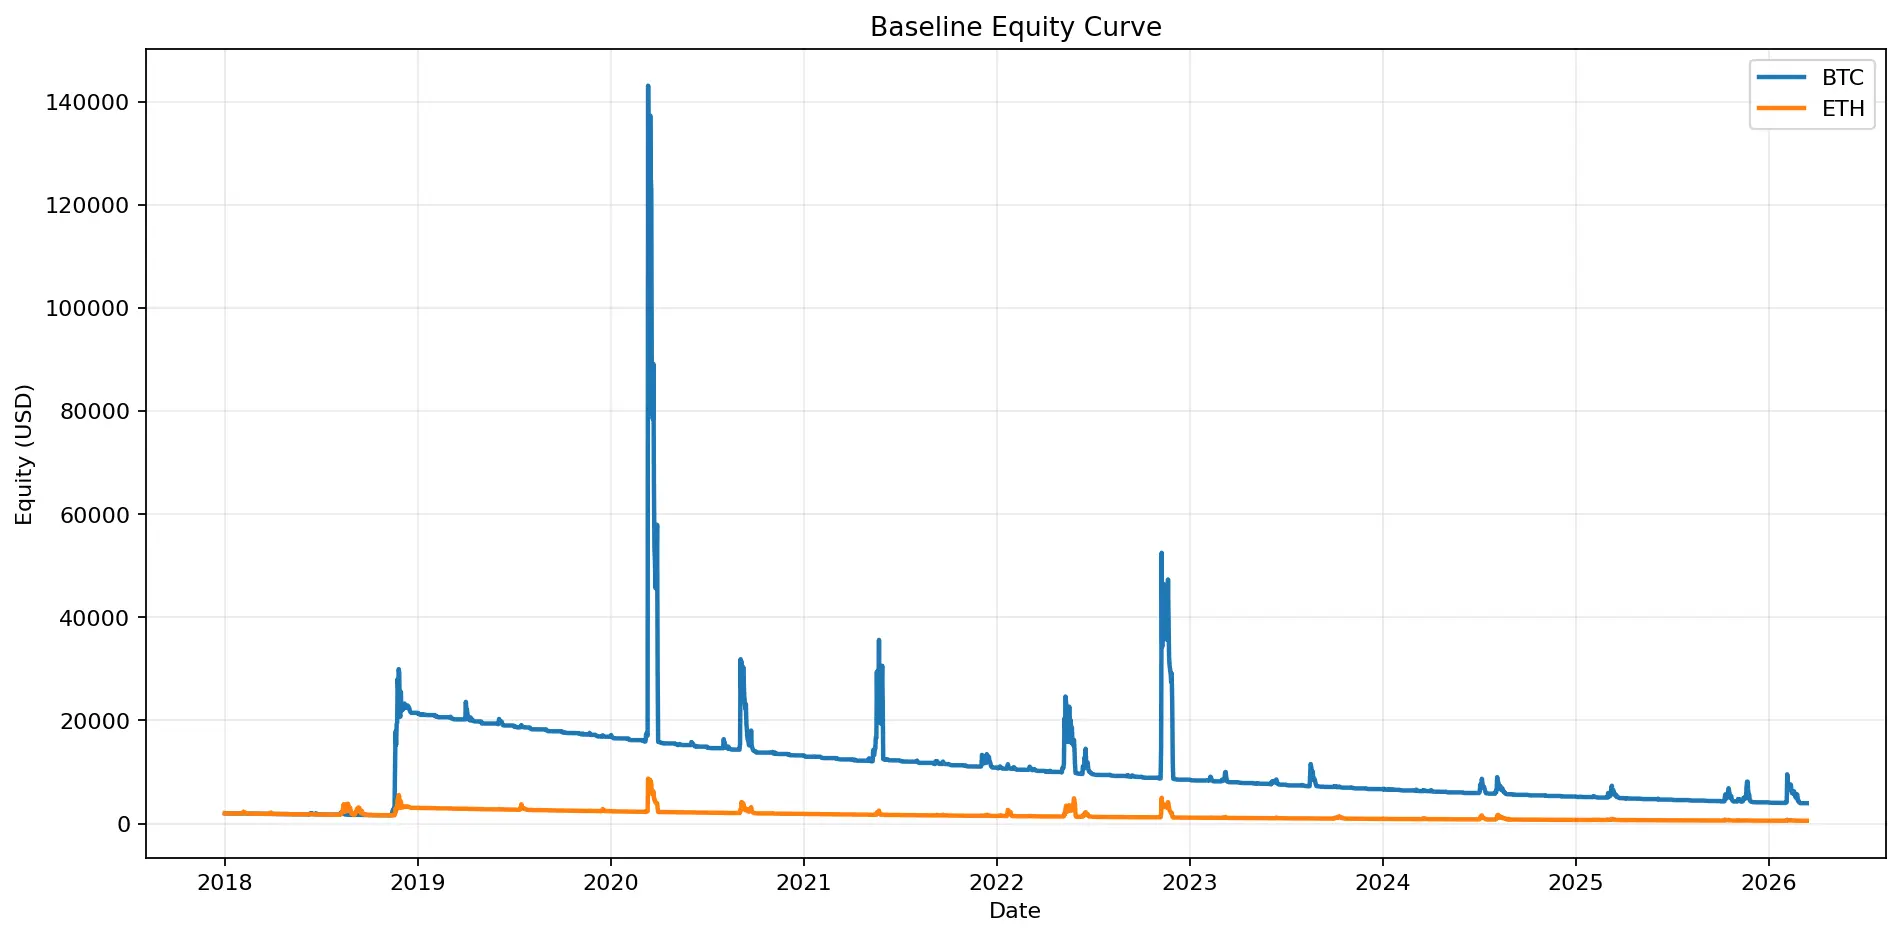
Figure 1: The equity curve of the benchmark portfolio shows a clear divergence between BTC and ETH over the long term—BTC ends with positive gains, ETH remains in a downward trend.
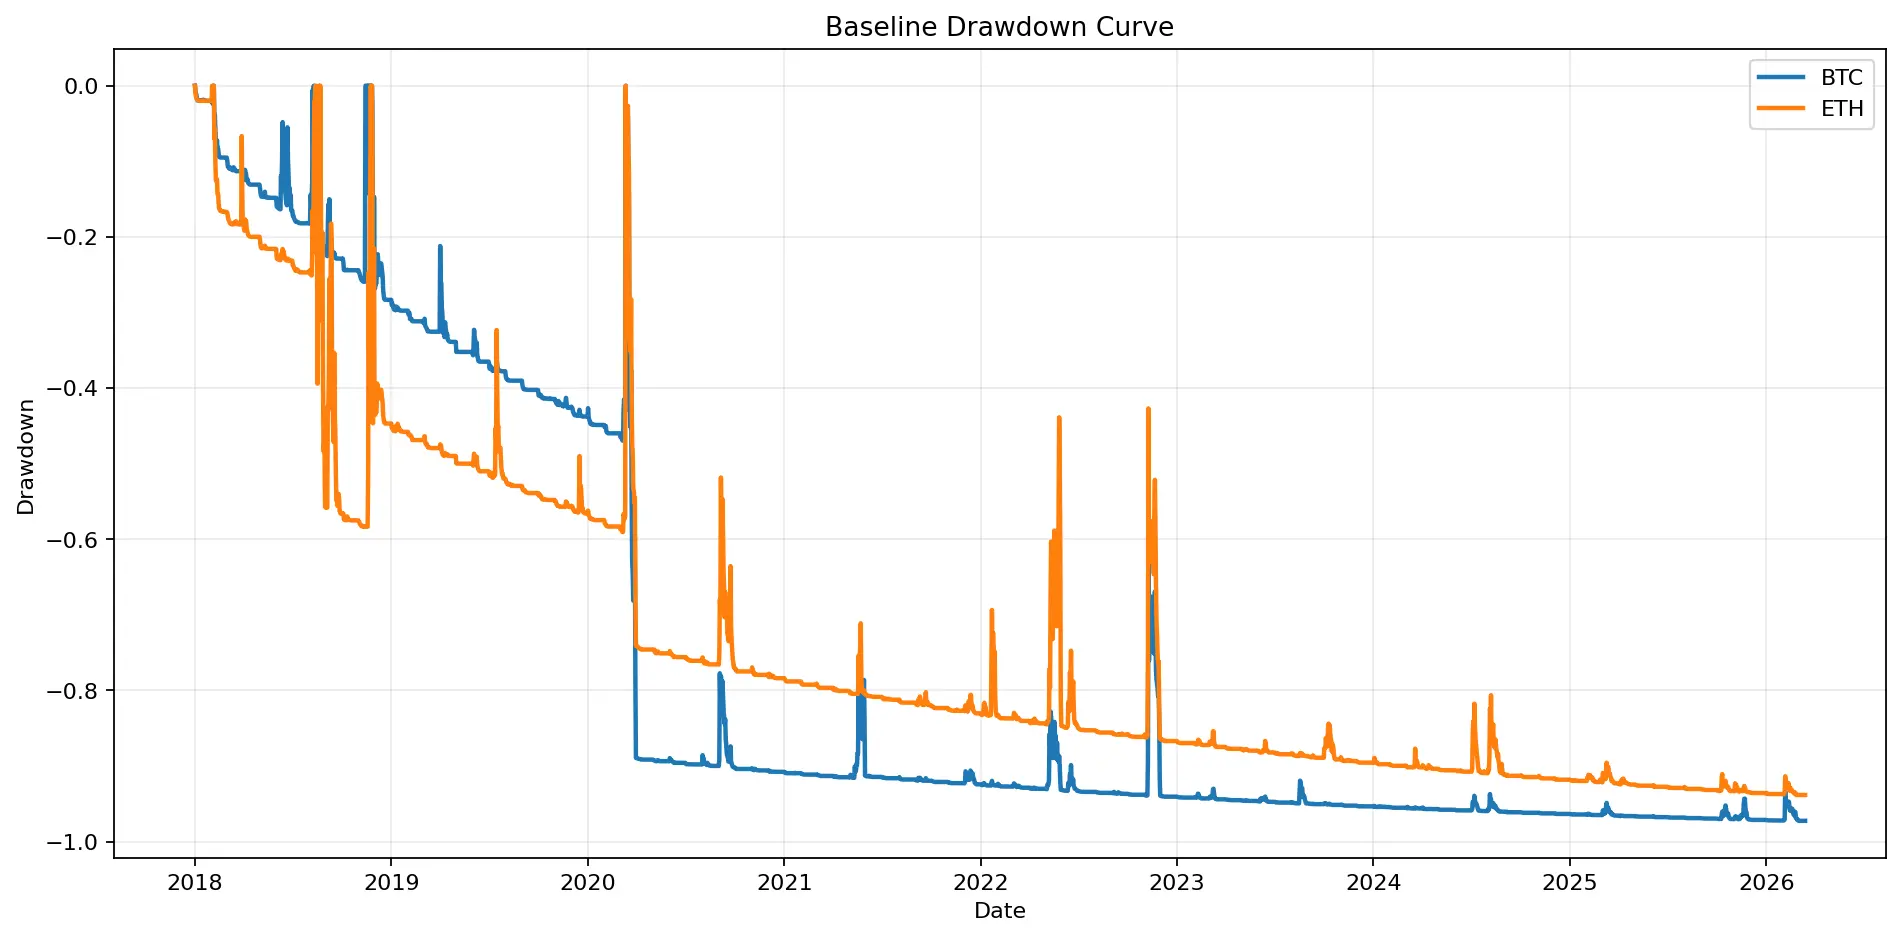
Figure 2: Drawdown curves illustrate that even strategies that ultimately profit can spend long periods deeply underwater. BTC’s maximum drawdown hits -97.24%, ETH’s -93.82%.
Visually, this is very intuitive. The capital curve isn’t a smooth upward line but spends most of its time near lows, occasionally jumping due to extreme gains; the drawdown curve remains deeply negative for long stretches. The histogram of individual trade returns is heavily skewed left, with most trades at -100%, and only a few extreme winners. It’s not a traditional “high win rate” strategy but rather a “positive skewness” strategy.
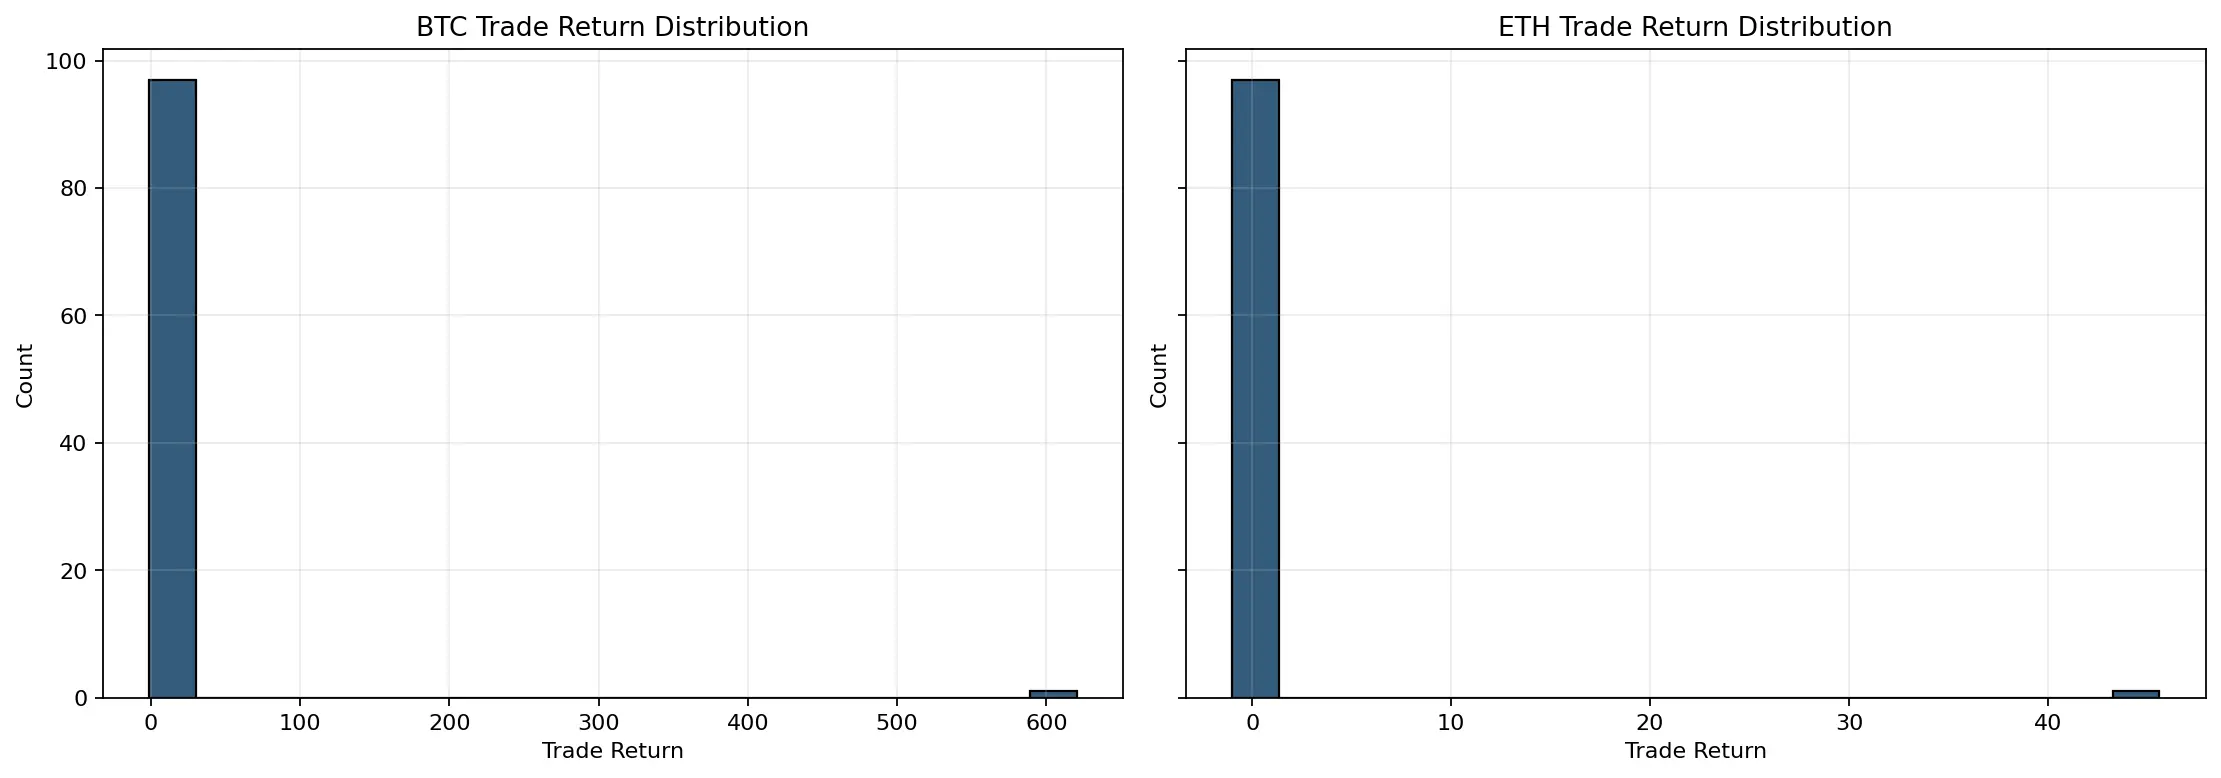
Figure 3: Distribution of individual trade returns is highly right-skewed. Most months’ premiums are lost, with only a few extreme profitable trades driving long-term results.
Source of Returns
The core feature of this strategy is that profits don’t come from “most months being profitable,” but from “a very small number of months with huge gains.”
For BTC, only 4.08% of months are profitable; for ETH, only 2.04%. BTC’s longest losing streak is 57 months; ETH’s is 87 months. So even if the strategy ends up profitable, investors may have to endure years of continuous losses and a sense of failure.
On the other hand, BTC’s best single trade returned over 620x, with an average per-trade profit of 5.36x driven by extreme winners; skewness reaches 9.90, kurtosis nearly 98. The top 5 winning trades contribute over 10x the total net profit. These numbers reveal the essence: it’s not about steady carry but about a few extreme moments that reimburse years of premiums in one shot.
ETH exhibits similar features, but the extreme gains are insufficient to offset long-term losses. Under the benchmark, ETH paid $2,984.47 in premiums but only recovered $1,523.06 at expiration, with a Premium Burn Ratio of 48.97%. BTC paid $18,903.47 in premiums and recovered $20,855.85, with a Premium Burn Ratio of -10.33%, indicating that extreme market moves eventually offset the premiums paid, even leaving a surplus.
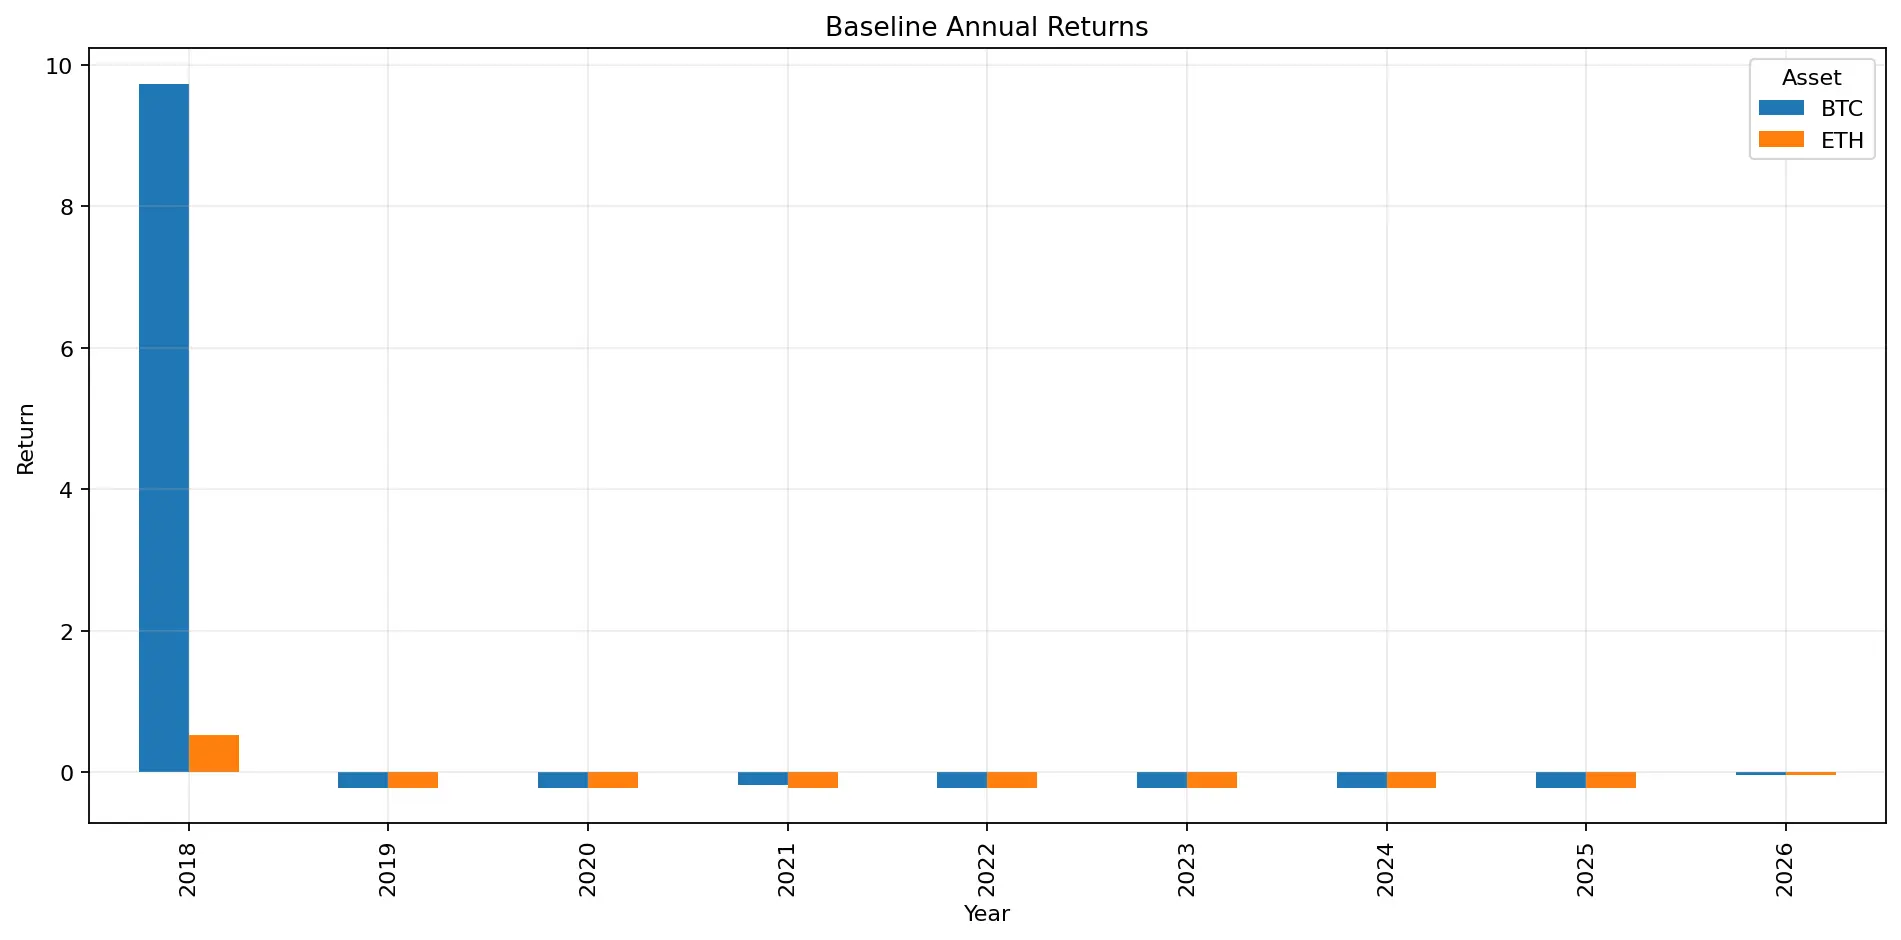
Figure 4: Contribution of extreme profitable trades shows that BTC’s long-term gains are almost entirely driven by a handful of top trades—classic tail insurance behavior.
Contribution of Extreme Events
An interesting finding is that “market crashes” don’t necessarily mean your puts will profit. We examined positions around key events: the March 2020 pandemic crash, May 2021 crypto crash, Luna event in May 2022, and FTX collapse in November 2022.
Results are not romantic. Only the May 2021 event was profitable for BTC, with a single-trade return of 127.09%, a 2.27x recovery, contributing 15.87% to total profit. The other three events—March 2020, May 2022, November 2022—resulted in complete loss of premiums (100%). ETH was even more extreme, losing 100% of premiums in all four cases.
This shows tail insurance isn’t “profit whenever a black swan occurs” but highly dependent on timing, remaining time, and strike placement. Regular monthly rolling buys ensure long-term presence but don’t guarantee holding the most profitable contract at the right moment.
BTC vs ETH Performance Differences
Across all parameter combinations, BTC outperforms ETH. The average total return for BTC across all parameters is 1326.06%, with a CAGR of 23.87% and a Tail Insurance Score of 0.544. ETH averages 519.48%, 13.39%, and 0.362 respectively. In the benchmark, BTC is positive, ETH negative, a difference clearly visible in the net value comparison charts across different deltas and durations.
More importantly, BTC’s extreme gains are better able to cover long-term premium costs, while ETH tends to stay in a “long premium, not necessarily recovered” state. Simply put, BTC’s tail insurance is more “payoff-ready,” whereas ETH’s is more costly and less likely to pay off.
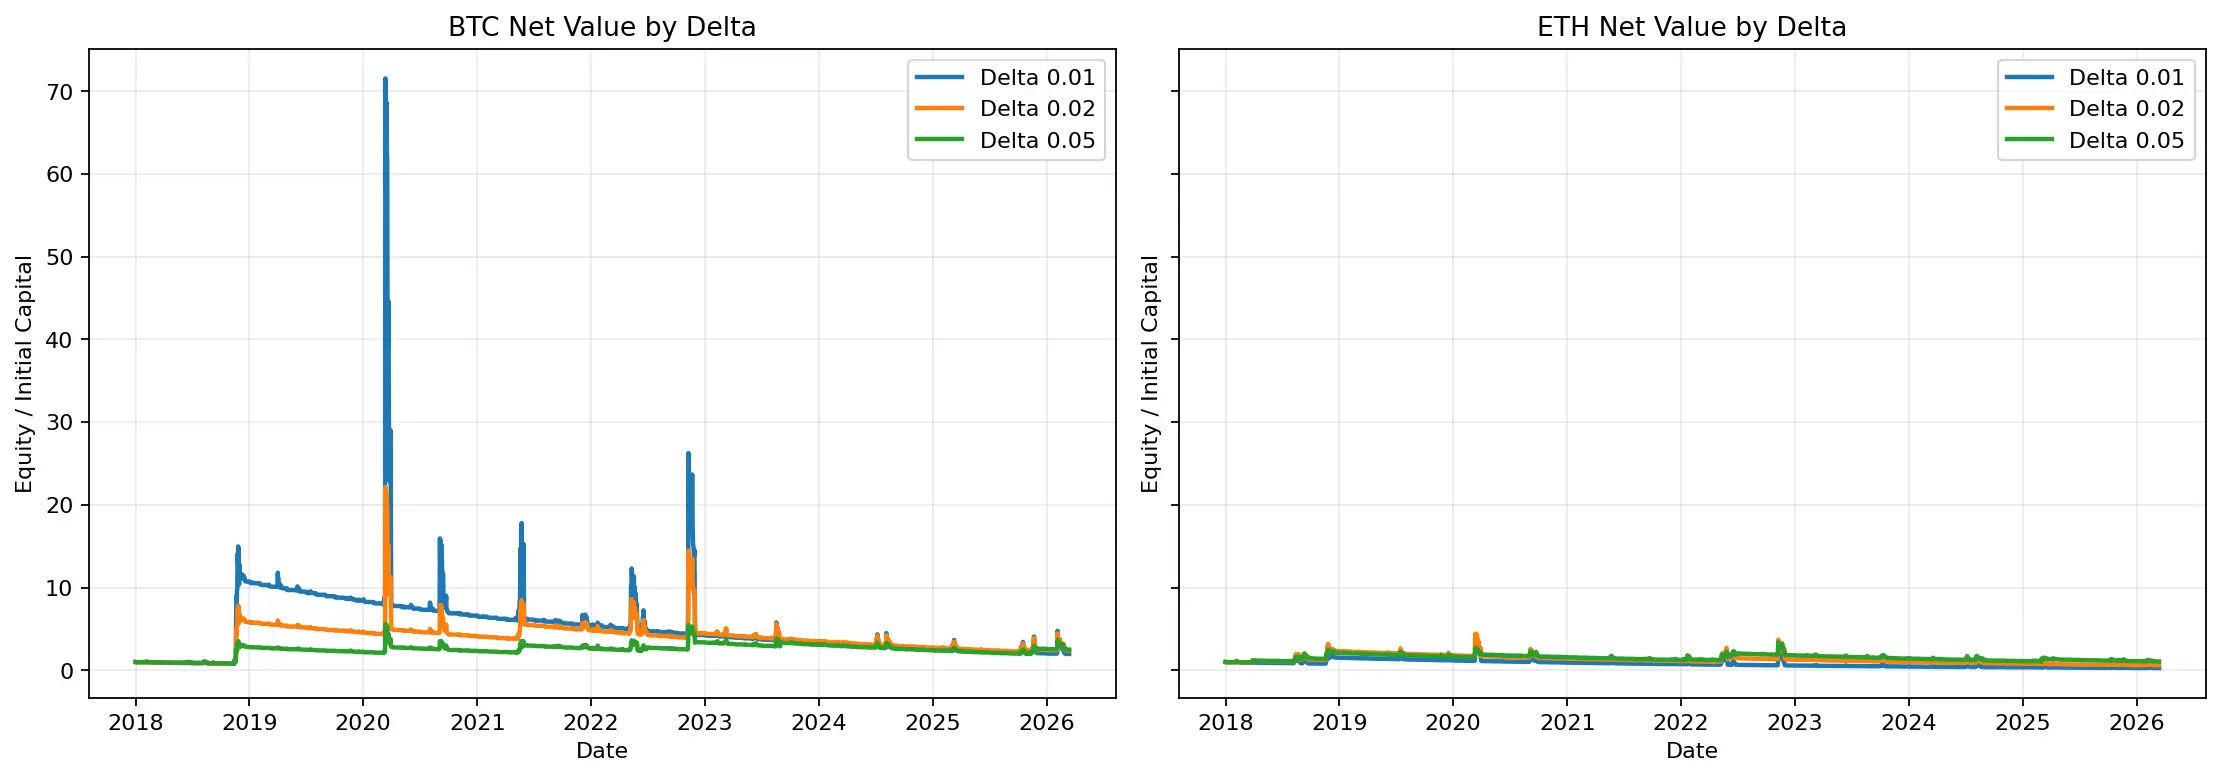
Figure 5: Comparison of BTC and ETH benchmark strategies shows that, despite both experiencing extreme volatility, BTC’s tail insurance is more efficient.
Parameter Sensitivity: Is Deeper Out-of-the-Money Better?
Parameter analysis provides a fuller picture. Ranking by total return, the best combination appears in BTC: delta 0.01, 2% investment, 45-day expiration, with a total return of 9747.06%, CAGR of 74.99%. For “profitability,” deeper out-of-the-money, longer duration, and moderate leverage perform very well in BTC.
However, considering risk constraints, the lowest maximum drawdown combination is ETH with delta 0.05, 1% investment, 14-day expiration, at -37.89%. Overall, delta 0.02 strikes a good balance across total return, Calmar ratio, and premium burn ratio, making it the most “reasonable” delta in this grid.
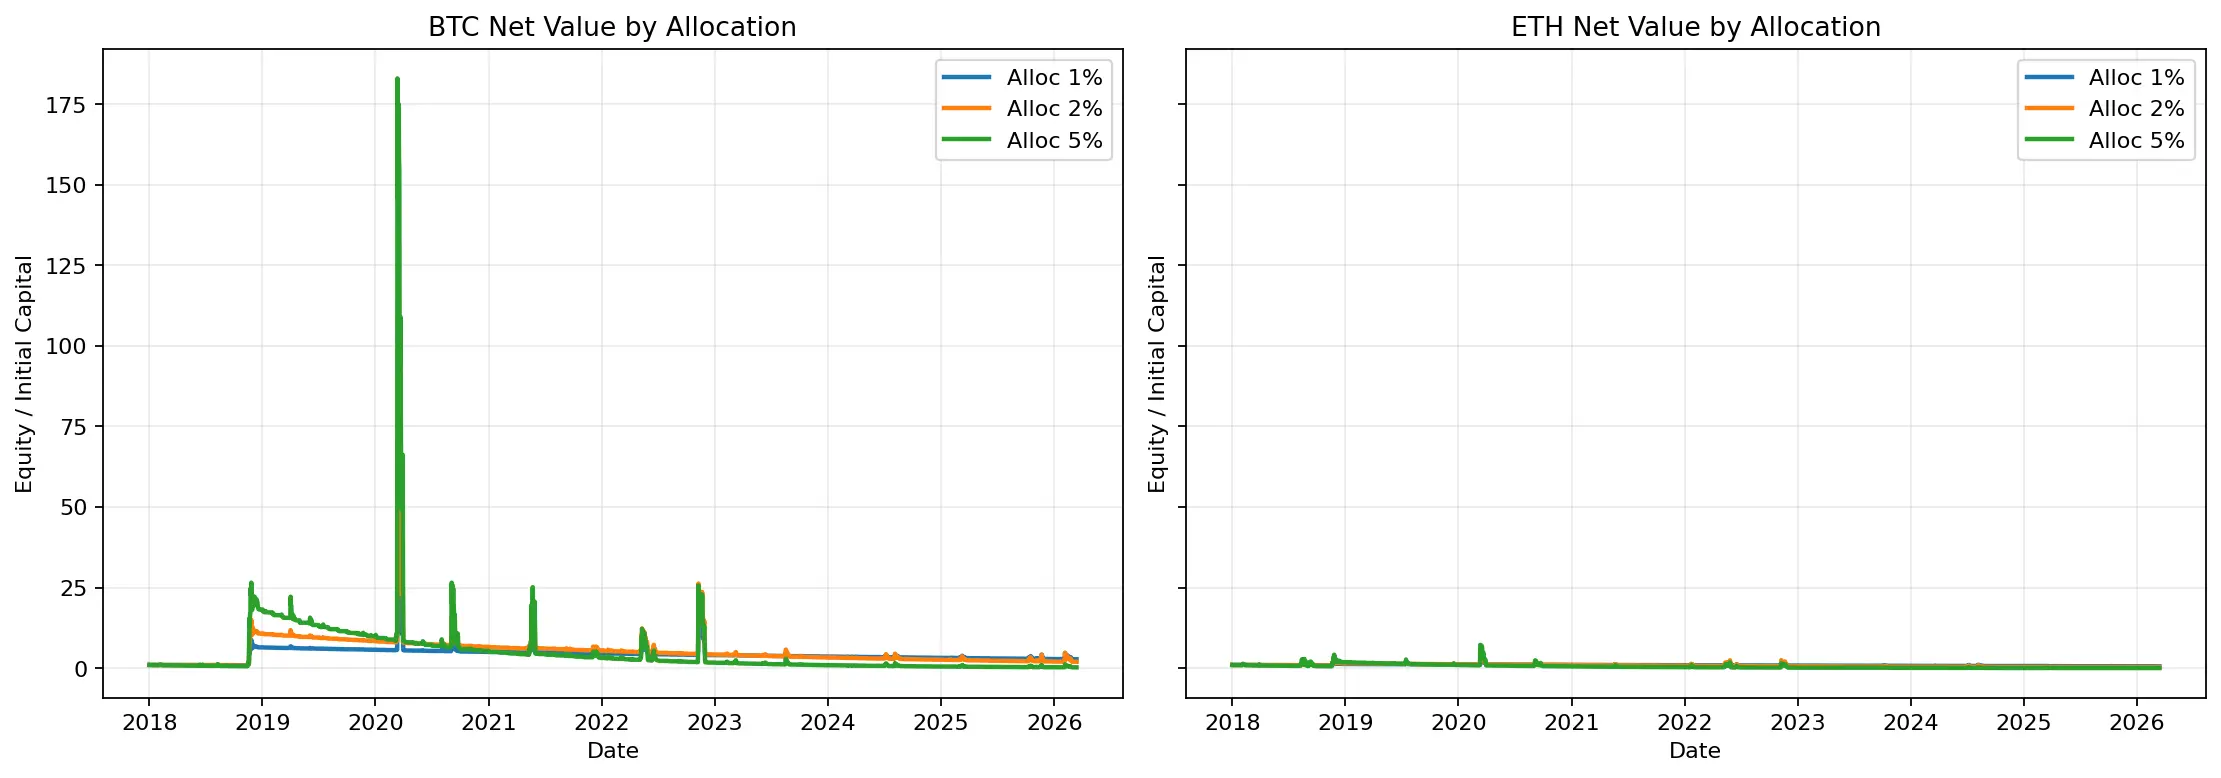
Figure 6: Net value curves for different deltas show that deeper deltas resemble classic tail insurance; slightly higher deltas offer a more balanced profile between returns and capital experience.
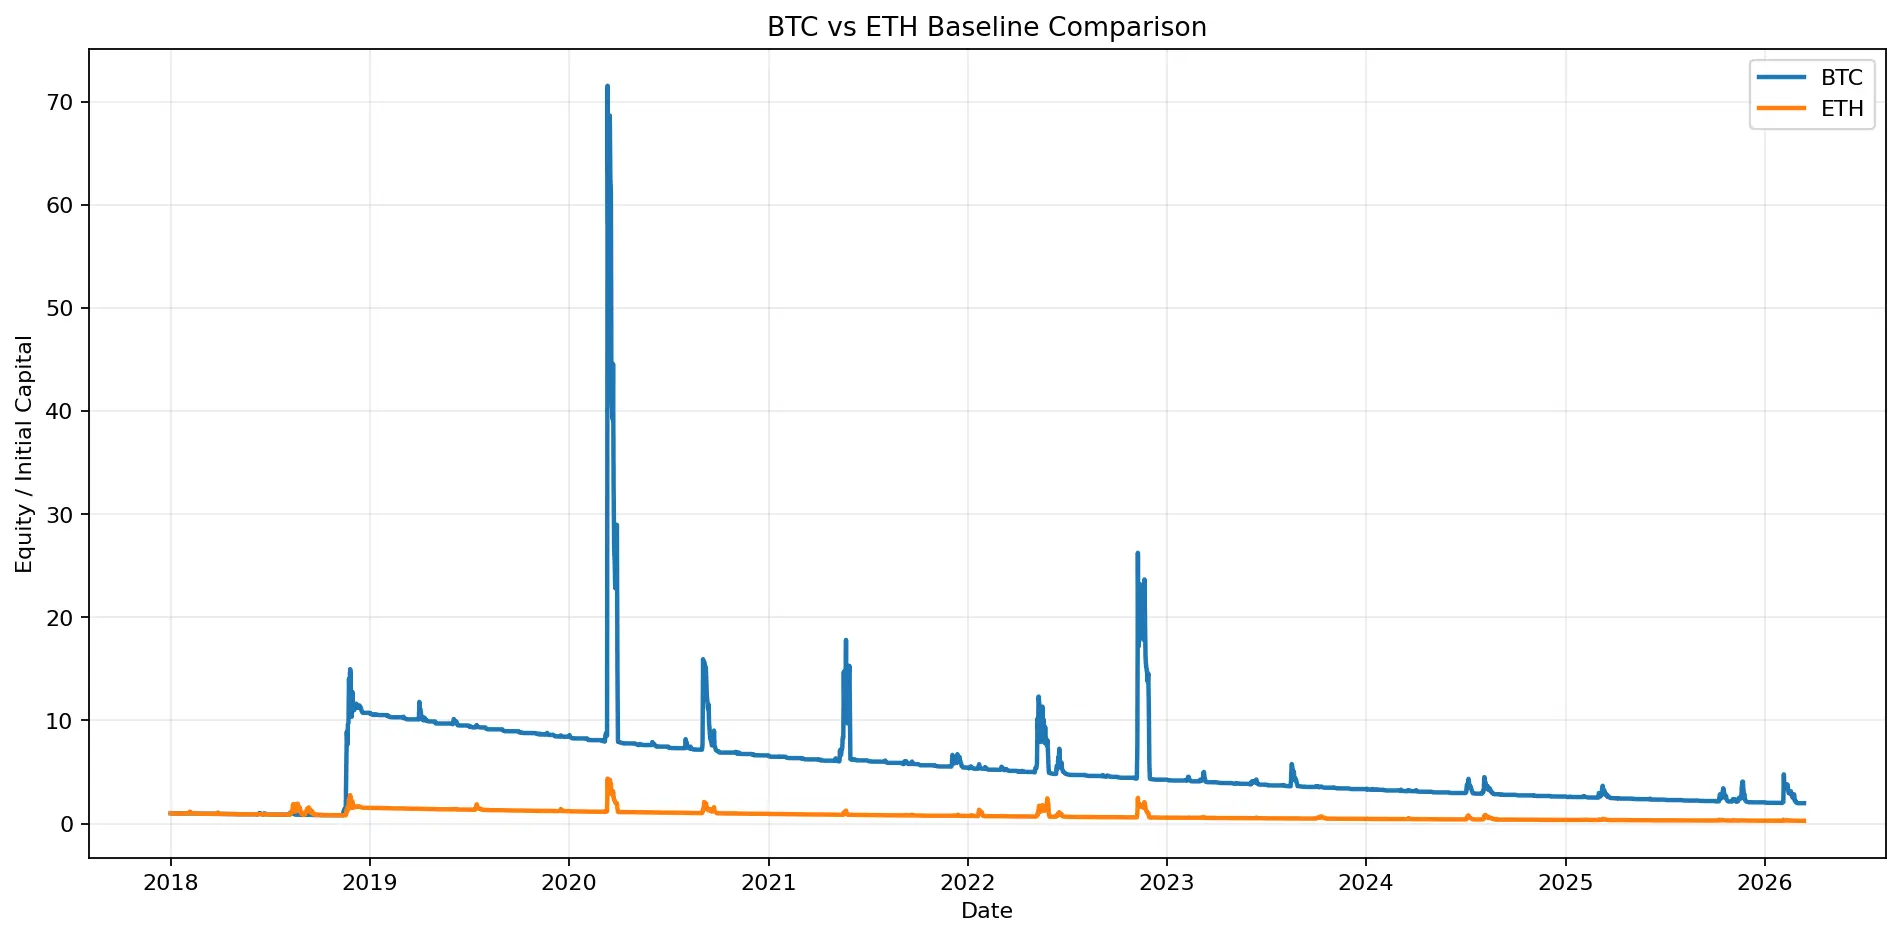
Figure 7: Comparing different investment ratios shows that position size significantly amplifies return elasticity but also increases long-term drawdowns and path risk.
Pros and Cons of the Strategy
This type of strategy has clear advantages. First, it’s simple, with fixed rules, not relying on subjective judgment. Second, it’s highly convex—if you hit an extreme event, gains can be enormous. Third, it’s fundamentally different from mainstream long-only approaches, more akin to risk coverage tools in asset allocation rather than directional trading.
But the downsides are equally harsh. First, long-term capital experience is poor—low win rate, long drawdowns, and multi-year losses are common. Second, it’s extremely sensitive to the “holding path”; even during market crashes, you may not hold the most profitable put. Third, although this backtest is quite strict, it’s still based on Black-Scholes and historical volatility proxies; real markets’ implied volatility skew, liquidity, fees, and slippage could further impact actual results.
Suitable Investors
This strategy is better suited for three types of investors: first, institutional funds using it as a portfolio hedge rather than a primary income source; second, disciplined investors who can tolerate years of apparent losses; third, those explicitly seeking convexity gains in extreme markets rather than daily high win rates.
It’s not suitable for investors expecting “stable profits” or with short-term performance reviews. As the backtest shows, even the BTC benchmark experienced a maximum drawdown of -97.24% and 57 consecutive losing months. Without strong capital resilience, this strategy is hard to hold.
Final Conclusion
If you buy a deep OTM put fixed each month starting from 2018, can you make money long-term? The answer from this backtest is: yes, but not universally. BTC’s benchmark achieved a 97.62% total return; ETH’s, under the same logic, lost 73.07%. This means it’s not a stable, cross-asset “money printer.”
Is it purely a tail-event-dependent strategy? The backtest suggests so. Its very low win rate, small percentage of profitable months, high skewness and kurtosis, and the outsized contribution of top trades all indicate it’s not a “steady worker” but rather a “pay premiums long, wait for a few destiny moments” approach.
A practical takeaway: BTC is more suitable than ETH for tail insurance; delta 0.02 offers a better overall risk-reward balance; and for those seeking more extreme convexity, delta 0.01 remains the most aggressive, resembling a true “black swan insurance.”
In the end, buying deep OTM puts long-term isn’t the most expensive or best strategy—it’s an expensive, sometimes irreplaceable tool. The real question isn’t “is it worth buying,” but whether you need this insurance and can withstand the long wait before the payout moment arrives.
