Trade
Basic
Futures
Futures
Hundreds of contracts settled in USDT or BTC
TradFi
Gold
Trade global traditional assets with USDT in one place
Options
Hot
Trade European-style vanilla options
Unified Account
Maximize your capital efficiency
Demo Trading
Futures Kickoff
Get prepared for your futures trading
Futures Events
Participate in events to win generous rewards
Demo Trading
Use virtual funds to experience risk-free trading
Earn
Launch
CandyDrop
Collect candies to earn airdrops
Launchpool
Quick staking, earn potential new tokens
HODLer Airdrop
Hold GT and get massive airdrops for free
Launchpad
Be early to the next big token project
Alpha Points
Trade on-chain assets and enjoy airdrop rewards!
Futures Points
Earn futures points and claim airdrop rewards
Investment
Simple Earn
Earn interests with idle tokens
Auto-Invest
Auto-invest on a regular basis
Dual Investment
Buy low and sell high to take profits from price fluctuations
Soft Staking
Earn rewards with flexible staking
Crypto Loan
0 Fees
Pledge one crypto to borrow another
Lending Center
One-stop lending hub
VIP Wealth Hub
Customized wealth management empowers your assets growth
Private Wealth Management
Customized asset management to grow your digital assets
Quant Fund
Top asset management team helps you profit without hassle
Staking
Stake cryptos to earn in PoS products
Smart Leverage
New
No forced liquidation before maturity, worry-free leveraged gains
GUSD Minting
Use USDT/USDC to mint GUSD for treasury-level yields
More
OddNotCoin
- Reward
- like
- Comment
- Repost
- Share
Gate Alpha Points System Upgrade: Tiered Airdrop + Lucky Prize Pool and Points Treasure Hunt Features Launch
View Original
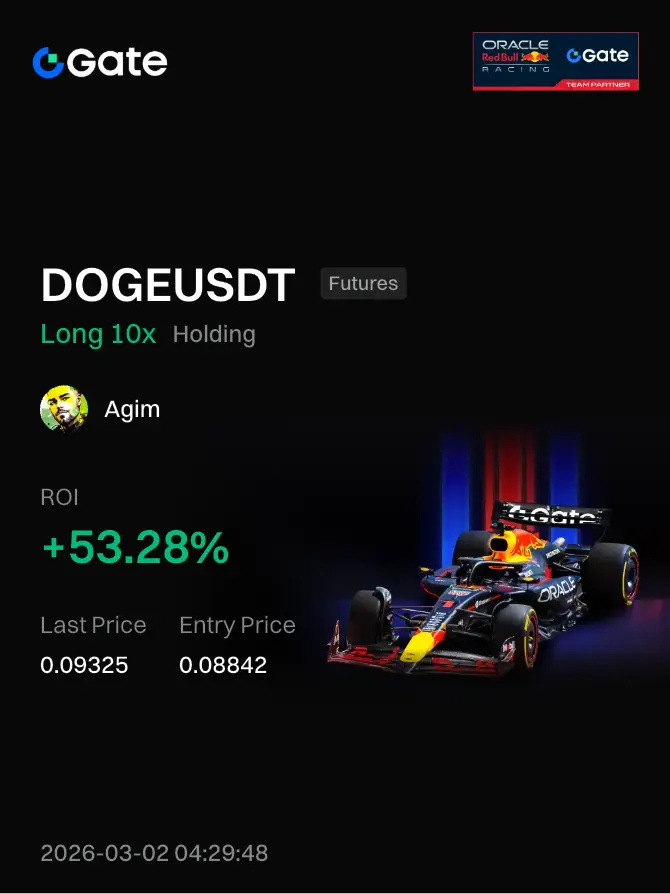
[The user has shared his/her trading data. Go to the App to view more.]
- Reward
- like
- Comment
- Repost
- Share
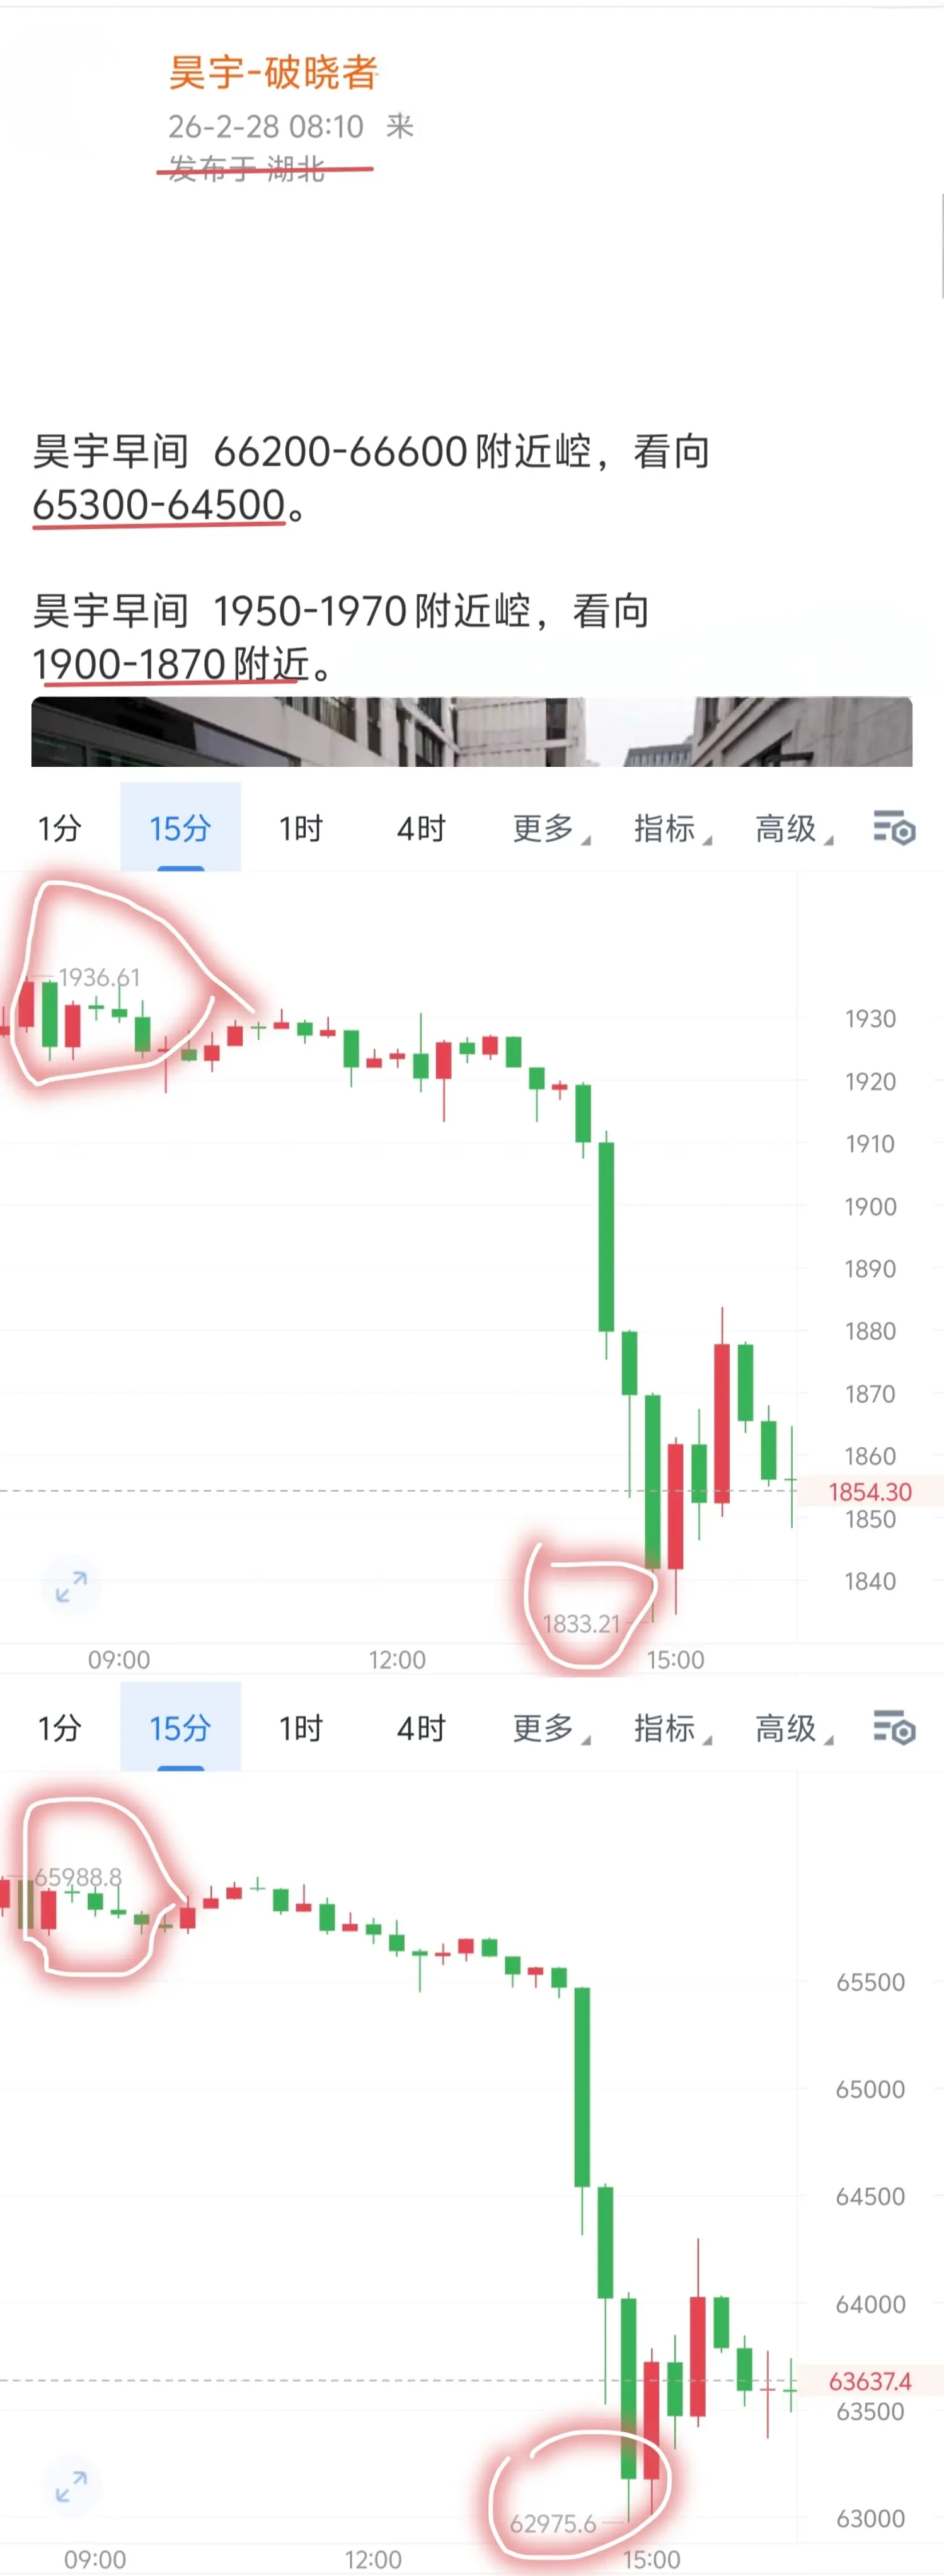
March 2nd BTC/ETH Market Strategy
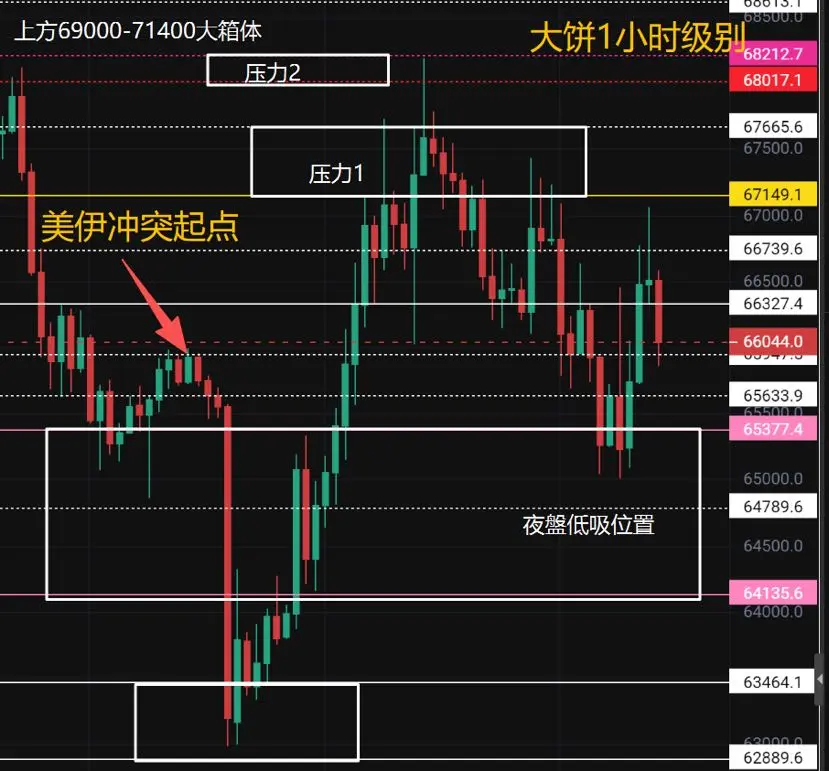
The low-entry point I mentioned in the early morning short article has paid off again. The strategy is clearly explained in both text and charts. The reasons why Bitcoin broke the waterline and the placement of the insertion points are discussed; if you're interested, you can check the previous article.
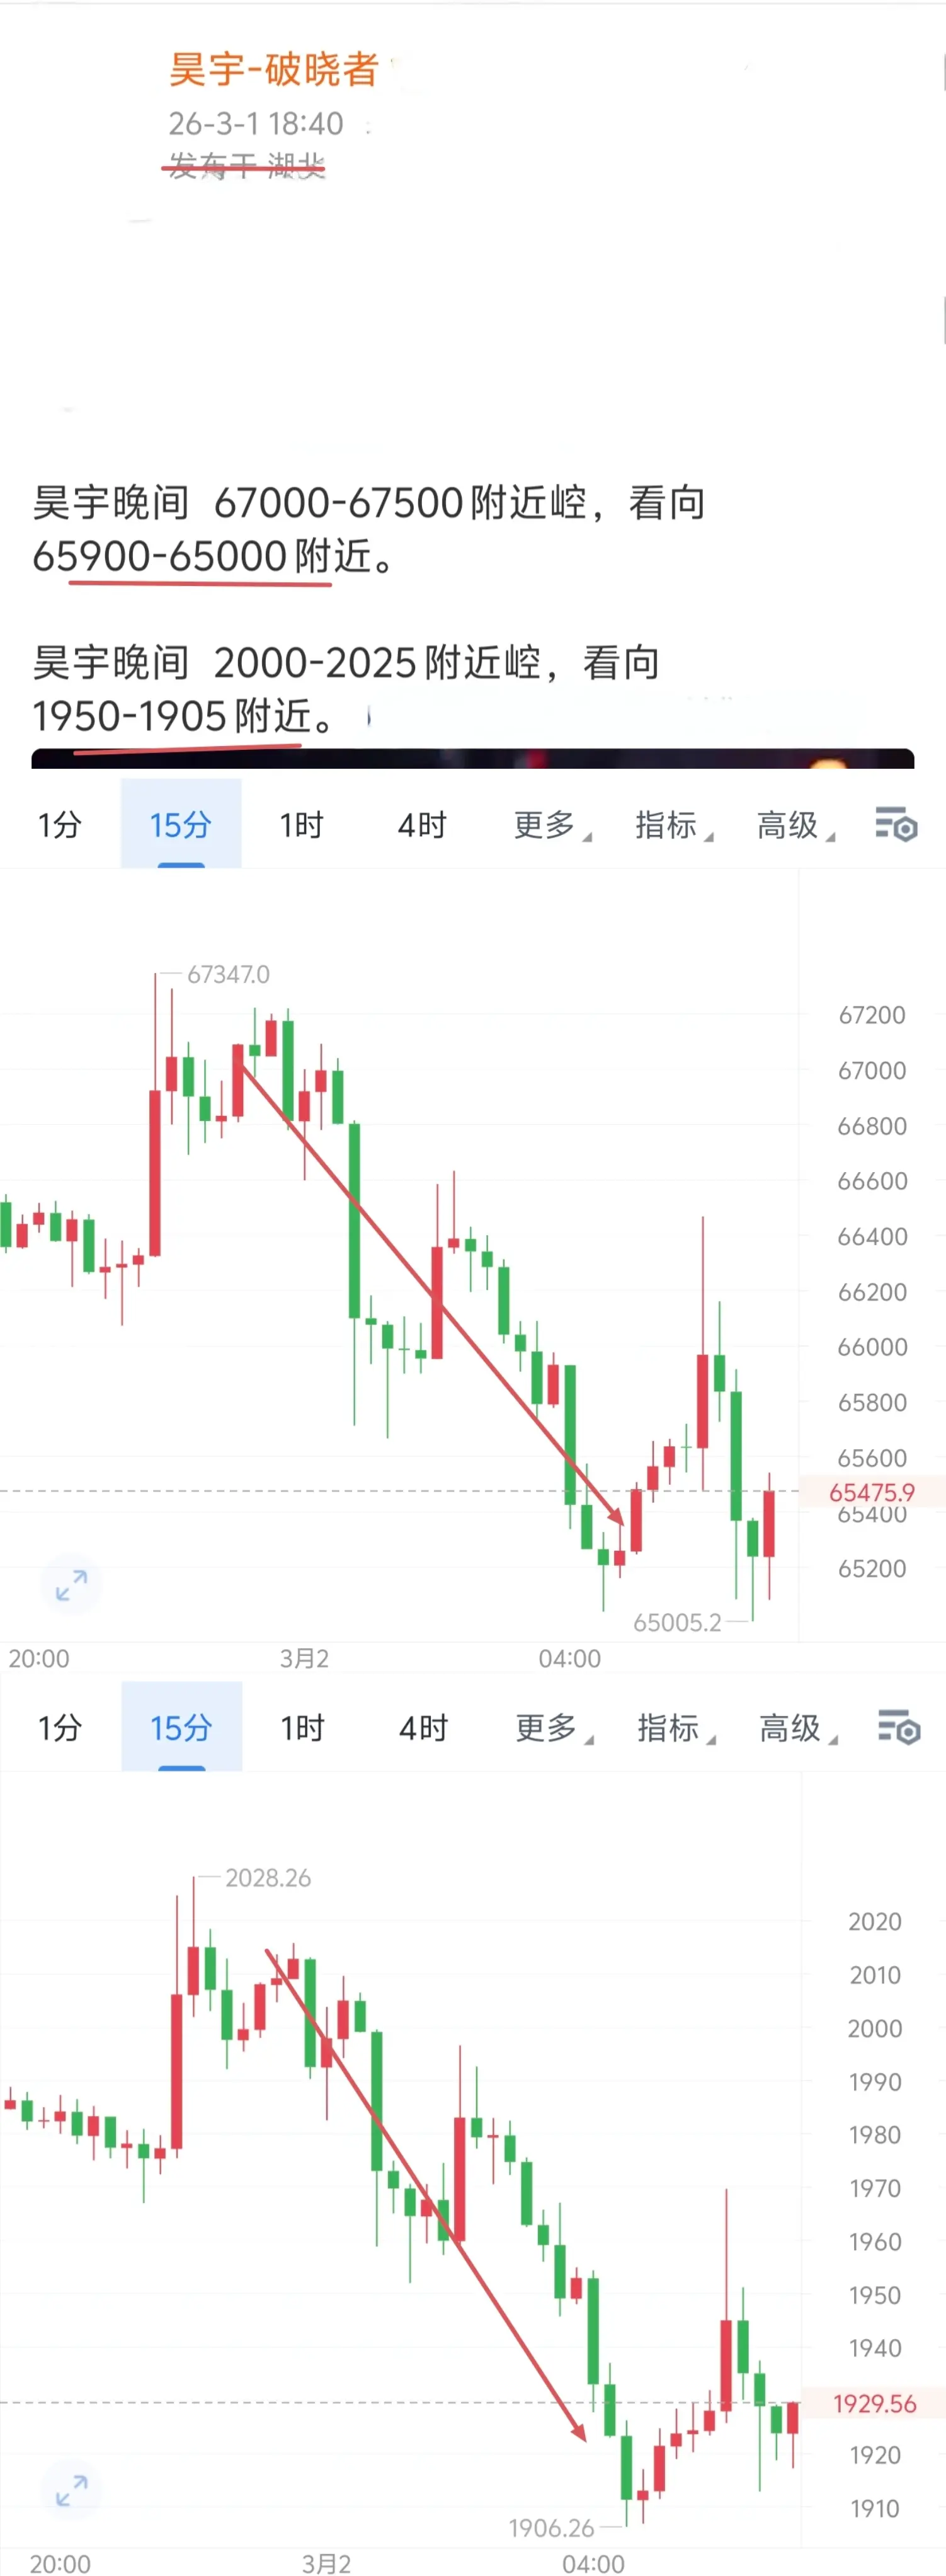
BTC: The first correction wave on March 1st reached the lower boundary of the 27th’s range at 68,000. After a normal pullback, it attempted a second rally but failed to break the key level at 67,150. It is currently testing the support zone indicated below. Wat
View OriginalThe low-entry point I mentioned in the early morning short article has paid off again. The strategy is clearly explained in both text and charts. The reasons why Bitcoin broke the waterline and the placement of the insertion points are discussed; if you're interested, you can check the previous article.
BTC: The first correction wave on March 1st reached the lower boundary of the 27th’s range at 68,000. After a normal pullback, it attempted a second rally but failed to break the key level at 67,150. It is currently testing the support zone indicated below. Wat
- Reward
- 1
- Comment
- Repost
- Share
DEA
DEA
Created By@DEA_DEA
Listing Progress
0.00%
MC:
$2.37K
More Tokens
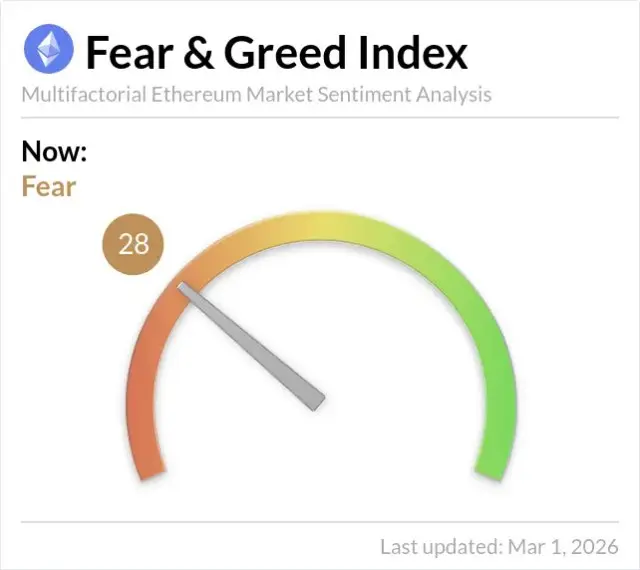
JUST IN: The Fear and Greed Index is at 28 today, indicating persistent selling pressure.
- Reward
- like
- Comment
- Repost
- Share
🚨 JUST IN: Iran is making fresh attempts to restart negotiations with the United States, according to a report from the Wall Street Journal.
#Iran #US #NuclearTalks #WSJ #Diplomacy #BreakingNews #MiddleEast
#Iran #US #NuclearTalks #WSJ #Diplomacy #BreakingNews #MiddleEast

- Reward
- like
- Comment
- Repost
- Share
- Reward
- like
- Comment
- Repost
- Share
Bitcoin and Ethereum's weekend performances successfully delivered two grand feasts. Achieved over 3500 + 180 stores.
Every step you take is a silent declaration: there's no need to rush to prove yourself, let the results come as naturally as the changing seasons. Because true brilliance never needs the approval of spotlights!
#BTC #ETH
View OriginalEvery step you take is a silent declaration: there's no need to rush to prove yourself, let the results come as naturally as the changing seasons. Because true brilliance never needs the approval of spotlights!
#BTC #ETH
- Reward
- like
- Comment
- Repost
- Share
#BuyTheDipOrWaitNow?
very good 😊😊 you have a great time to do it now and see you later on this weekend or so but I don't think I'm going on the phone and
very good 😊😊 you have a great time to do it now and see you later on this weekend or so but I don't think I'm going on the phone and


- Reward
- like
- Comment
- Repost
- Share
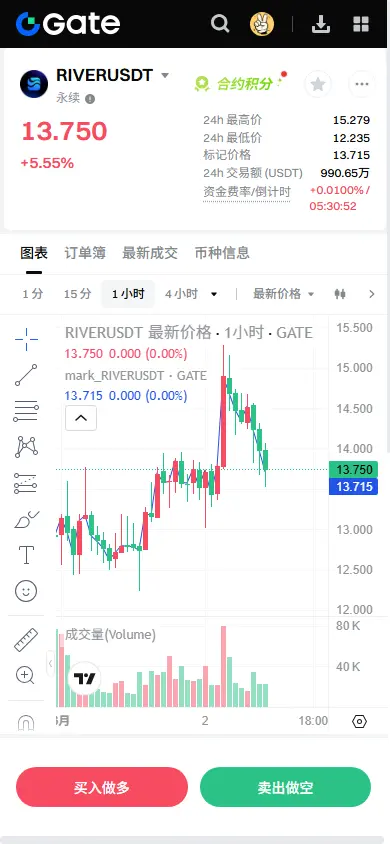
【$RIVER Signal】Pullback to add longs + 1H level retest confirmation
$RIVER The 1H level is oscillating above a critical support zone (13.55-13.62), which is a healthy retracement of yesterday’s 4H big bullish candle. The 4H level has stabilized above the EMA20 (12.59), indicating a mid-term trend has shifted from bearish to bullish. Currently, the 1H RSI (49.45) is in the neutral zone, building momentum for another rally. The order book depth is imbalanced at -2.60%, with slightly more selling pressure, but buy orders are accumulating below (13.61-13.63), showing clear main force support. Open
View Original$RIVER The 1H level is oscillating above a critical support zone (13.55-13.62), which is a healthy retracement of yesterday’s 4H big bullish candle. The 4H level has stabilized above the EMA20 (12.59), indicating a mid-term trend has shifted from bearish to bullish. Currently, the 1H RSI (49.45) is in the neutral zone, building momentum for another rally. The order book depth is imbalanced at -2.60%, with slightly more selling pressure, but buy orders are accumulating below (13.61-13.63), showing clear main force support. Open
- Reward
- like
- 1
- Repost
- Share
GateUser-375c9c99:
Good luck and prosperity 🧧#JaneStreet10AMSellOff is trending after market participants observed an unusually large block sale executed around 10:00 AM (UTC) by trading desk firms linked to Jane Street. The transaction, executed across multiple exchanges and asset pairs, triggered a sharp repricing in both spot and derivatives markets — particularly in major cryptocurrencies like Bitcoin and Ethereum.
What Happened
At approximately 10:00 AM, a series of coordinated sell orders hit major order books, absorbing significant bid liquidity and causing rapid price declines. Traders later identified that the selling cadence, s
What Happened
At approximately 10:00 AM, a series of coordinated sell orders hit major order books, absorbing significant bid liquidity and causing rapid price declines. Traders later identified that the selling cadence, s

- Reward
- 1
- 1
- Repost
- Share
Yunna:
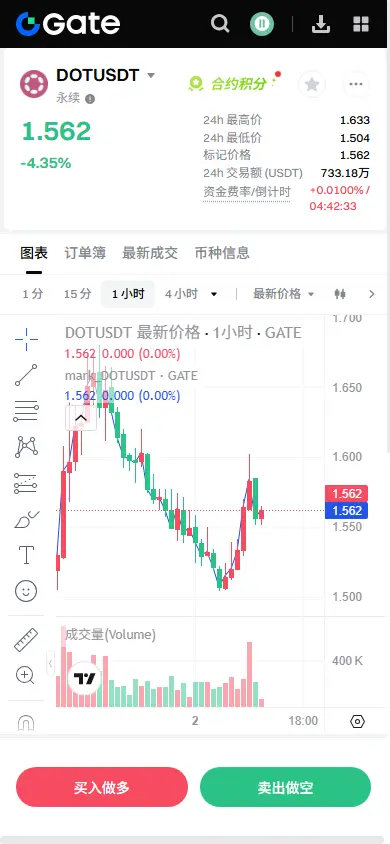
To The Moon 🌕【$DOT Signal】Pullback to Long + 1H level retest confirmation, clear signs of main force defending the market
$DOT After experiencing a rebound, the 1H level is retesting the EMA20 (1.5525) and the dense trading zone. The current price of 1.56 is right at the upper end of the suggested entry zone. Although the 4H level is in consolidation, the 1H buy-side depth (bid_ask_ratio_depth: 1.14) is significantly better than the sell side, and open interest remains stable. The price decline has not triggered a panic exit, indicating that the main force is defending rather than distributing. In a nega
View Original$DOT After experiencing a rebound, the 1H level is retesting the EMA20 (1.5525) and the dense trading zone. The current price of 1.56 is right at the upper end of the suggested entry zone. Although the 4H level is in consolidation, the 1H buy-side depth (bid_ask_ratio_depth: 1.14) is significantly better than the sell side, and open interest remains stable. The price decline has not triggered a panic exit, indicating that the main force is defending rather than distributing. In a nega
- Reward
- like
- Comment
- Repost
- Share
™dYANYU
烟雨老师
Created By@TeacherYanyu
Subscription Progress
0.00%
MC:
$0
More Tokens
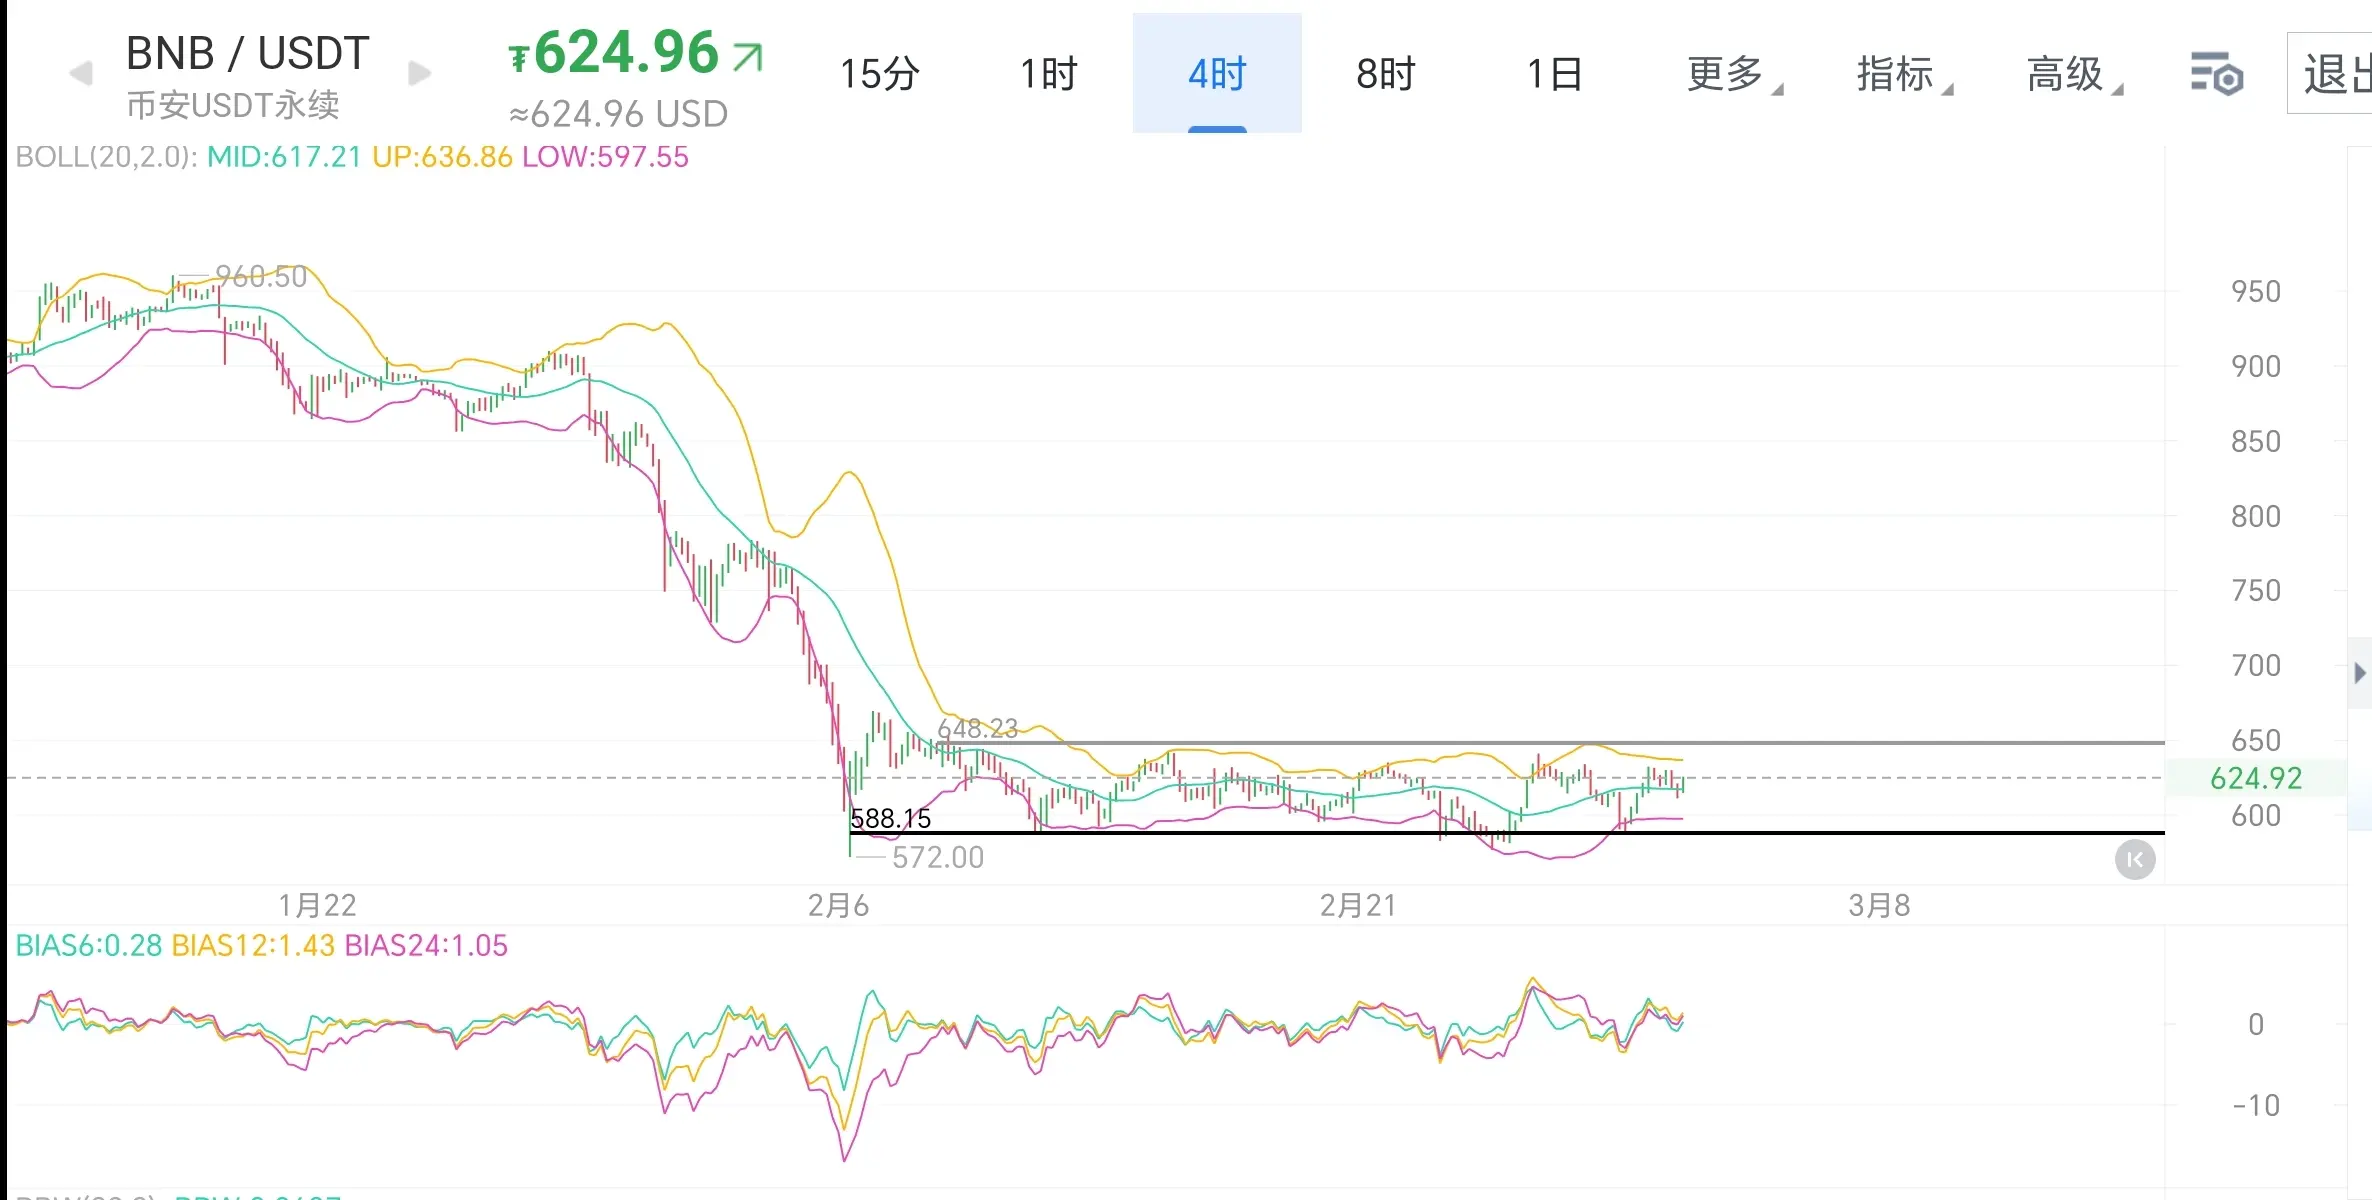
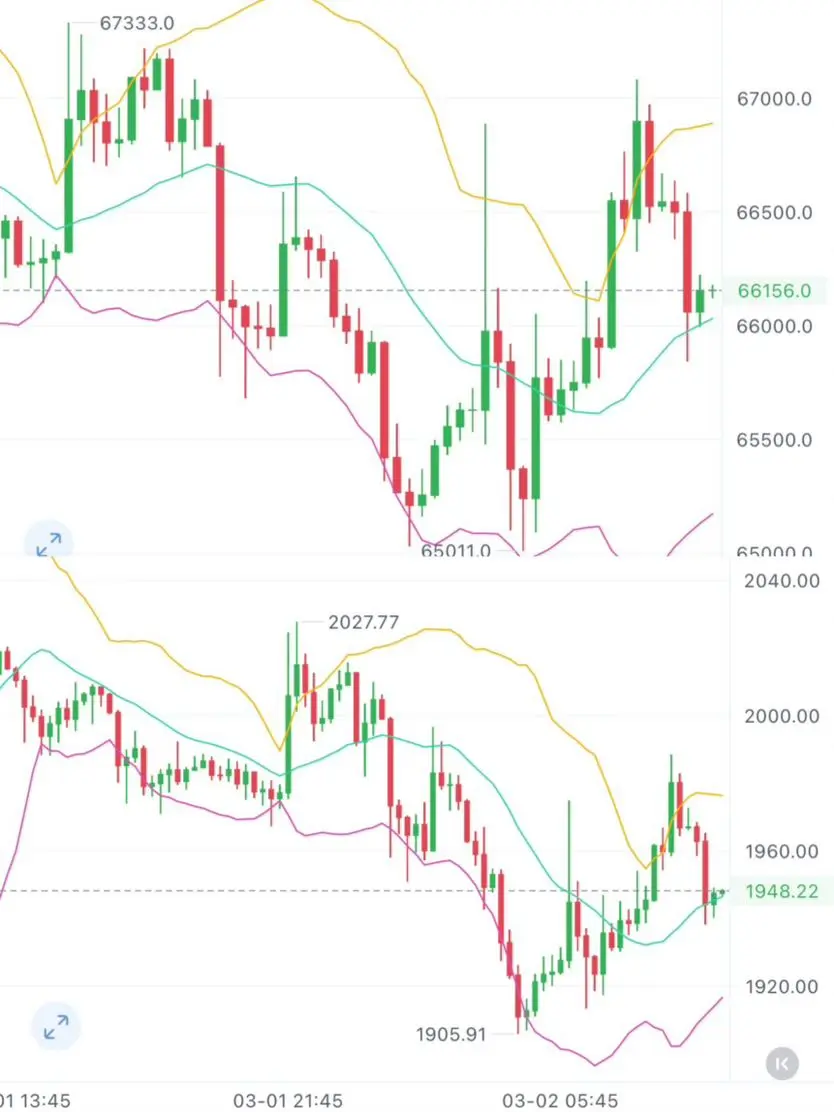
March 2 Cryptocurrency Market Analysis & Strategy
📉 BTC Bitcoin:
After bottoming out near 65,000 in the short term, it has rebounded strongly and is currently trading above the middle band of the Bollinger Bands. 66,800 is a key short-term resistance level; a breakout may test the 67,300 range. If it falls back and breaks below 65,800, it will test the 65,000 support level.
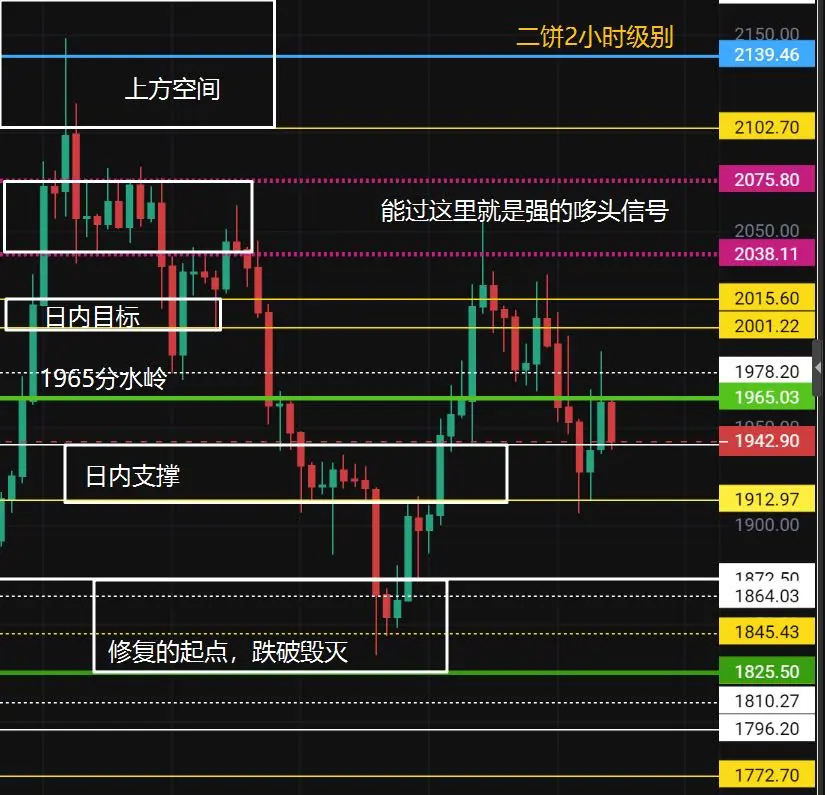
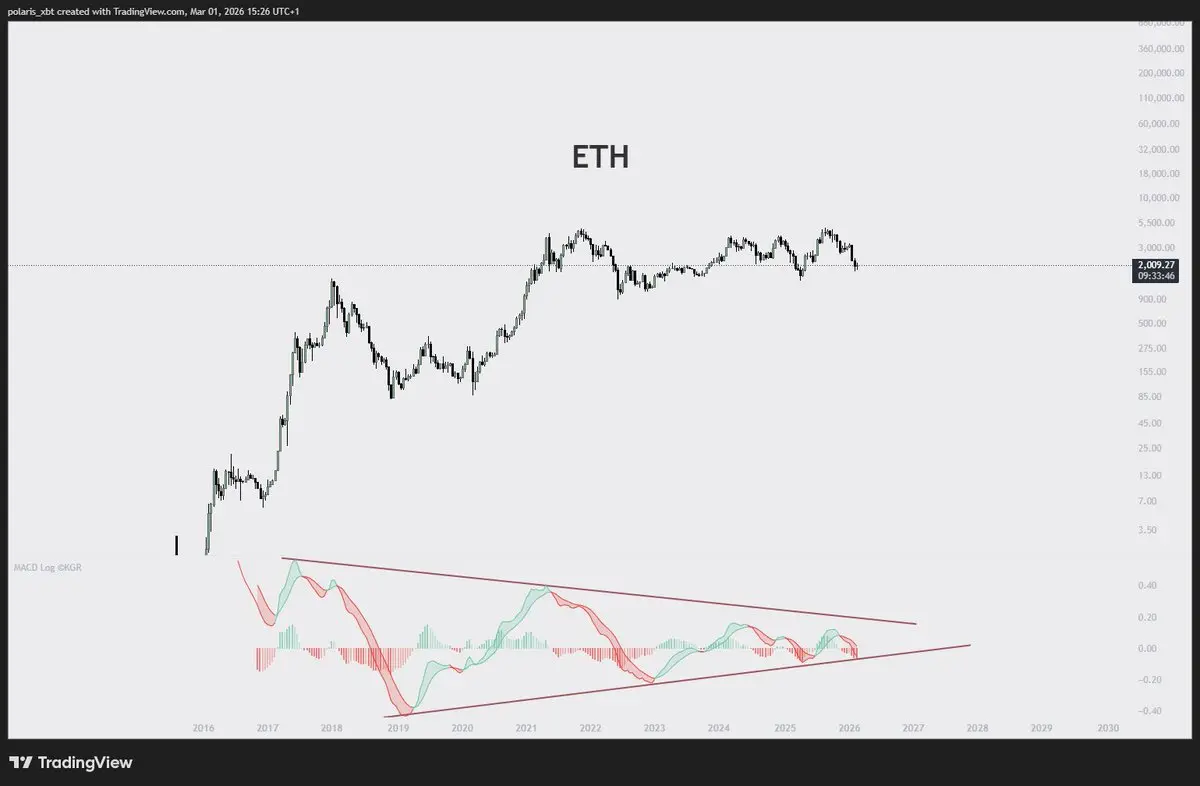
⚡ ETH Ethereum:
Rebounding in tandem with the market, with 1,950 as the core resistance level. Holding above this level may test 1,980; if it falls below 1,920, the short-term trend will weaken again, and it may test the 1
View Original📉 BTC Bitcoin:
After bottoming out near 65,000 in the short term, it has rebounded strongly and is currently trading above the middle band of the Bollinger Bands. 66,800 is a key short-term resistance level; a breakout may test the 67,300 range. If it falls back and breaks below 65,800, it will test the 65,000 support level.
⚡ ETH Ethereum:
Rebounding in tandem with the market, with 1,950 as the core resistance level. Holding above this level may test 1,980; if it falls below 1,920, the short-term trend will weaken again, and it may test the 1
- Reward
- like
- Comment
- Repost
- Share
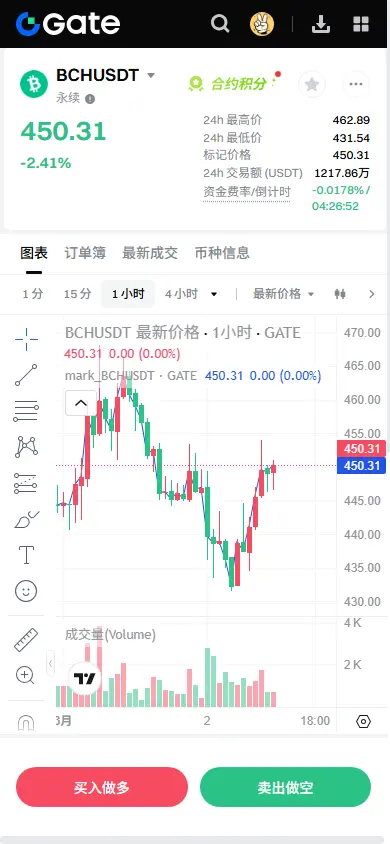
【$BCH Signal】1H breakout and pullback, main force supports the market, targeting a rebound
$BCH The 1H timeframe experienced a decline in the early session but found support around $440 and rebounded strongly. It has now stabilized above the 1H EMA20 ($445.35), forming a V-shaped reversal pattern. Although the 4H timeframe is still in a downtrend, the latest 4H candlestick closed with a long lower shadow, indicating strong buying pressure below. Combined with negative funding rates and stable open interest (OI), this appears more like a bull trap rather than main force distribution. The 1H mom
View Original$BCH The 1H timeframe experienced a decline in the early session but found support around $440 and rebounded strongly. It has now stabilized above the 1H EMA20 ($445.35), forming a V-shaped reversal pattern. Although the 4H timeframe is still in a downtrend, the latest 4H candlestick closed with a long lower shadow, indicating strong buying pressure below. Combined with negative funding rates and stable open interest (OI), this appears more like a bull trap rather than main force distribution. The 1H mom
- Reward
- like
- Comment
- Repost
- Share
#USIsraelStrikesIranBTCPlunges
Dear friends, on these hours Bitcoin price approximately same so in my opinion as I said before tonight will be the key 🔑 and very important, when American market opens we get some hints about where crypto market going !
Dear friends, on these hours Bitcoin price approximately same so in my opinion as I said before tonight will be the key 🔑 and very important, when American market opens we get some hints about where crypto market going !
BTC-1,2%

- Reward
- 3
- 2
- Repost
- Share
HighAmbition :
:
thanks for sharing information with usView More
#BuyTheDipOrWaitNow? March 2, 2026 — Bitcoin’s Quiet Power Plays: Fear, Opportunity, and Positioning
Bitcoin’s recent moves were not just volatility — they were a test of patience, nerves, and strategy.
Last week’s geopolitical flash crash sent price to $63,000 in mere hours. Panic sold. Margin calls exploded. News feeds screamed doom. Everyone who reacted emotionally lost. And that is exactly the point — the market rewards discipline, not emotion.
Now, BTC sits at ~$66,400, hovering just above critical support. At first glance, it might seem like a simple bounce. But history tells us: quiet z
BTC-1,2%

- Reward
- 2
- 4
- Repost
- Share
Yunna:
2026 GOGOGO 👊View More
- Reward
- like
- Comment
- Repost
- Share
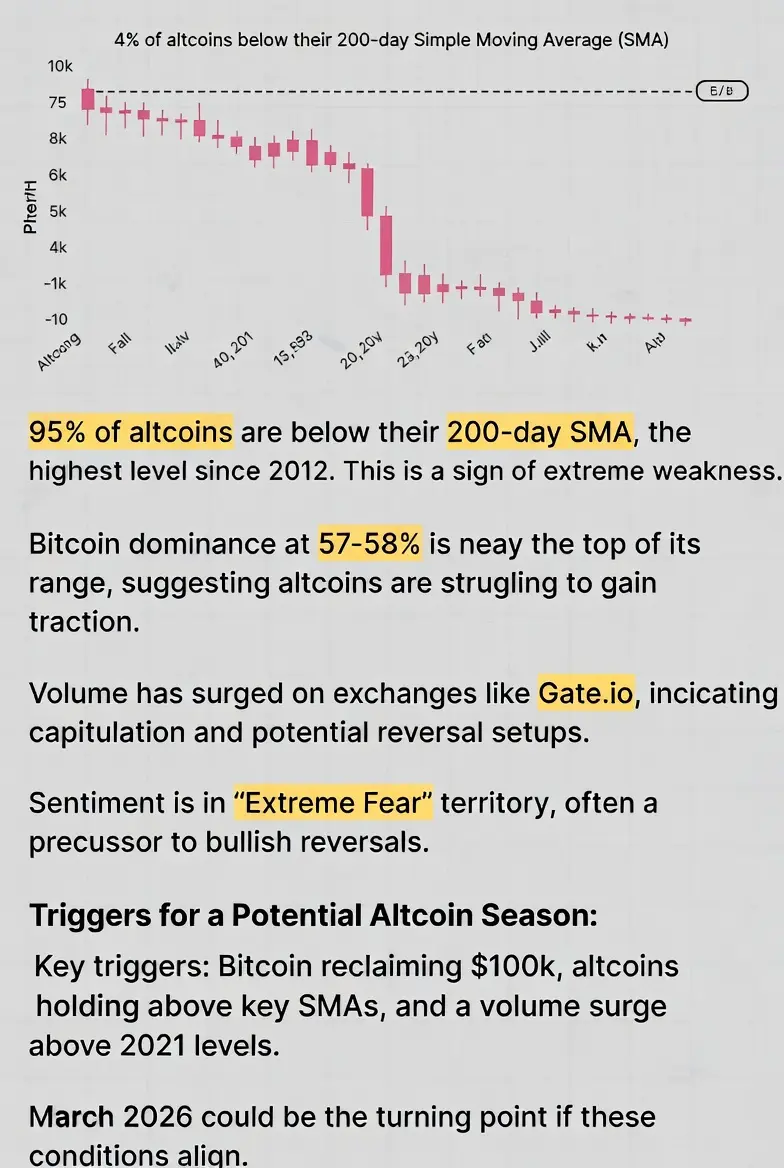
#95%ofAltsBelow200-daySMAWhen
95% of altcoins are trading below their 200-day Simple Moving Average (SMA), it signals one of the most extreme bearish conditions in the crypto market. Historically, this kind of setup has often marked periods of deep capitulation — but also major opportunity.
The 200-day SMA is widely considered a long-term trend indicator. When prices trade above it, assets are generally in a macro uptrend. When they fall below it, it suggests prolonged weakness and reduced investor confidence. Seeing nearly all altcoins under this level indicates broad market pressure, not ju
- Reward
- like
- Comment
- Repost
- Share
Load More
Join 40M users in our growing community
⚡️ Join 40M users in the crypto craze discussion
💬 Engage with your favorite top creators
👍 See what interests you
Trending Topics
View More10.13K Popularity
42.59M Popularity
154.98K Popularity
10.19K Popularity
534.16K Popularity
Hot Gate Fun
View More- MC:$0.1Holders:10.00%
- MC:$2.37KHolders:10.00%
- MC:$0.1Holders:10.00%
- MC:$2.38KHolders:10.00%
- MC:$2.43KHolders:20.14%
News
View MoreBTC Breaks Through 67,000 USDT
9 m
Uniswap Founder: The Financial System Must Always Remain Operational and Accessible
21 m
Analysis: Bitcoin technical indicators show a death cross, previously warning of the "final market decline" in earlier cycles.
23 m
KNC (Kyber Network Crystal v2) up 17.99% in the last 24 hours
26 m
Traditional Finance Alert: VIX Increased by Over 4.5%
28 m
Pin