The weekend is ending the weekend on a bullish sentiment as shown by the global market cap which has recorded a 1.67% increase in the last 24 hours to take the total market cap to 1.64T as of press time. The trading volume has however dropped by 38% over the same period.
Bitcoin Price Analysis
The crypto king has taken center stage as bulls now dominate with the Bitcoin price standing at $42.5K as of press time representing a 1.5% pump over the last 24 hours. The trading volume has dropped by 44.5% within the same period to $13.9B as of press time.
An in-depth analysis of 24-hour BTC/USD charts shows that bulls are now gaining control of the BTC markets. This is seen as the Bitcoin price now moves above the 20-period MA, the Bollinger Band orange line, which typically is a bullish signal. The Relative Strength Index indicator, (RSI), is also moving north as it crosses above 50 backing the bullish prospects.
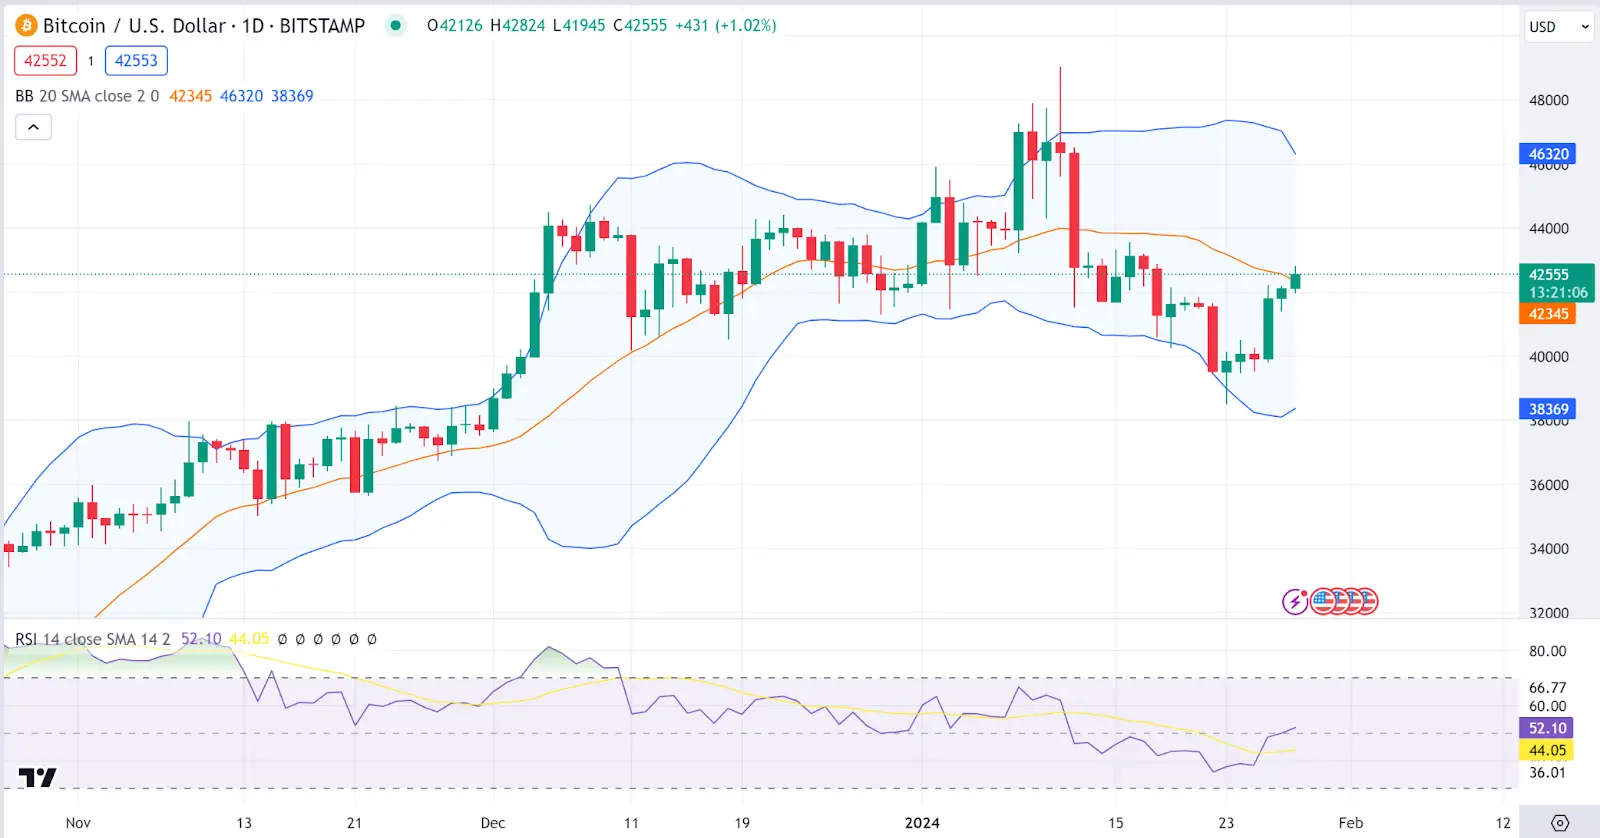 BTC 1-day chart | Source: TradingView## Ethereum Price Analysis
Ethereum is also ending the week strong with the Ethereum price standing at $2292 as of press time representing a 1.1% pump over the last 24 hours. The trading volume has dropped by 33% within the same period to $5.9B as of press time.
Looking at an in-depth analysis of 24-hour ETH/USD charts, we see that bulls have control of Ethereum markets as seen from the Awesome Oscillator, an indicator used in gauging trends, which is currently reverting from the negative region towards the zero line with a green histogram, suggesting fading bearishness on ETH. The RSI is also on a northern trajectory suggesting bullish momentum on the Ethereum price.
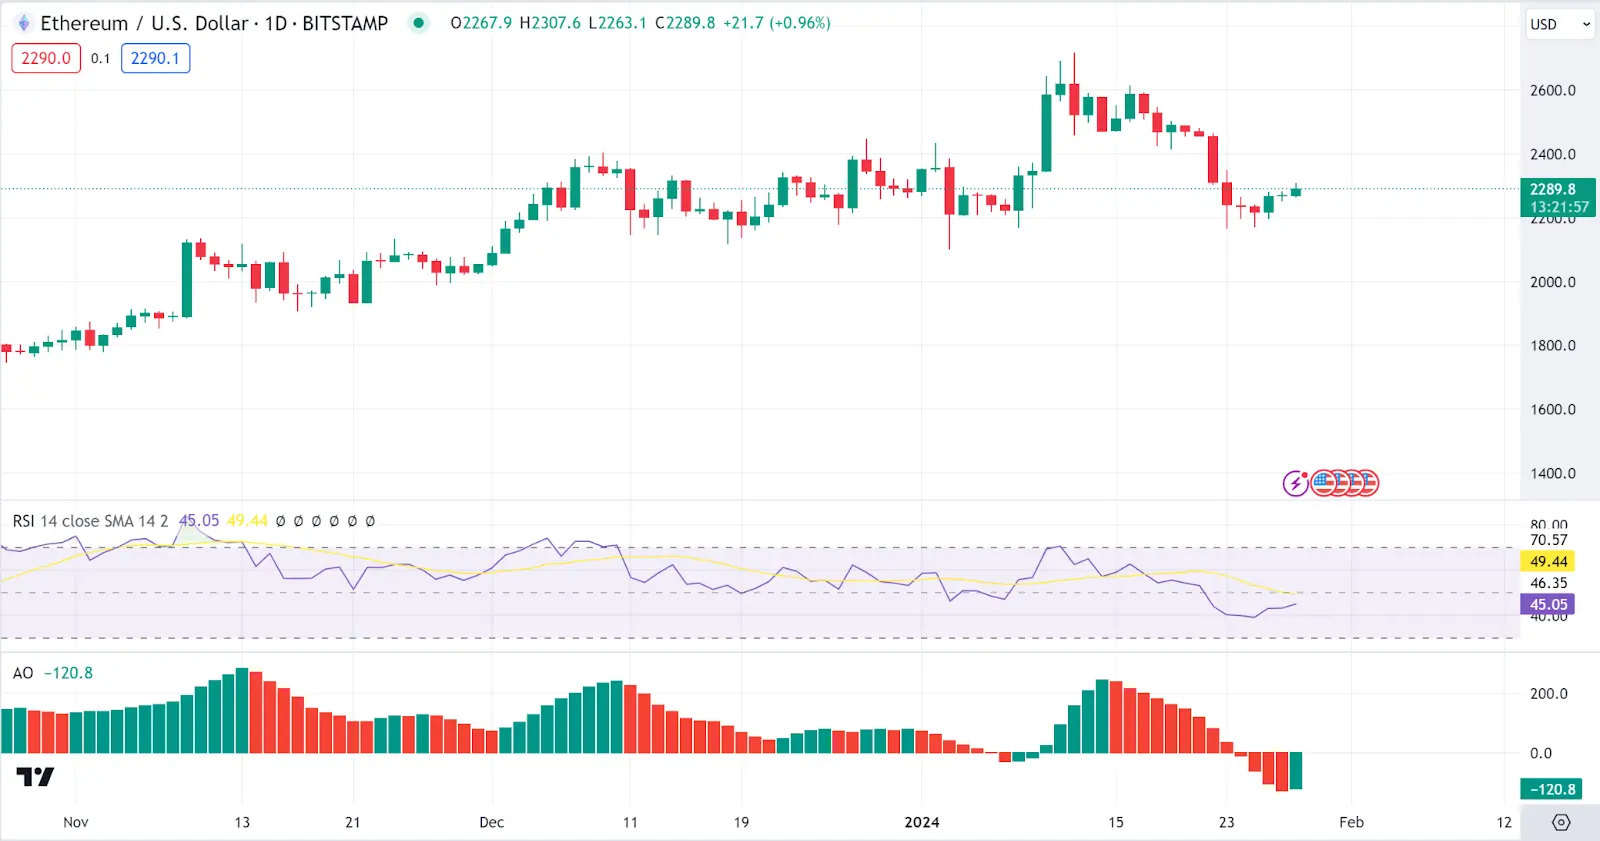 ETH 1-day chart | Source: TradingView## Solana Price Analysis
Siolana is also ending the week strong with the Solana price standing at $97.8 as of press time representing a 7% pump over the last 24 hours. The trading volume has dropped by 19% within the same period to $1.6B as of press time.
Looking at an in-depth analysis of 24-hour SOL/USDT charts, we see that bulls have control of Solana markets as seen from the RSI which is currently moving north, suggesting bullishness on Solana. However, the Average Directional Index is moving south suggesting a weak bull trend.
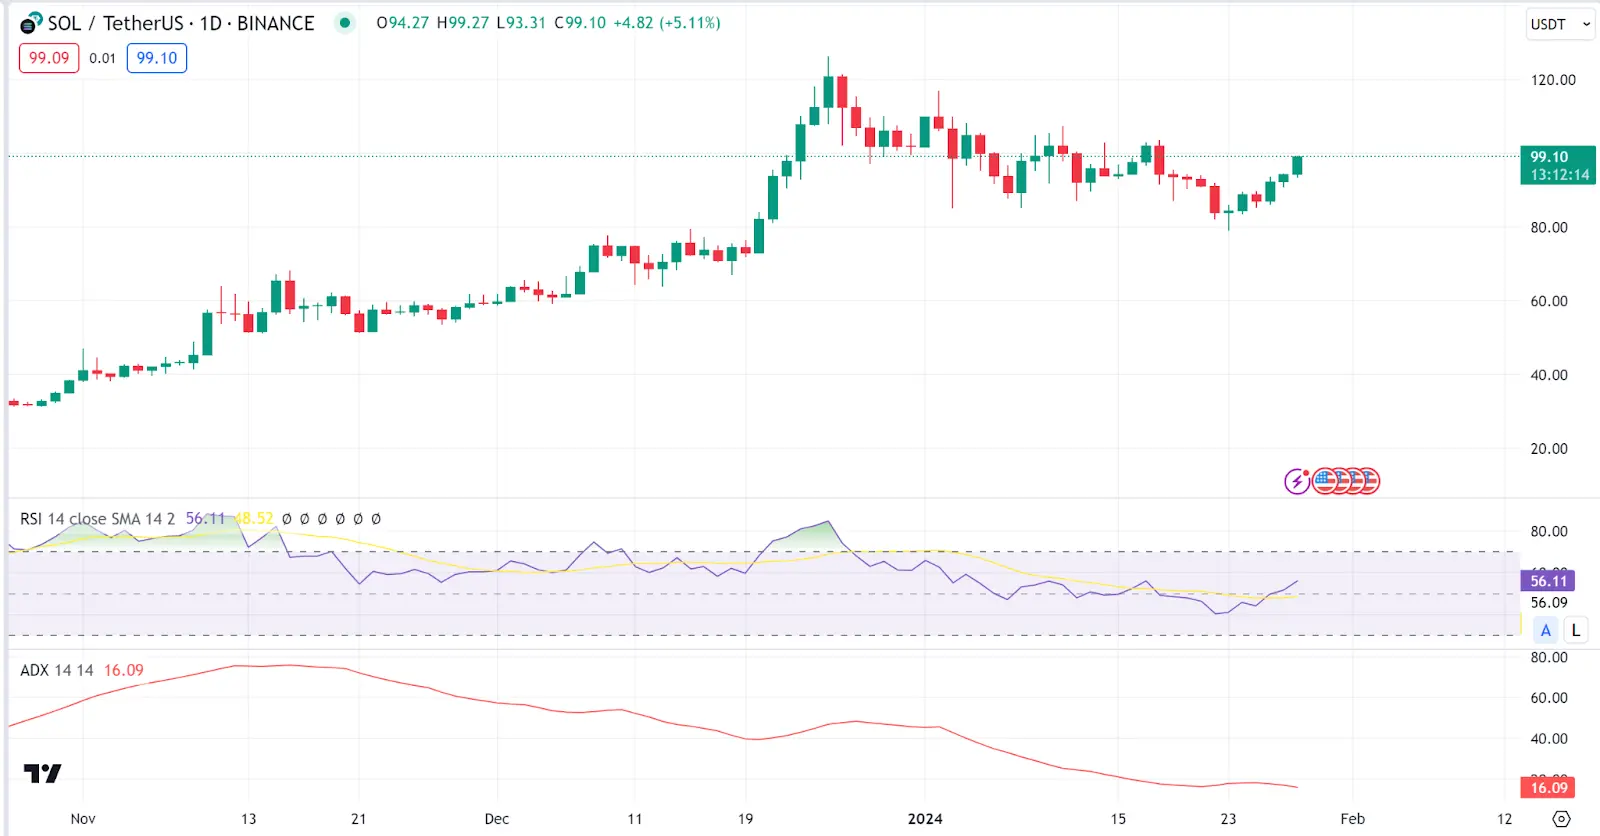 SOL 1-day chart | Source: TradingView## Avalanche Price Analysis
Avalanche is another gainer today as the Avalanche price stands at $36.31 as of press time 12% pump over the last 24 hours. The trading volume has jumped by 21% within the same period to $740M as of press time.
Looking at an in-depth analysis of 24-hour AVAX/USD charts, we see that bulls have control of Avalanche markets as seen from the Awesome Oscillator, an indicator used in gauging trends, which is currently reverting from the negative region towards the zero line with a green histogram, suggesting fading bearishness on AVAX. The RSI is also on a northern trajectory suggesting bullish momentum on the Avalanche price.
 AVAX 1-day chart | Source: TradingView## Polygon Price Analysis
Polygon (MATIC) is our last gainer today with the Polygon price standing at $0.808 as of press time representing a 5.8% pump over the last 24 hours. The trading volume has jumped by 13% within the same period to $263M as of press time.
An in-depth analysis of 24-hour MATIC/USDT charts shows that bulls are now gaining control of the MATIC markets. This is seen as the Polygon price now moves above the 20-period MA, the Bollinger Band orange line, which stands as a bullish signal. The Relative Strength Index indicator, (RSI), is also moving north as it approaches 50, backing the bullish prospects on the polygon price.
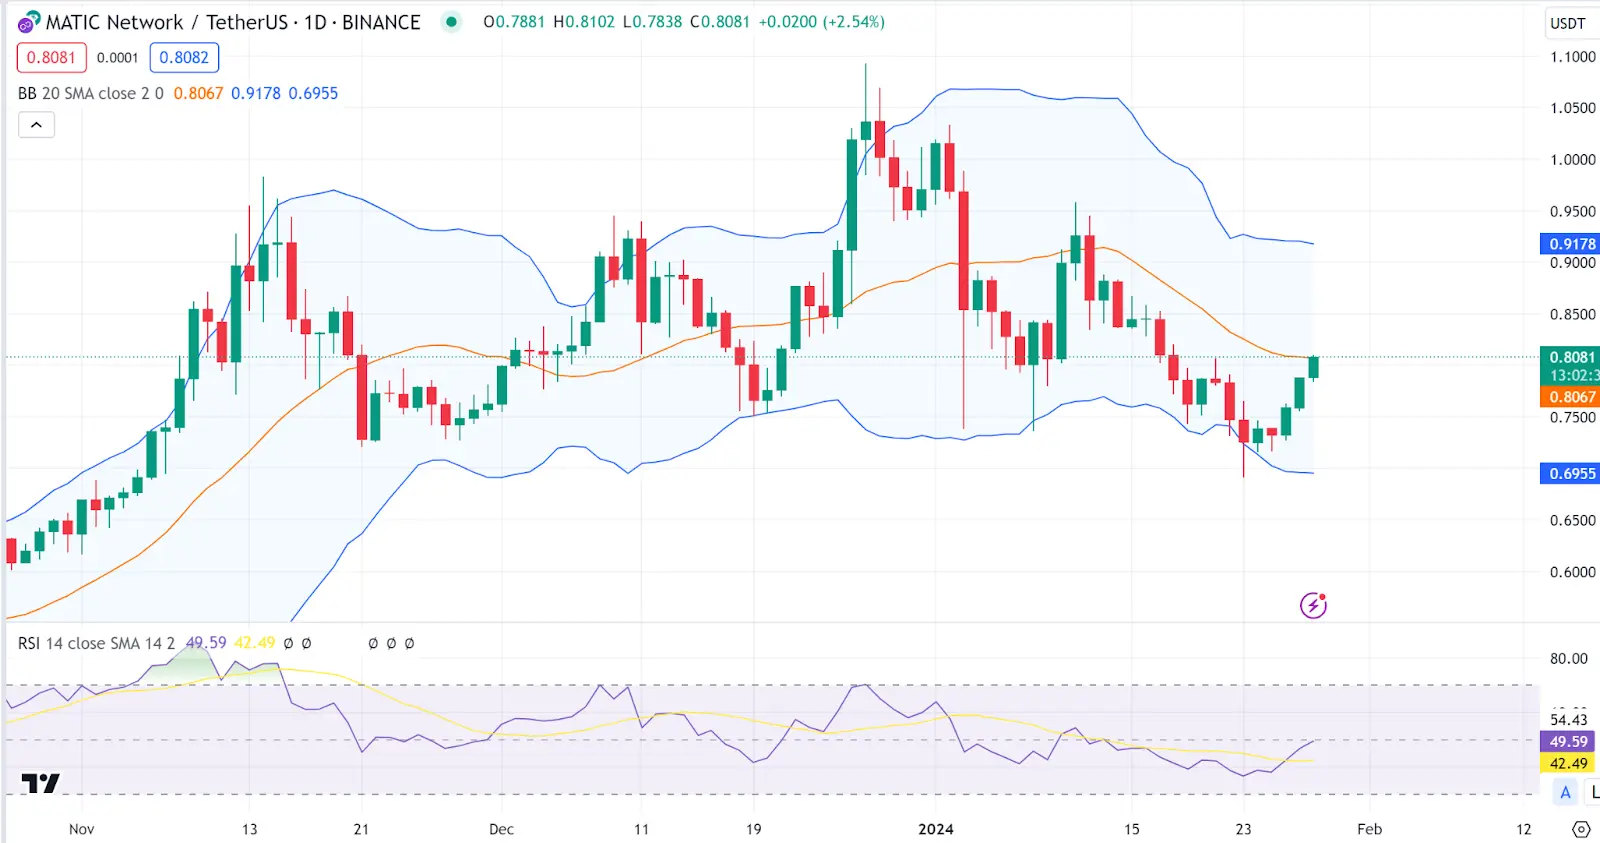 MATIC 1-day chart | Source: TradingView
Disclaimer: The information on this page may come from third parties and does not represent the views or opinions of Gate. The content displayed on this page is for reference only and does not constitute any financial, investment, or legal advice. Gate does not guarantee the accuracy or completeness of the information and shall not be liable for any losses arising from the use of this information. Virtual asset investments carry high risks and are subject to significant price volatility. You may lose all of your invested principal. Please fully understand the relevant risks and make prudent decisions based on your own financial situation and risk tolerance. For details, please refer to
Disclaimer.