


#创作者冲榜 Don't Get Fooled by the "Rebound Illusion"! Behind the 70K Hovering, It's All Institution Harvesting Traps
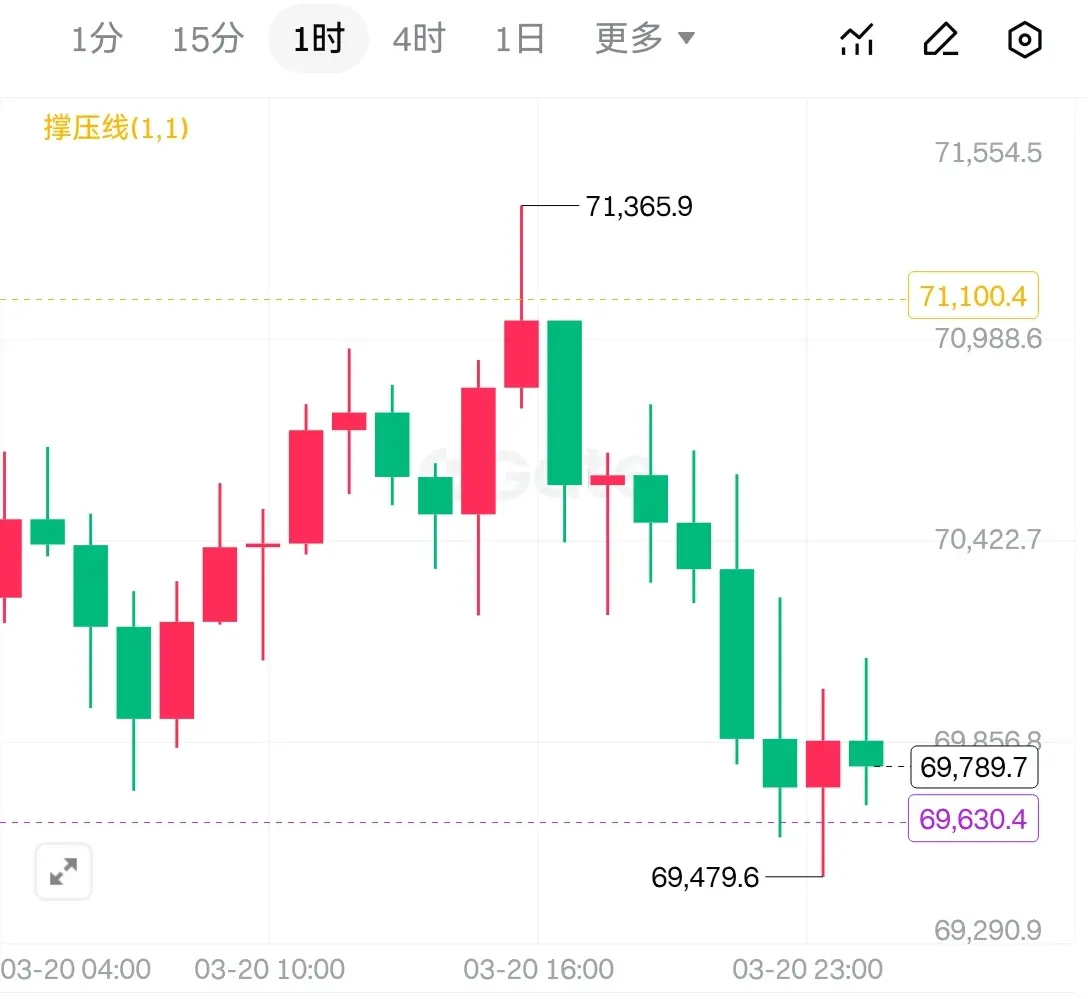
Bitcoin just broke below 69K on Thursday, then hovered around 70K on Friday—this move has left many people confused! Some say "it can't fall anymore, should rebound now," others panic "this is the calm before the storm." Retail investors are torn between buying the dip, while whales are glued to data—everyone is asking three core questions: When will the real bottom arrive? Will there be a crash on Friday? If it drops, where will it hover over the weekend? What's more heartbreaking is: institutions are lurking in the shadows right now, waiting for a bearish signal to smash and harvest, many people haven't reacted before their principal is gone.
I. First, Deconstructing the Market: 70K Hovering Is Not the Bottom, It's Institutions' "Luring Long + Washing" Illusion
Bitcoin hovering around 70K is not only not a bottom signal, but rather suggests the bottom hasn't arrived yet. Deconstructing market data, every detail reveals this is institutional gameplay, not true stabilization.
1. Seemingly supported, but actually "fake as hell"
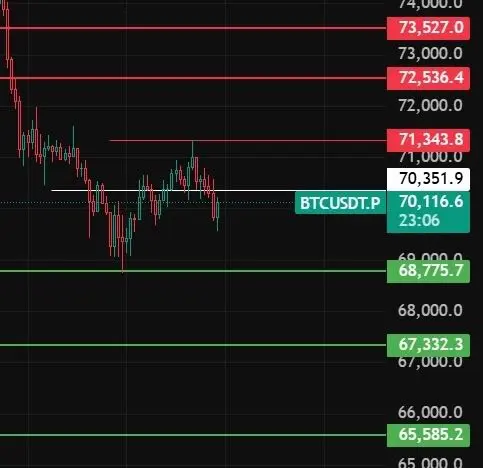
After Bitcoin briefly broke below 69K on Thursday and quickly rebounded, many thought "70K is strong support," but the truth is: this support is an artificial illusion created by institutions. Order books show buyer support around 70K, but spot demand has already weakened—CB premium has turned negative, meaning US investors are unwilling to take the offer at this price level, with insufficient follow-up buying. The so-called rebound is just a luring trap created by institutions with minimal capital, designed to trick retail investors into chasing gains while they themselves dump.
2. Derivatives Market "Chaos Between Longs and Shorts," Institutions Quietly Building Short Positions
Many are misled by the "positive funding rates," believing derivatives favor longs, but this is actually institutions' "smokescreen." Current funding rates are positive at 0.05%, seemingly showing long dominance, but cumulative trading volume difference (CVD) doesn't lie: spot CVD only decreased 40.64 million dollars, while perpetual futures CVD plummeted 506.75 million dollars. This shows leveraged traders are dumping frantically, while institutions are quietly building short positions in futures—using spot to lure longs on one hand while locking in downside profits with futures on the other. It's a classic "dual liquidation" trap.
3. Fractal Rebounds Are "Time-Sensitive Traps," Won't Last Long
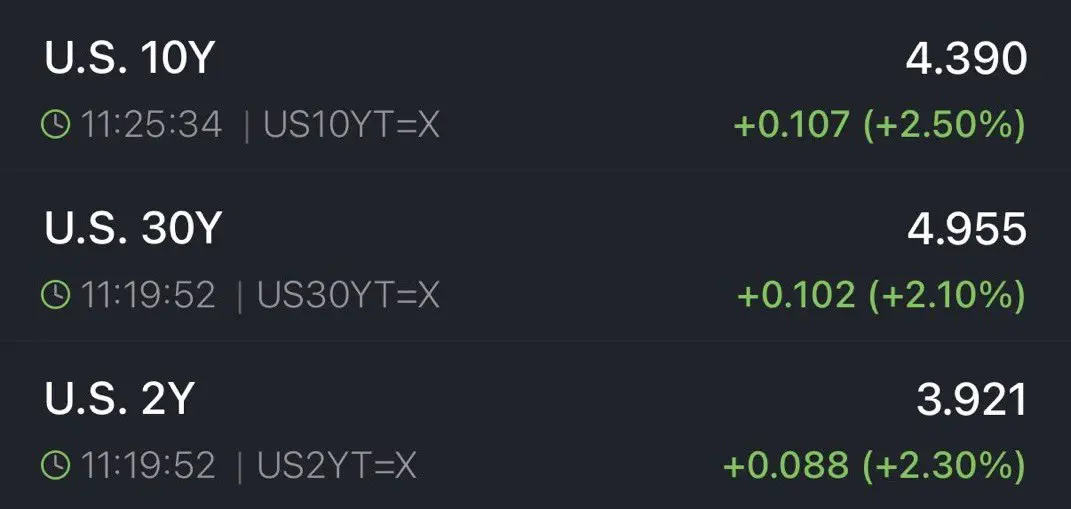
Some analysts claim current movement resembles the March 6-8 correction pattern and will reverse upward, but the key is: fractal rebounds have extremely strong time sensitivity—once they break, it's a crash. The March early rebound was because RSI showed clear bullish divergence, seller momentum was exhausted, and there were no external bearish signals; but now, while there's a nascent RSI divergence, it's overlaid with Fed high rates and institutional short positioning, making support extremely weak. Once 68,300 dollars key level breaks, the fractal pattern completely fails, and price will directly rush toward 65,000 dollars or even 62,000 dollars high liquidity zones.
II. Core Q&A: Will Friday Crash? When's the Bottom? Where Will It Hover Over the Weekend?
These three questions are everyone's core concern. Combining market conditions, institutional dynamics, and data, here are definitive answers to guide operations without ambiguity.
1. Today Friday (March 20), will there be a crash? Most likely not a crash, but watch for sharp washouts, with key focus on "false breaks."
Two reasons:
Institutions need luring longs: After Thursday's volatility, retail is mostly in observation mode. If institutions directly crash on Friday, they won't have time to harvest at all; instead they'll maintain volatility or slight rallies, making retail think "rebound is stable," then they chase gains before institutions smash the market.
Timeline doesn't support it: Friday is the week's trading tail end, many funds will close positions before the weekend to hedge, trading volume shrinks, lacking the capital momentum needed for a crash. But note, volume shrinkage doesn't mean no drop—institutions might create panic with "small capital smashing," like instantly breaking 70K then quickly pulling back, washing out panic sellers.
Key reminder: If Friday intraday breaks below 68,300 dollars and doesn't quickly rebound, crash risk instantly escalates—you must immediately reduce positions. This price point is institutions' "stop-loss line"; breaking it means institutions are actively smashing.
2. When exactly will the bottom arrive? Not now, still need to wait!
Short-term bottom could arrive next week at the earliest, long-term bottom still requires monitoring. Short-term unlikely below 62,000 dollars (extreme cases excluded). Clear analysis in two dimensions:
Short-term bottom (1-2 weeks): If Friday and weekend maintain volatility without breaking 68,300 dollars, next week might form short-term bottom around 65,000-68,000 dollars—RSI bullish divergence forms, seller momentum exhausted, institutions complete washing and short positioning before doing some dip buying. But this is only short-term bottom, more selling pressure after rebounds.
Long-term bottom (6-12 months): Bitcoin is in cycle adjustment phase in 2026, long-term bottom won't appear soon. Combined with latest prediction market data, adjustment trend is clearer: Polymarket and Kalshi show 65%-71% probability Bitcoin breaks below 55,000 dollars by December 31, 2026, 59% probability below 50,000 dollars, 46% probability down to 45,000 dollars, 31% probability reaching 40,000 dollars.
Analyst Willy Woo points out bear market might extend to early 2027, with long-term bottom around 45,000 dollars, macro weakness possibly touching below 30,000 dollars. However, current institutional positions provide support, won't drop to that range short-term, no need for excessive panic.
Retail avoiding pitfalls: Crypto has no "absolute bottom," only "relative bottoms." Retail shouldn't buy the dip around 70K, nor blindly liquidate below 65,000. Wait for stabilization signals of 3 consecutive days without breaking key support and spot volume expansion before considering entry.
3. If Friday drops, where will it hover over the weekend? Two scenarios: most likely 68,000-70,000 dollars, extreme case down to 65,000 dollars.
Normal volatility: If Friday drops slightly without breaking 68,300 dollars, weekend will range 68,000-70,000 dollars—institutions maintain this zone digesting selling pressure, deceiving retail investors into positions, awaiting next Monday macro news or capital flow to determine direction. This is the most likely scenario.
Minor break: If Friday breaks 68,300 dollars but doesn't sustain dropping, weekend will range 65,000-68,000 dollars—this zone has high liquidity and sufficient buying, institutions will shake out positions here, clearing excessive leveraged holdings, laying groundwork for subsequent moves.
Weekend Bitcoin volatility usually shrinks, institutions and whales mostly take breaks, no large-scale smashing or rallying, most likely tight ranging—this is the perfect time to "hide," don't operate, just patiently observe.
Bitcoin just broke below 69K on Thursday, then hovered around 70K on Friday—this move has left many people confused! Some say "it can't fall anymore, should rebound now," others panic "this is the calm before the storm." Retail investors are torn between buying the dip, while whales are glued to data—everyone is asking three core questions: When will the real bottom arrive? Will there be a crash on Friday? If it drops, where will it hover over the weekend? What's more heartbreaking is: institutions are lurking in the shadows right now, waiting for a bearish signal to smash and harvest, many people haven't reacted before their principal is gone.
I. First, Deconstructing the Market: 70K Hovering Is Not the Bottom, It's Institutions' "Luring Long + Washing" Illusion
Bitcoin hovering around 70K is not only not a bottom signal, but rather suggests the bottom hasn't arrived yet. Deconstructing market data, every detail reveals this is institutional gameplay, not true stabilization.
1. Seemingly supported, but actually "fake as hell"
After Bitcoin briefly broke below 69K on Thursday and quickly rebounded, many thought "70K is strong support," but the truth is: this support is an artificial illusion created by institutions. Order books show buyer support around 70K, but spot demand has already weakened—CB premium has turned negative, meaning US investors are unwilling to take the offer at this price level, with insufficient follow-up buying. The so-called rebound is just a luring trap created by institutions with minimal capital, designed to trick retail investors into chasing gains while they themselves dump.
2. Derivatives Market "Chaos Between Longs and Shorts," Institutions Quietly Building Short Positions
Many are misled by the "positive funding rates," believing derivatives favor longs, but this is actually institutions' "smokescreen." Current funding rates are positive at 0.05%, seemingly showing long dominance, but cumulative trading volume difference (CVD) doesn't lie: spot CVD only decreased 40.64 million dollars, while perpetual futures CVD plummeted 506.75 million dollars. This shows leveraged traders are dumping frantically, while institutions are quietly building short positions in futures—using spot to lure longs on one hand while locking in downside profits with futures on the other. It's a classic "dual liquidation" trap.
3. Fractal Rebounds Are "Time-Sensitive Traps," Won't Last Long
Some analysts claim current movement resembles the March 6-8 correction pattern and will reverse upward, but the key is: fractal rebounds have extremely strong time sensitivity—once they break, it's a crash. The March early rebound was because RSI showed clear bullish divergence, seller momentum was exhausted, and there were no external bearish signals; but now, while there's a nascent RSI divergence, it's overlaid with Fed high rates and institutional short positioning, making support extremely weak. Once 68,300 dollars key level breaks, the fractal pattern completely fails, and price will directly rush toward 65,000 dollars or even 62,000 dollars high liquidity zones.
II. Core Q&A: Will Friday Crash? When's the Bottom? Where Will It Hover Over the Weekend?
These three questions are everyone's core concern. Combining market conditions, institutional dynamics, and data, here are definitive answers to guide operations without ambiguity.
1. Today Friday (March 20), will there be a crash? Most likely not a crash, but watch for sharp washouts, with key focus on "false breaks."
Two reasons:
Institutions need luring longs: After Thursday's volatility, retail is mostly in observation mode. If institutions directly crash on Friday, they won't have time to harvest at all; instead they'll maintain volatility or slight rallies, making retail think "rebound is stable," then they chase gains before institutions smash the market.
Timeline doesn't support it: Friday is the week's trading tail end, many funds will close positions before the weekend to hedge, trading volume shrinks, lacking the capital momentum needed for a crash. But note, volume shrinkage doesn't mean no drop—institutions might create panic with "small capital smashing," like instantly breaking 70K then quickly pulling back, washing out panic sellers.
Key reminder: If Friday intraday breaks below 68,300 dollars and doesn't quickly rebound, crash risk instantly escalates—you must immediately reduce positions. This price point is institutions' "stop-loss line"; breaking it means institutions are actively smashing.
2. When exactly will the bottom arrive? Not now, still need to wait!
Short-term bottom could arrive next week at the earliest, long-term bottom still requires monitoring. Short-term unlikely below 62,000 dollars (extreme cases excluded). Clear analysis in two dimensions:
Short-term bottom (1-2 weeks): If Friday and weekend maintain volatility without breaking 68,300 dollars, next week might form short-term bottom around 65,000-68,000 dollars—RSI bullish divergence forms, seller momentum exhausted, institutions complete washing and short positioning before doing some dip buying. But this is only short-term bottom, more selling pressure after rebounds.
Long-term bottom (6-12 months): Bitcoin is in cycle adjustment phase in 2026, long-term bottom won't appear soon. Combined with latest prediction market data, adjustment trend is clearer: Polymarket and Kalshi show 65%-71% probability Bitcoin breaks below 55,000 dollars by December 31, 2026, 59% probability below 50,000 dollars, 46% probability down to 45,000 dollars, 31% probability reaching 40,000 dollars.
Analyst Willy Woo points out bear market might extend to early 2027, with long-term bottom around 45,000 dollars, macro weakness possibly touching below 30,000 dollars. However, current institutional positions provide support, won't drop to that range short-term, no need for excessive panic.
Retail avoiding pitfalls: Crypto has no "absolute bottom," only "relative bottoms." Retail shouldn't buy the dip around 70K, nor blindly liquidate below 65,000. Wait for stabilization signals of 3 consecutive days without breaking key support and spot volume expansion before considering entry.
3. If Friday drops, where will it hover over the weekend? Two scenarios: most likely 68,000-70,000 dollars, extreme case down to 65,000 dollars.
Normal volatility: If Friday drops slightly without breaking 68,300 dollars, weekend will range 68,000-70,000 dollars—institutions maintain this zone digesting selling pressure, deceiving retail investors into positions, awaiting next Monday macro news or capital flow to determine direction. This is the most likely scenario.
Minor break: If Friday breaks 68,300 dollars but doesn't sustain dropping, weekend will range 65,000-68,000 dollars—this zone has high liquidity and sufficient buying, institutions will shake out positions here, clearing excessive leveraged holdings, laying groundwork for subsequent moves.
Weekend Bitcoin volatility usually shrinks, institutions and whales mostly take breaks, no large-scale smashing or rallying, most likely tight ranging—this is the perfect time to "hide," don't operate, just patiently observe.