XRP Taps Critical Support but is a Retest of $0.55 Incoming? (Ripple Price Analysis)
CryptoPotato
After experiencing significant volatility, Ripple’s price underwent an impulsive bearish leg characterized by large red candles with notable shadows.
XRP ultimately reached the 100-day moving average at $0.47, which serves as strong support. However, if it breaks below this level, another cascade will become possible.
Ripple Price Technical Analysis
By Shayan
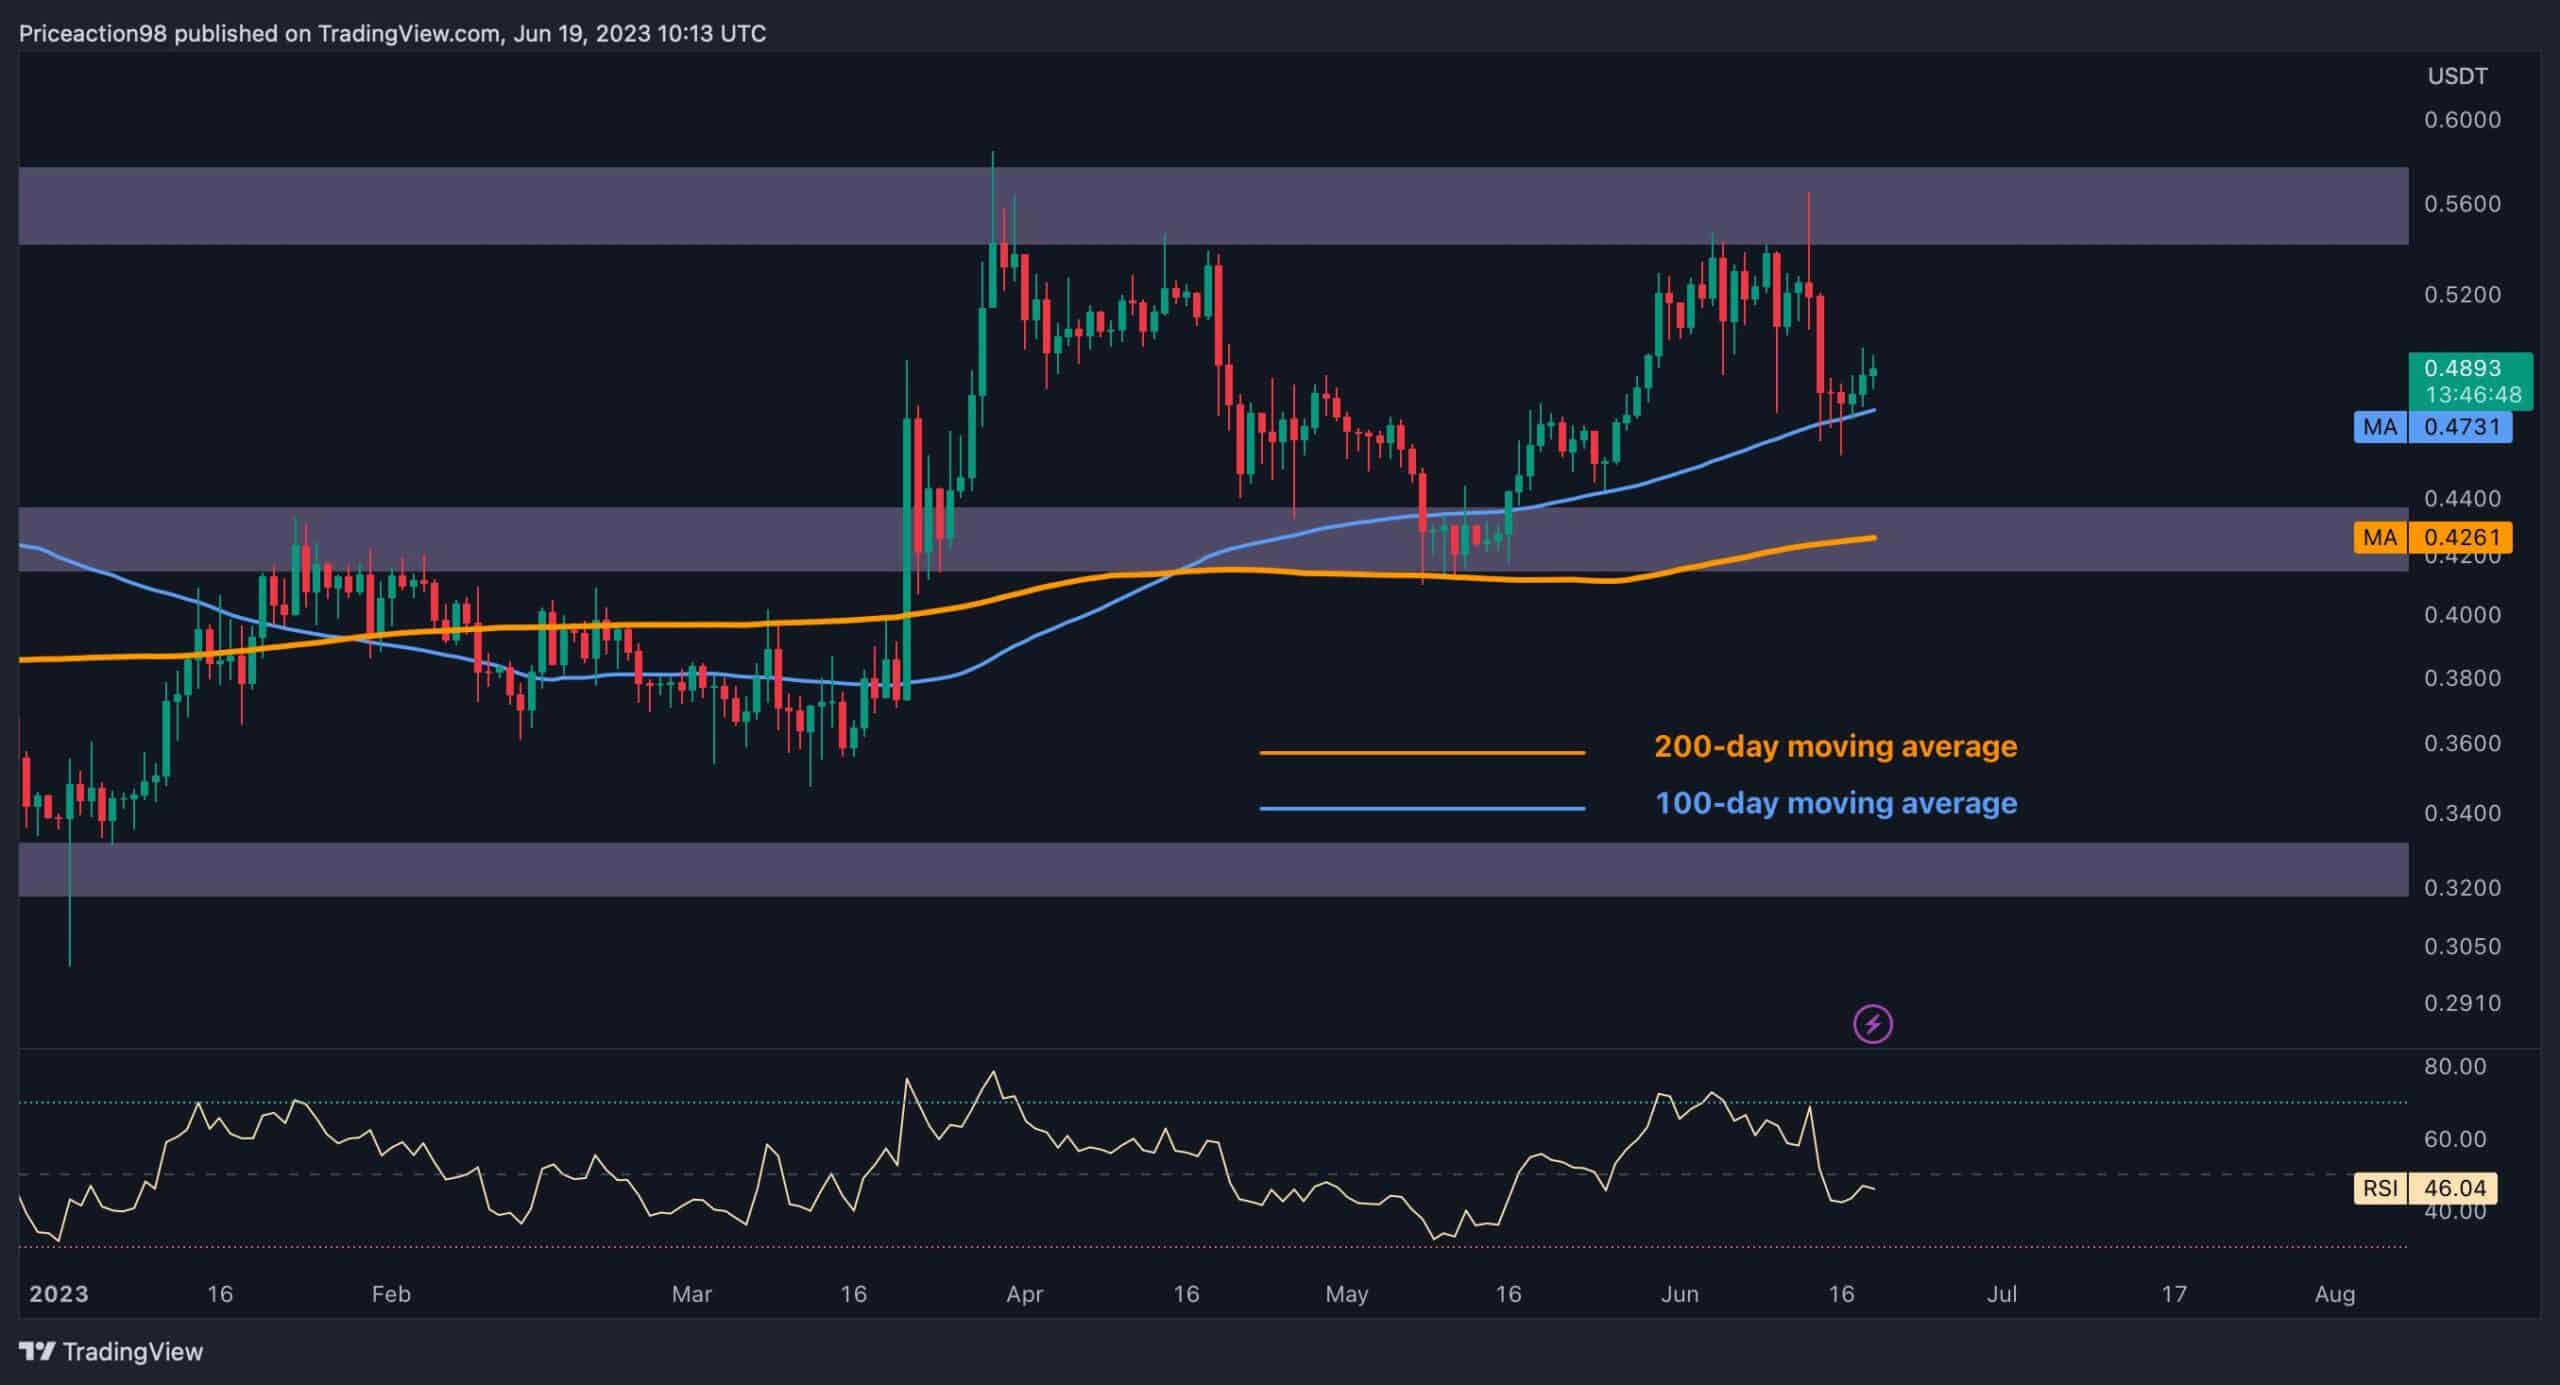
The Daily Chart
Ripple’s price went through extreme volatility around the crucial resistance region of $0.5, resulting in choppy PA lacking a clear direction. Nevertheless, the cryptocurrency experienced a substantial decline and reached a significant support region encompassing the 100-day moving average situated at $0.47.
Furthermore, a double-top pattern has formed at the $0.55 zone, indicating a bearish outlook for Ripple in the short term.
However, it could also be the case that the price will enter a consolidation stage in the short term, considering the buying power observed around this crucial support region. Nonetheless, it should be noted that if XRP plummets below the moving average, a cascade toward the 200-day MA, currently positioned at $0.42, would be the most probable scenario for Ripple.
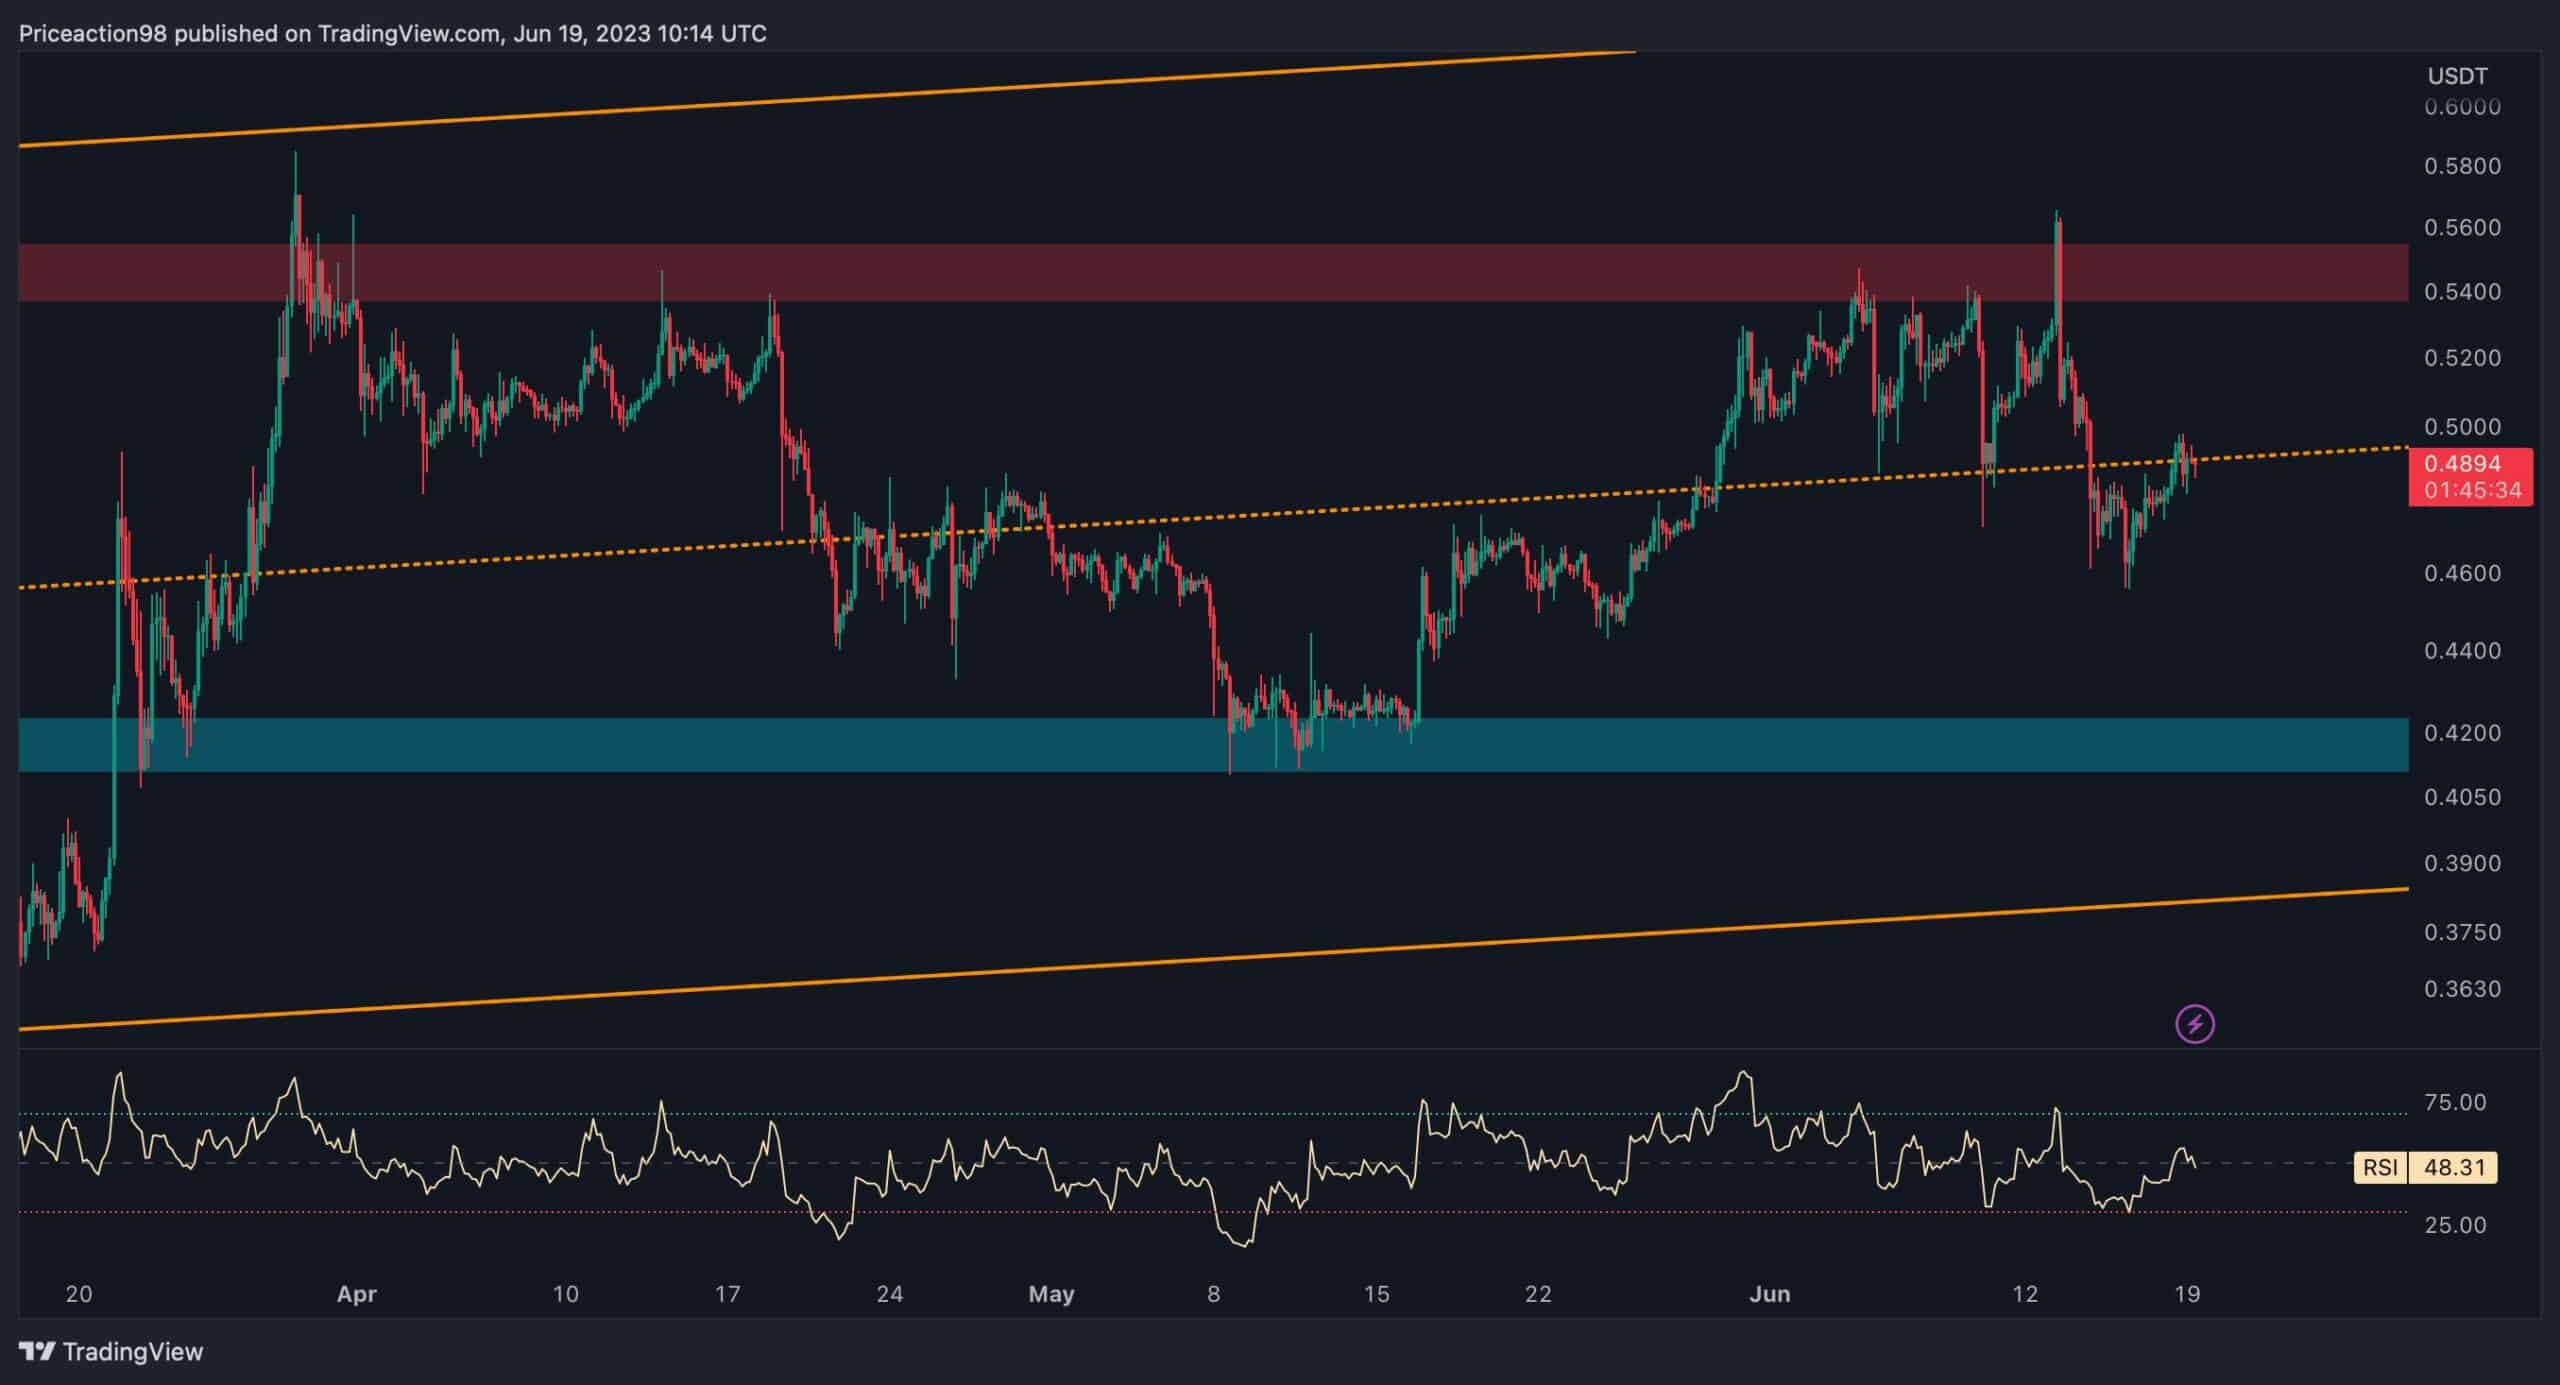
Shifting the focus to the 4-hour chart, the aforementioned volatility becomes more apparent. The price started increasing initially, surpassing the significant resistance level at $0.55 but subsequently reversed and experienced a substantial decline towards the middle boundary of the channel.
This development, along with the break below the channel’s mid-boundary at $0.49, indicates a bearish outlook for Ripple in the short term.
However, the price has retraced back to the broken level, forming a pullback and confirming a valid bearish trend. Consequently, if the mid-trendline rejects the price, a cascade towards the static support region of $0.42 would become a possibility. Conversely, breaching the aforementioned trendline up may potentially trigger an uptrend toward the $0.55 resistance zone.
免責聲明:本頁面資訊可能來自第三方,不代表 Gate 的觀點或意見。頁面顯示的內容僅供參考,不構成任何財務、投資或法律建議。Gate 對資訊的準確性、完整性不作保證,對因使用本資訊而產生的任何損失不承擔責任。虛擬資產投資屬高風險行為,價格波動劇烈,您可能損失全部投資本金。請充分了解相關風險,並根據自身財務狀況和風險承受能力謹慎決策。具體內容詳見聲明。
留言
0/400
暫無留言