Bitcoin’s price is currently going through a phase of consolidation and has reached the 100-day moving average of $26,922. However, two significant support areas ahead on its path could potentially halt the ongoing decline and trigger the next bullish rally.
Technical Analysis
By Shayan
The Daily Chart
During the consolidation correction stage, BTC dipped slightly below the middle trendline of the ascending channel and tested it as a pullback. However, the Bitcoin price continued the downtrend by printing small consecutive red candles and temporarily stalled at the 100-day moving average of $26.9K.
If it falls below the 100-day moving average, the lower threshold of the channel of around $24K and the 200-day moving average of $23K could be potential price targets.
On the other hand, if Bitcoin finds support at the 100-day moving average, an attempt to surpass the significant resistance level at $30K will be the most likely scenario.
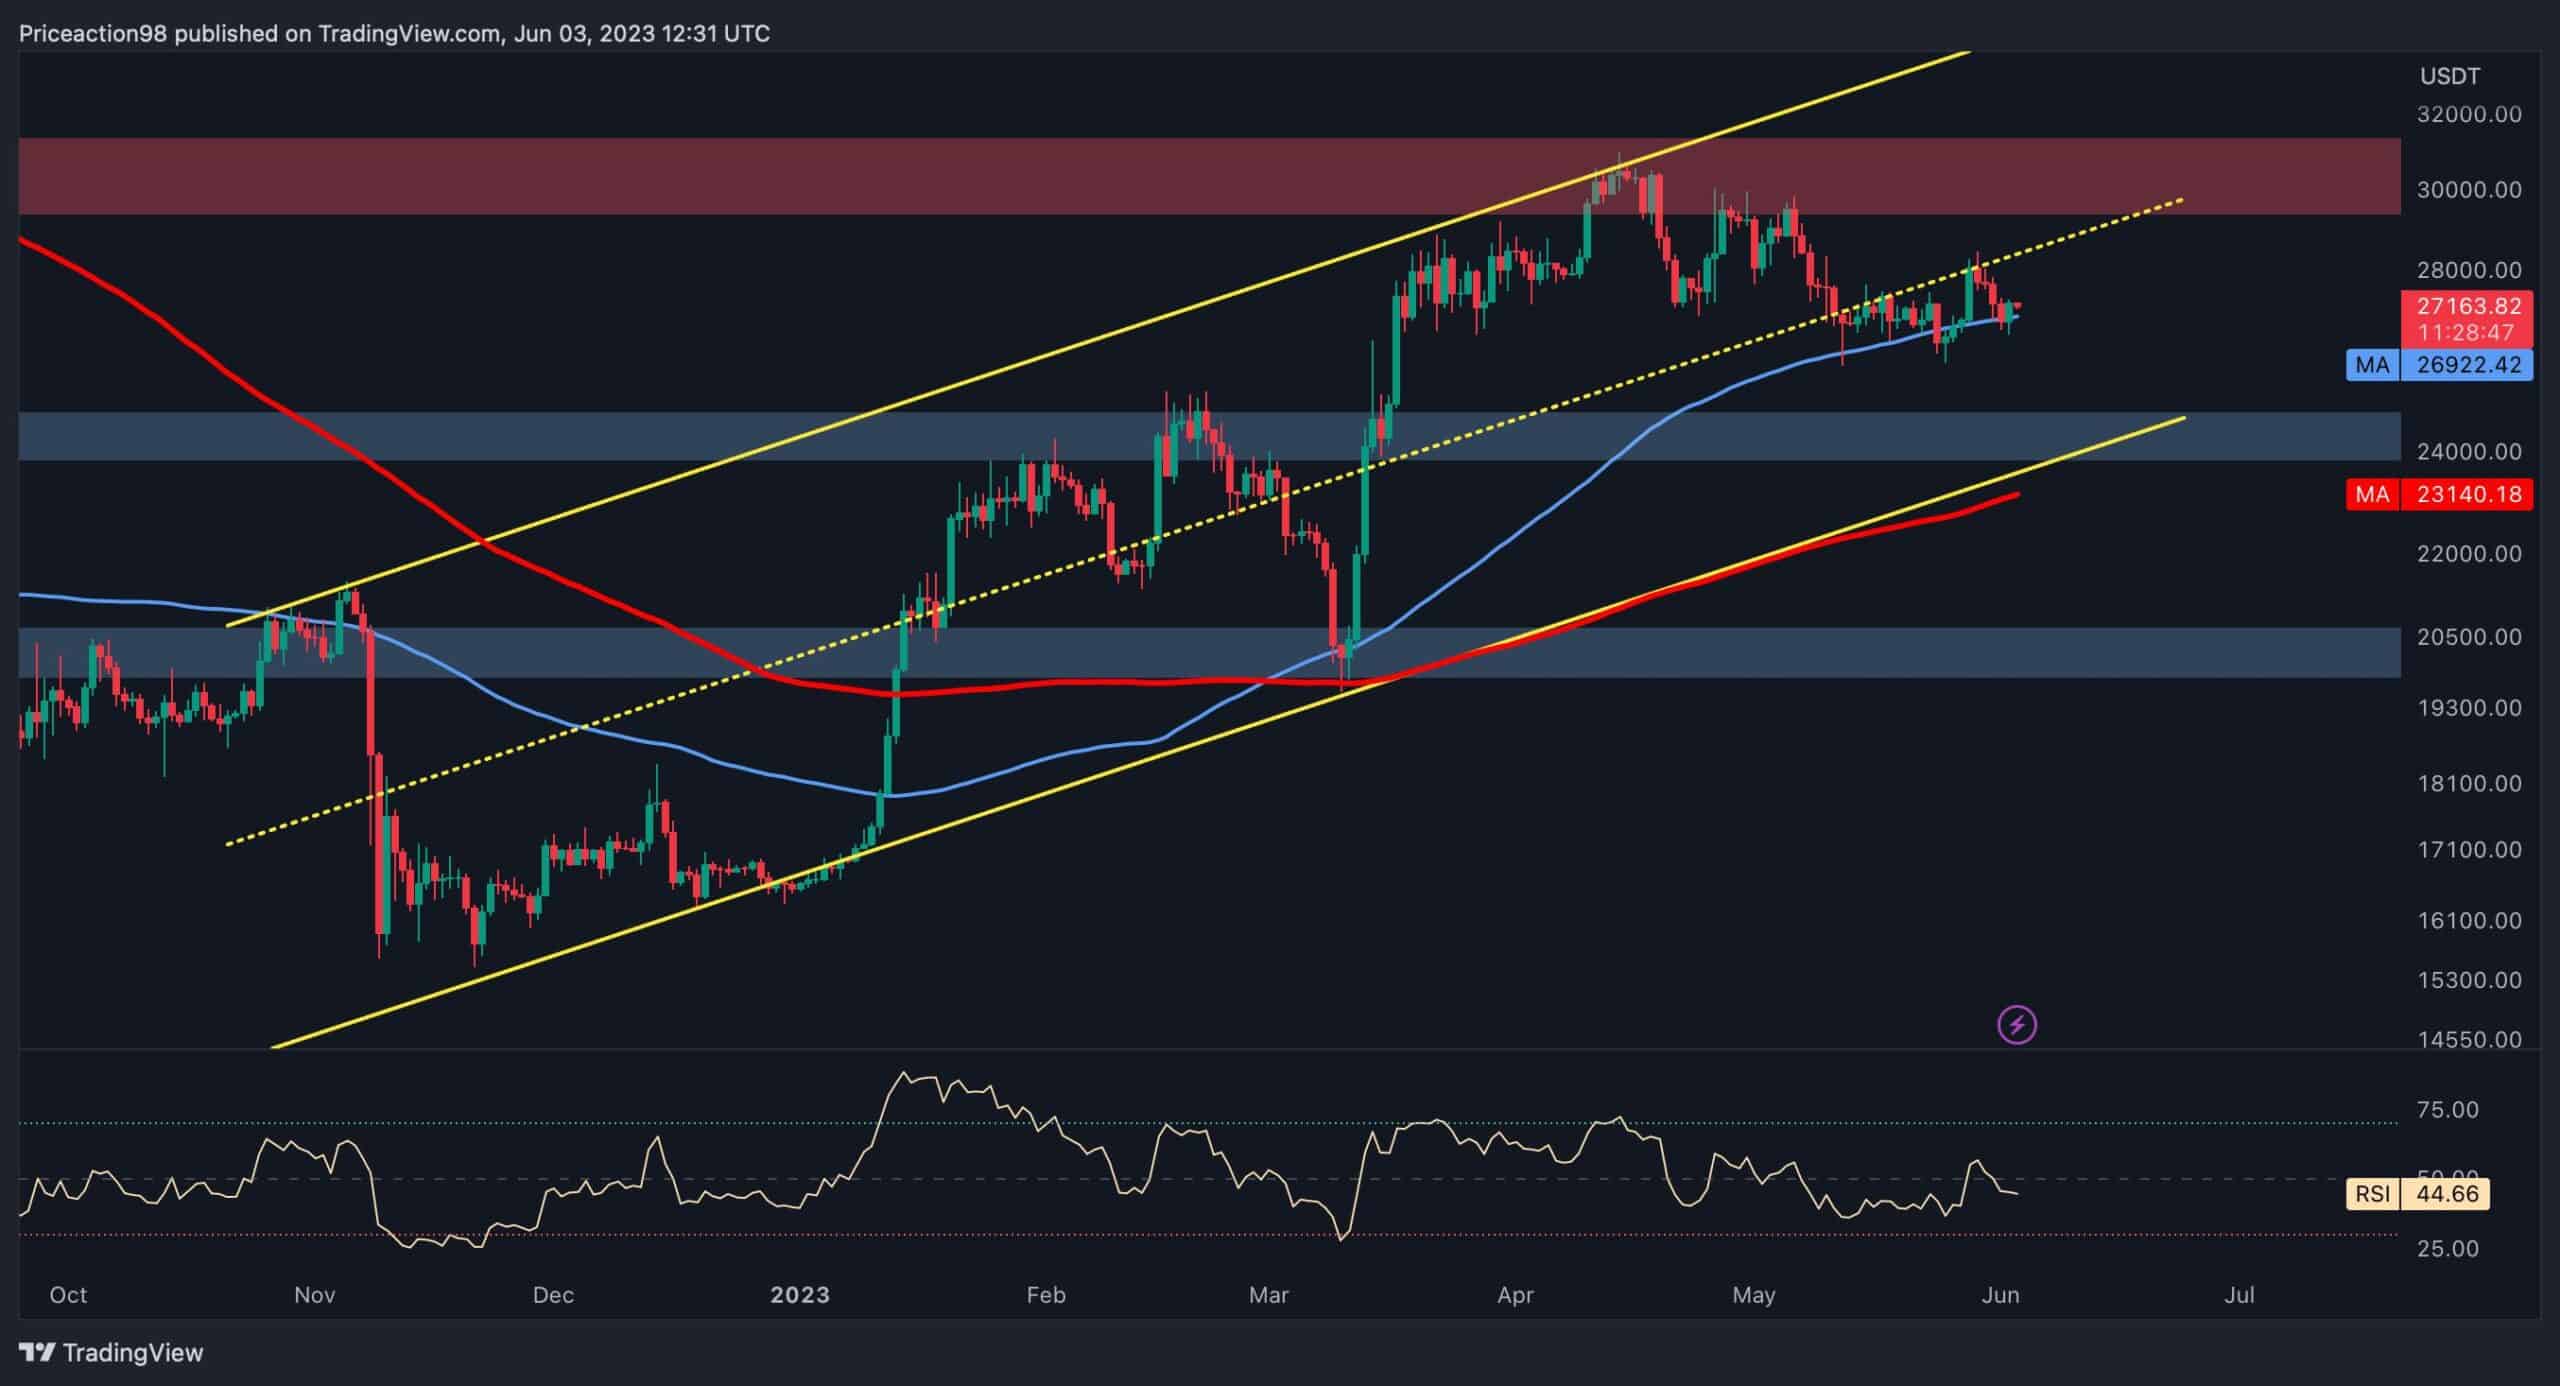 Source: TradingView### The 4-Hour Chart
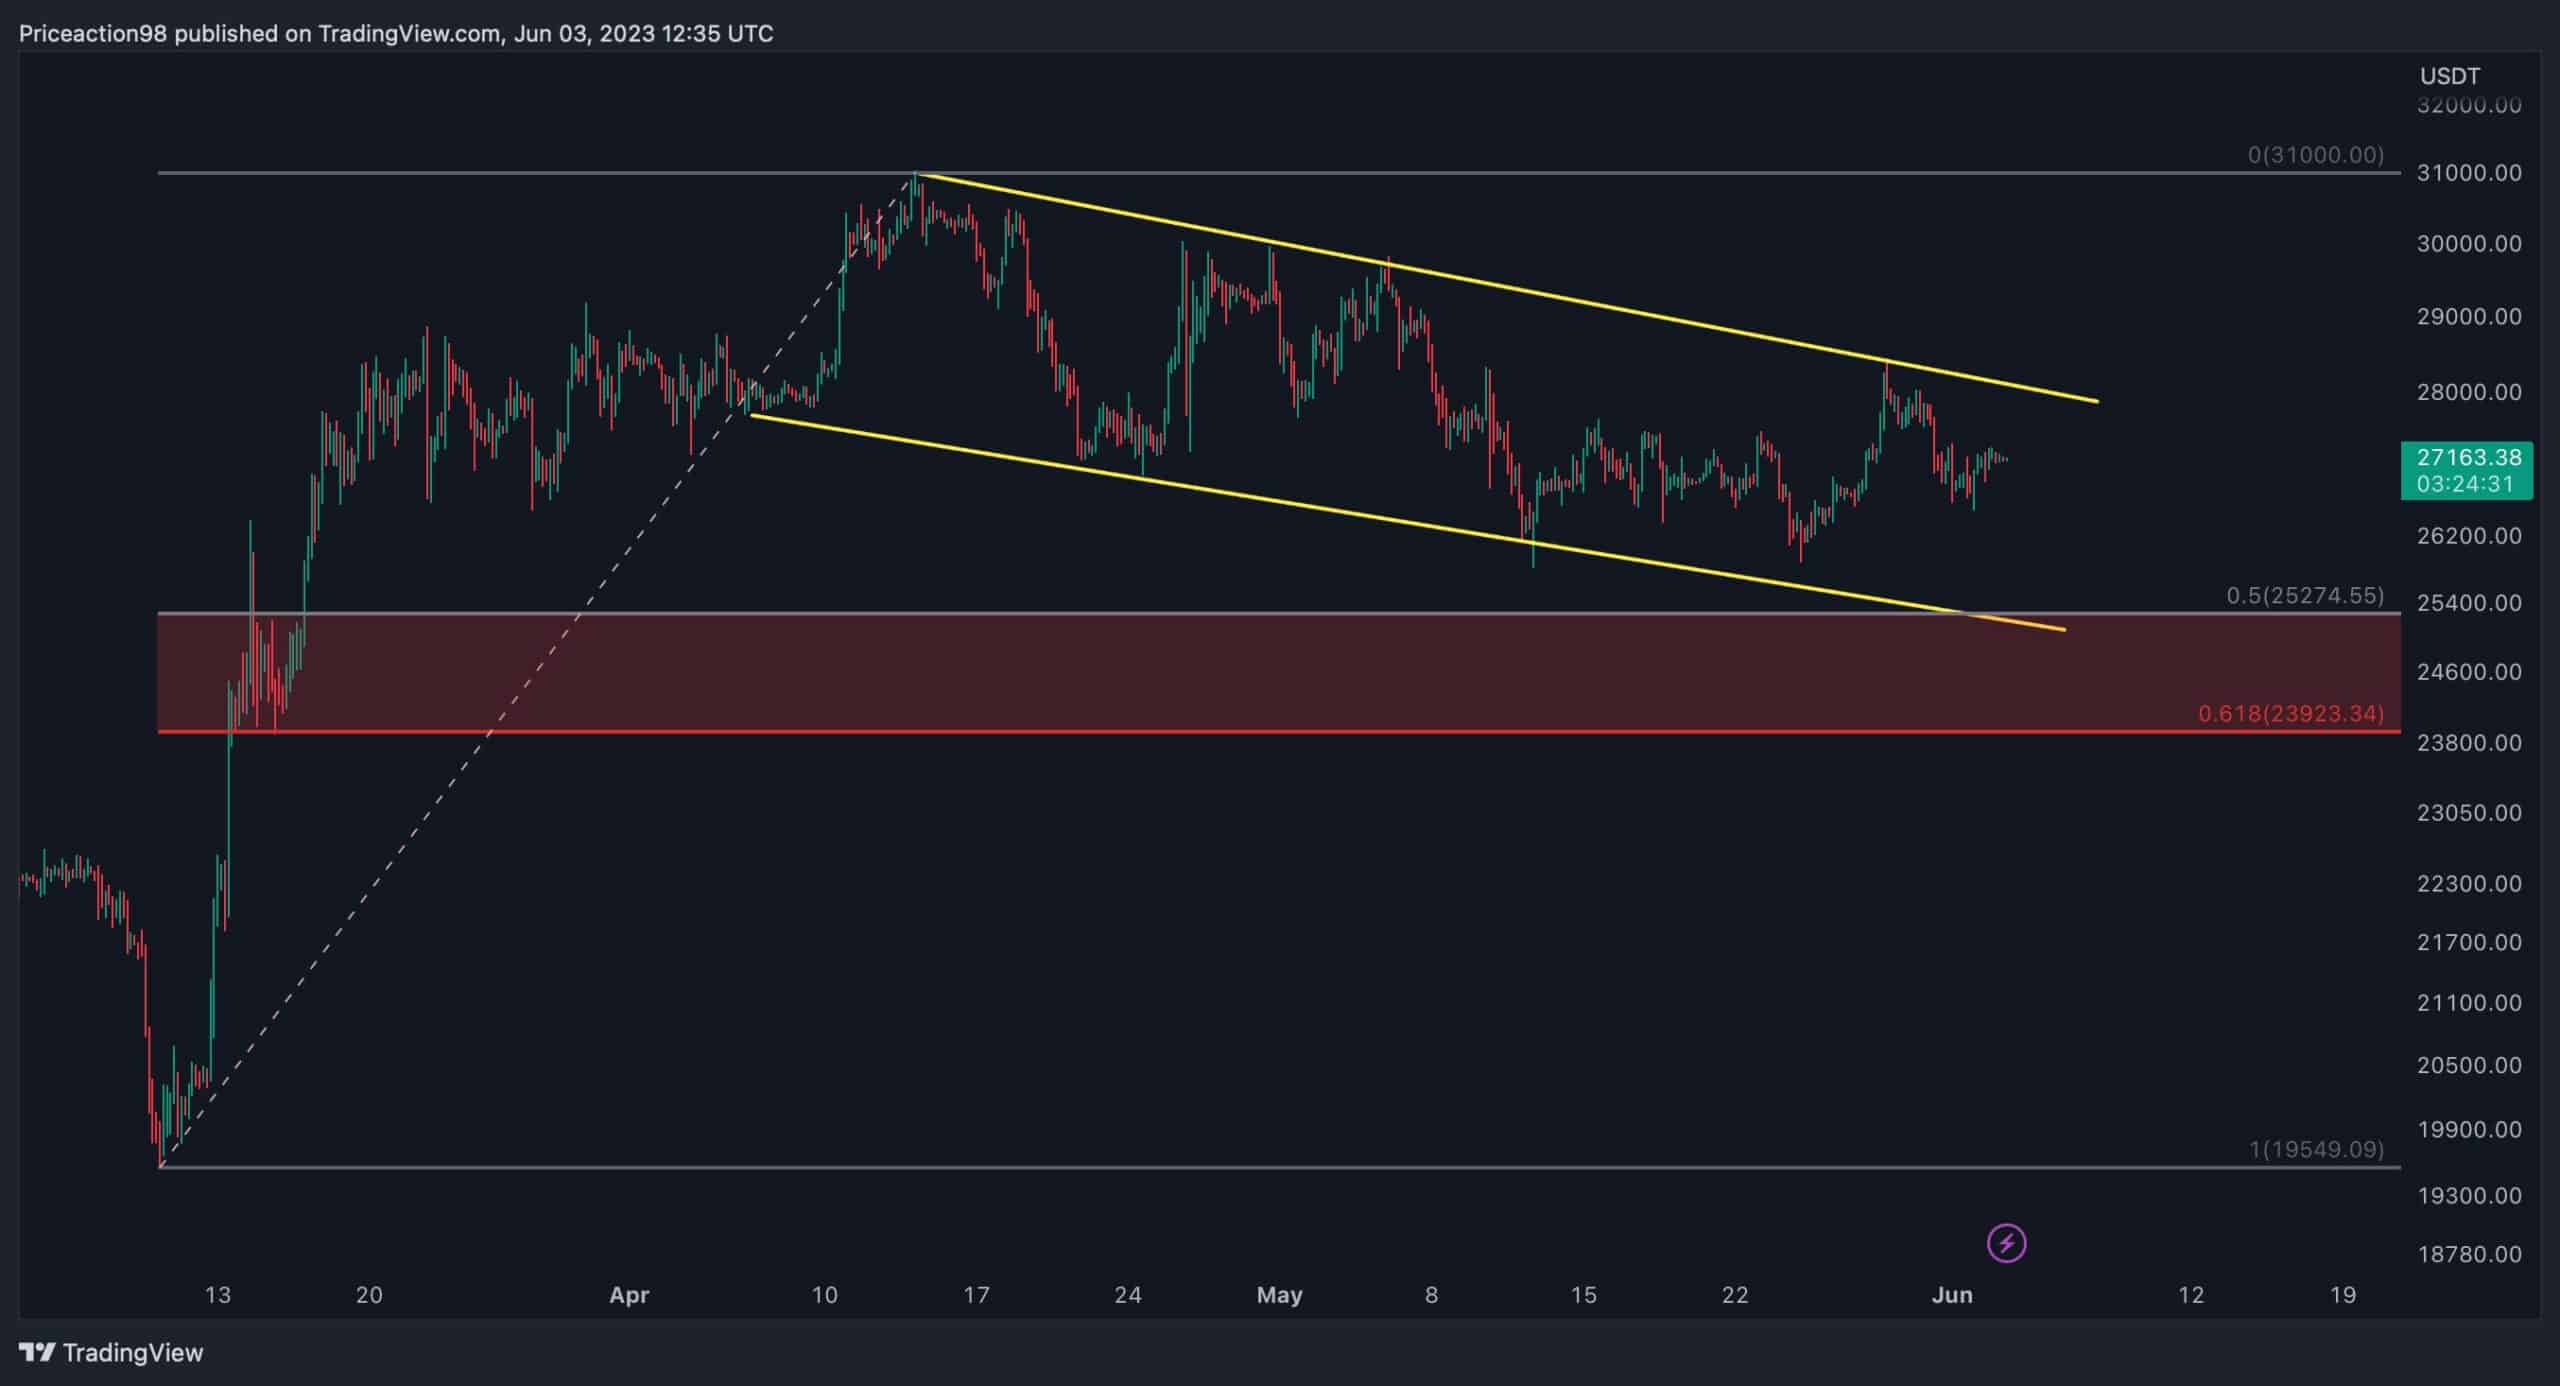
Analyzing the 4-hour timeframe, a flag pattern has been developed during the recent correction phase of the market. Bitcoin’s price is currently consolidating within this flag, forming lower highs and lower lows.
However, there is a substantial support area between the 61.8% ($23,923) and 50% ($25,274) levels of the Fibonacci retracement. These two well-known Fibonacci levels indicate potential targets for correction stages. Given the market situation, it is likely that the price will continue the correction leg until it reaches this critical support zone.
 Source: TradingViewOn-chain Analysis
The following chart demonstrates the SOPR ratio metric alongside Bitcoin’s price since the 2015 bear market. The SOPR ratio is measured by dividing the values of long-term holders’ SOPR values by short-term holders. It has consistently signaled long-term investment opportunities, as in the previous two bearish cycles in 2015 and 2019.
This ratio reached its lowest point since 2019 – around 0.53 – in December 2022, indicating the onset of a bullish stage in the market. Currently, it is experiencing an uptrend, surpassing 1, which has historically coincided with successful bull runs in the cryptocurrency market.
Although it is uncertain whether the bull market has concluded, as long as the SOPR Ratio remains above one, the buyers are expected to continue dominating.
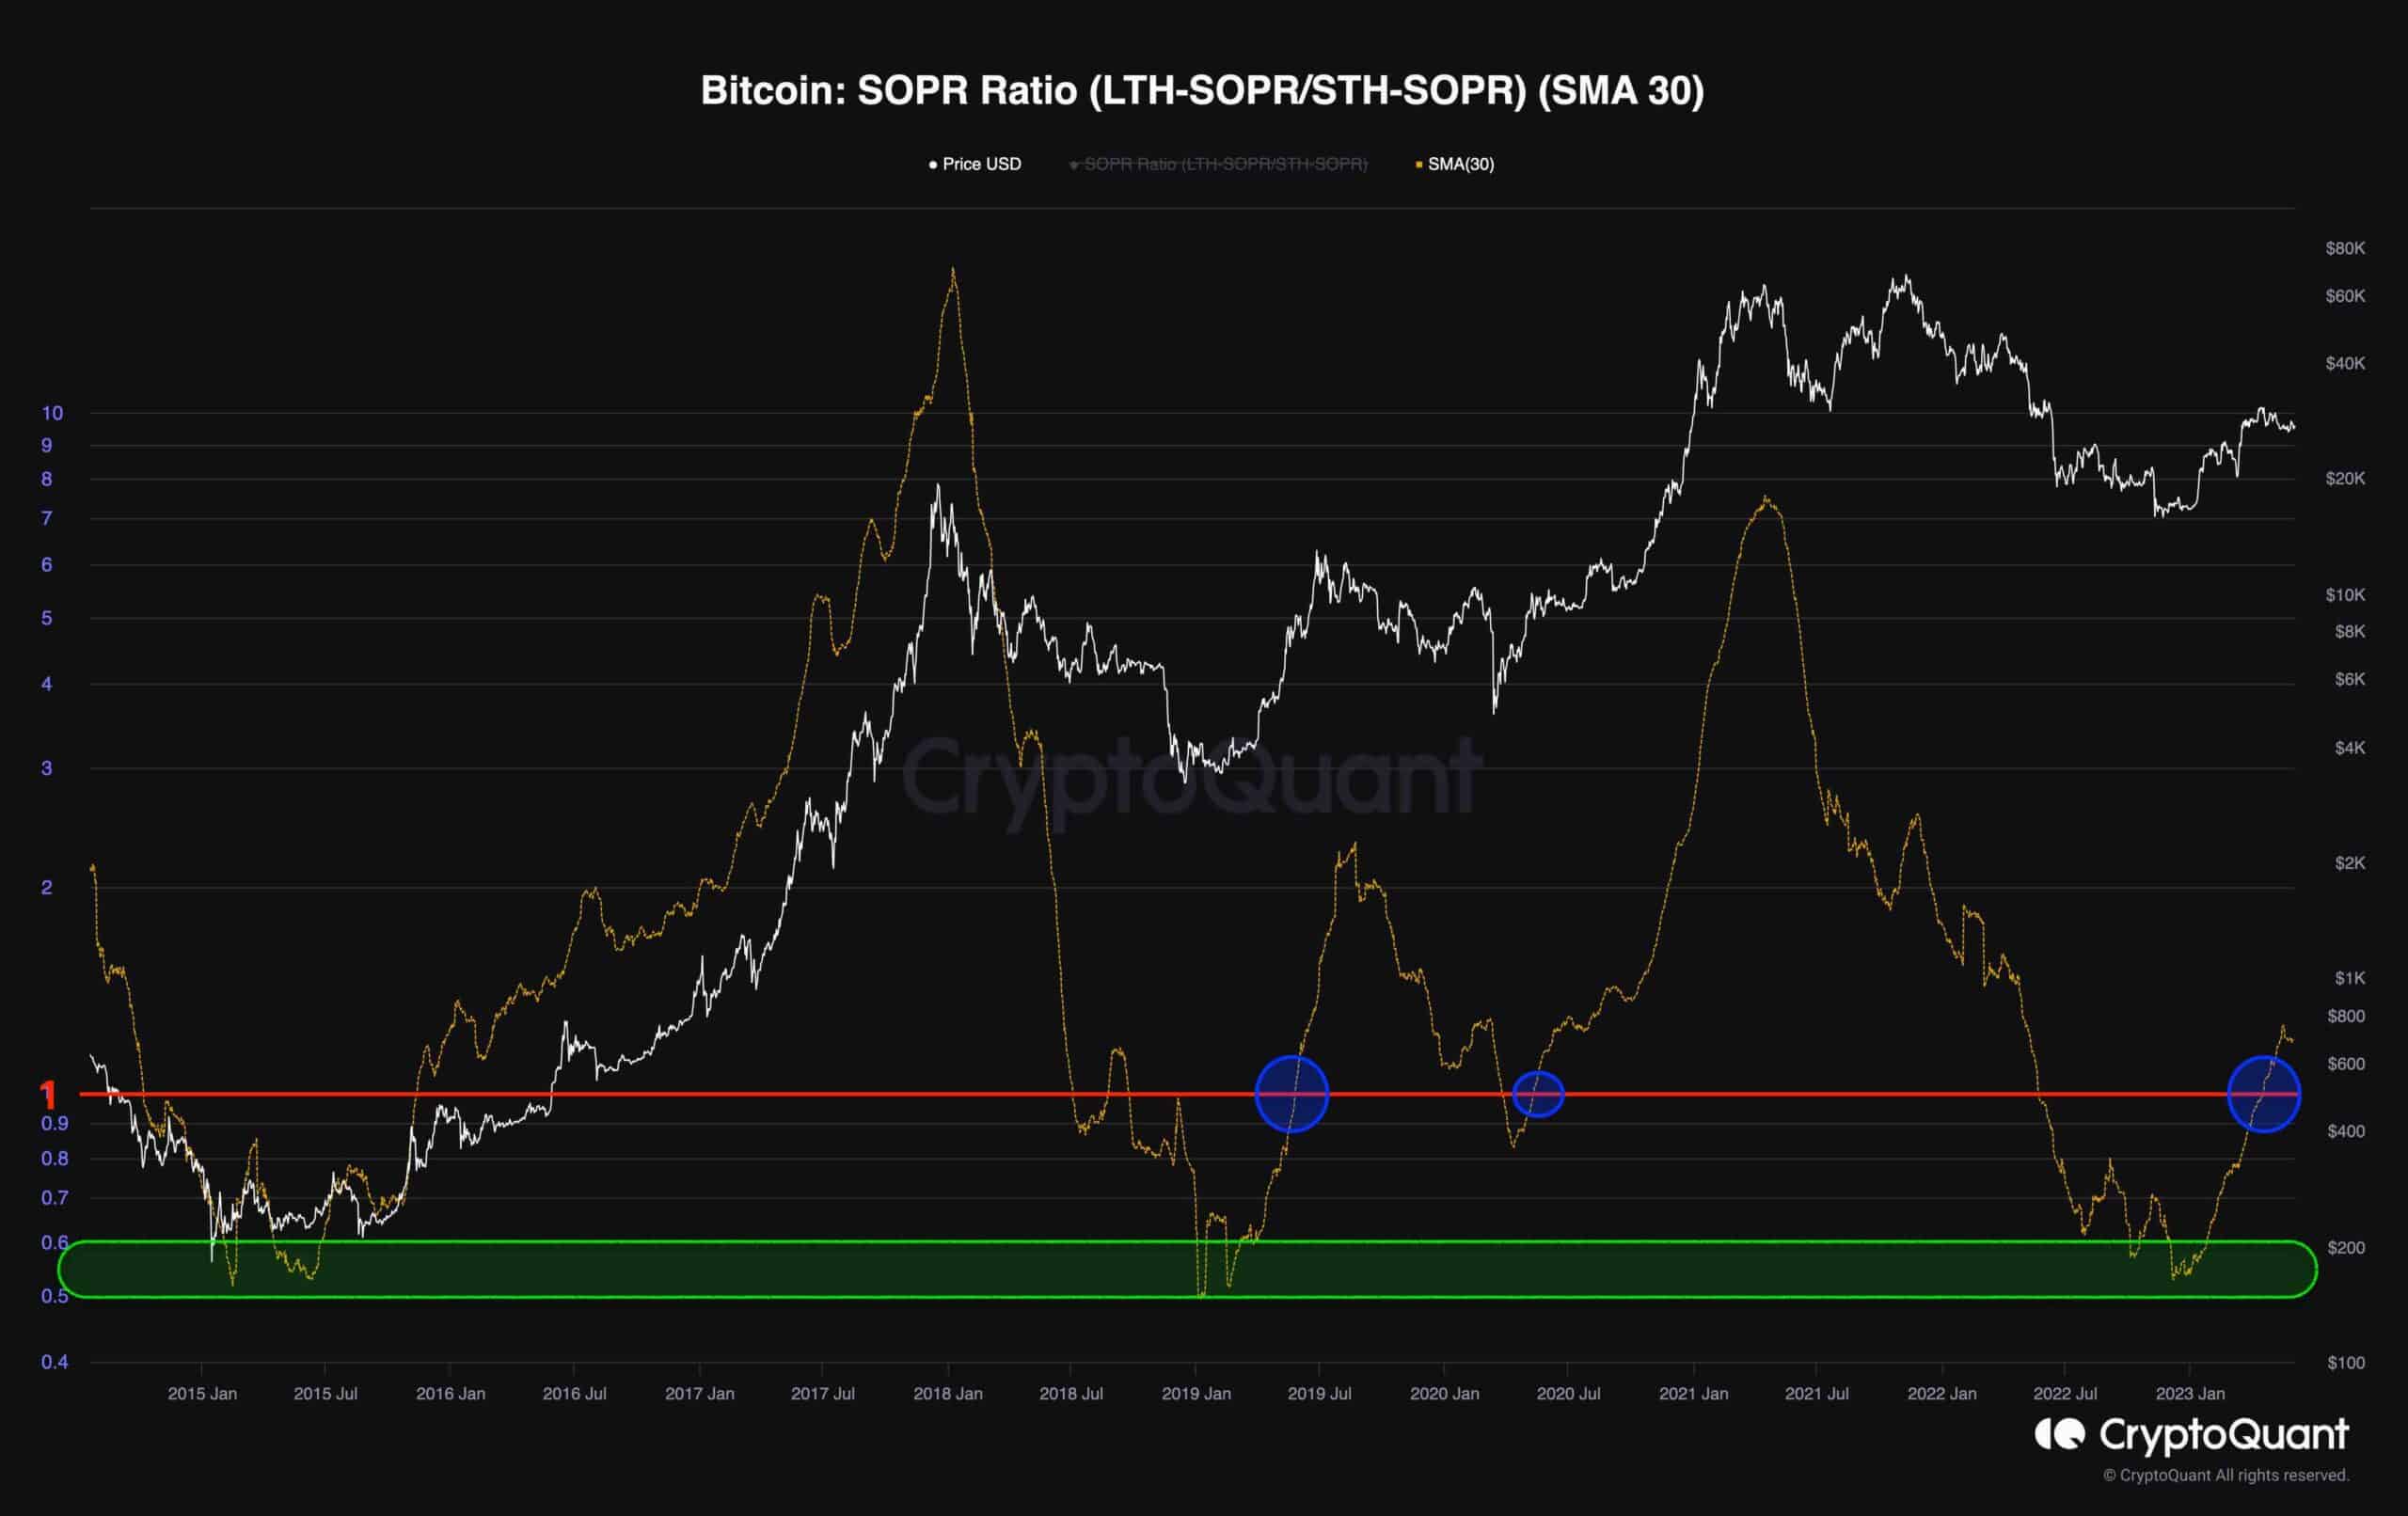 Source: CryptoQuant
Avertissement : Les informations contenues dans cette page peuvent provenir de tiers et ne représentent pas les points de vue ou les opinions de Gate. Le contenu de cette page est fourni à titre de référence uniquement et ne constitue pas un conseil financier, d'investissement ou juridique. Gate ne garantit pas l'exactitude ou l'exhaustivité des informations et n'est pas responsable des pertes résultant de l'utilisation de ces informations. Les investissements en actifs virtuels comportent des risques élevés et sont soumis à une forte volatilité des prix. Vous pouvez perdre la totalité du capital investi. Veuillez comprendre pleinement les risques pertinents et prendre des décisions prudentes en fonction de votre propre situation financière et de votre tolérance au risque. Pour plus de détails, veuillez consulter l'
avertissement.