Ripple’s XRP has exhibited turbulent price action and high volatility since early April, leaving traders uncertain about the market’s future direction.
However, it is likely that the price will continue to consolidate within the range defined by the 100-day and 200-day moving averages in the medium term.
XRP Price Technical Analysis
By Shayan
The Daily Chart
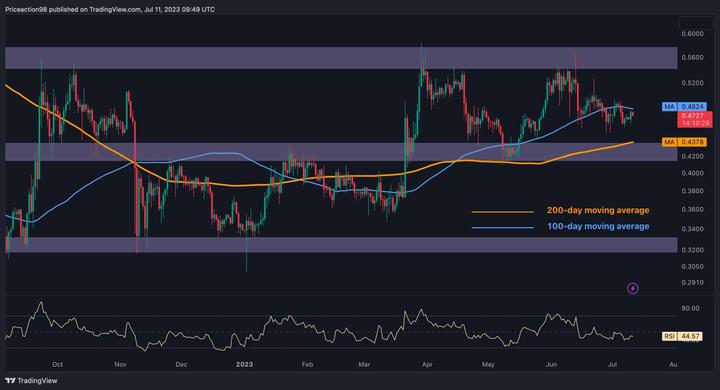
Taking a look at the daily chart, XRP’s price underwent a corrective consolidation phase, pulling back towards the 200-day moving average situated at $0.44.
This retracement occurred after failing to surpass the key resistance region of $0.55. The $0.55 zone holds significant psychological resistance, as it has repeatedly hindered XRP price movements in the past. Notably, there is a considerable amount of supply in this region, indicating aggressive selling pressure.
Nonetheless, the price is expected to remain within a dynamic range bounded by the resistance level of the 100-day moving average at $0.4828 and the support level of the 200-day moving average at $0.4372 in the short term. Consequently, a breakout from this critical range will likely determine Ripple’s next move.
 Source: TradingView### The 4-Hour Chart
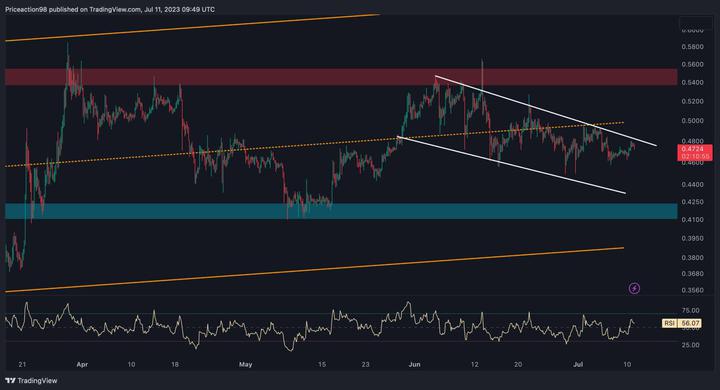
On the 4-hour timeframe, there has been a decline in the price below the mid-boundary of the channel, followed by a retracement and pullback. However, after completing the pullback to the broken level, XRP has started another downward movement, indicating a prevailing bearish sentiment in the market.
Simultaneously, a descending wedge pattern has formed on the 4-hour timeframe, characterized by white trendlines. This pattern typically suggests a potential bullish move if the XRP price breaks above the upper trendline.
Therefore, the cryptocurrency seems more likely to continue ranging within the descending wedge pattern until a breakout occurs. In the event of a breakout above the upper threshold, there is a possibility of an attempt toward the $0.55 resistance level.
 Source: TradingView
Avertissement : Les informations contenues dans cette page peuvent provenir de tiers et ne représentent pas les points de vue ou les opinions de Gate. Le contenu de cette page est fourni à titre de référence uniquement et ne constitue pas un conseil financier, d'investissement ou juridique. Gate ne garantit pas l'exactitude ou l'exhaustivité des informations et n'est pas responsable des pertes résultant de l'utilisation de ces informations. Les investissements en actifs virtuels comportent des risques élevés et sont soumis à une forte volatilité des prix. Vous pouvez perdre la totalité du capital investi. Veuillez comprendre pleinement les risques pertinents et prendre des décisions prudentes en fonction de votre propre situation financière et de votre tolérance au risque. Pour plus de détails, veuillez consulter l'
avertissement.