The price of Bitcoin is currently on a downward trajectory since it faced resistance at $30K in April. However, there are notable support levels that may prevent further decline.
Technical Analysis
By: Edris
The Daily Chart:
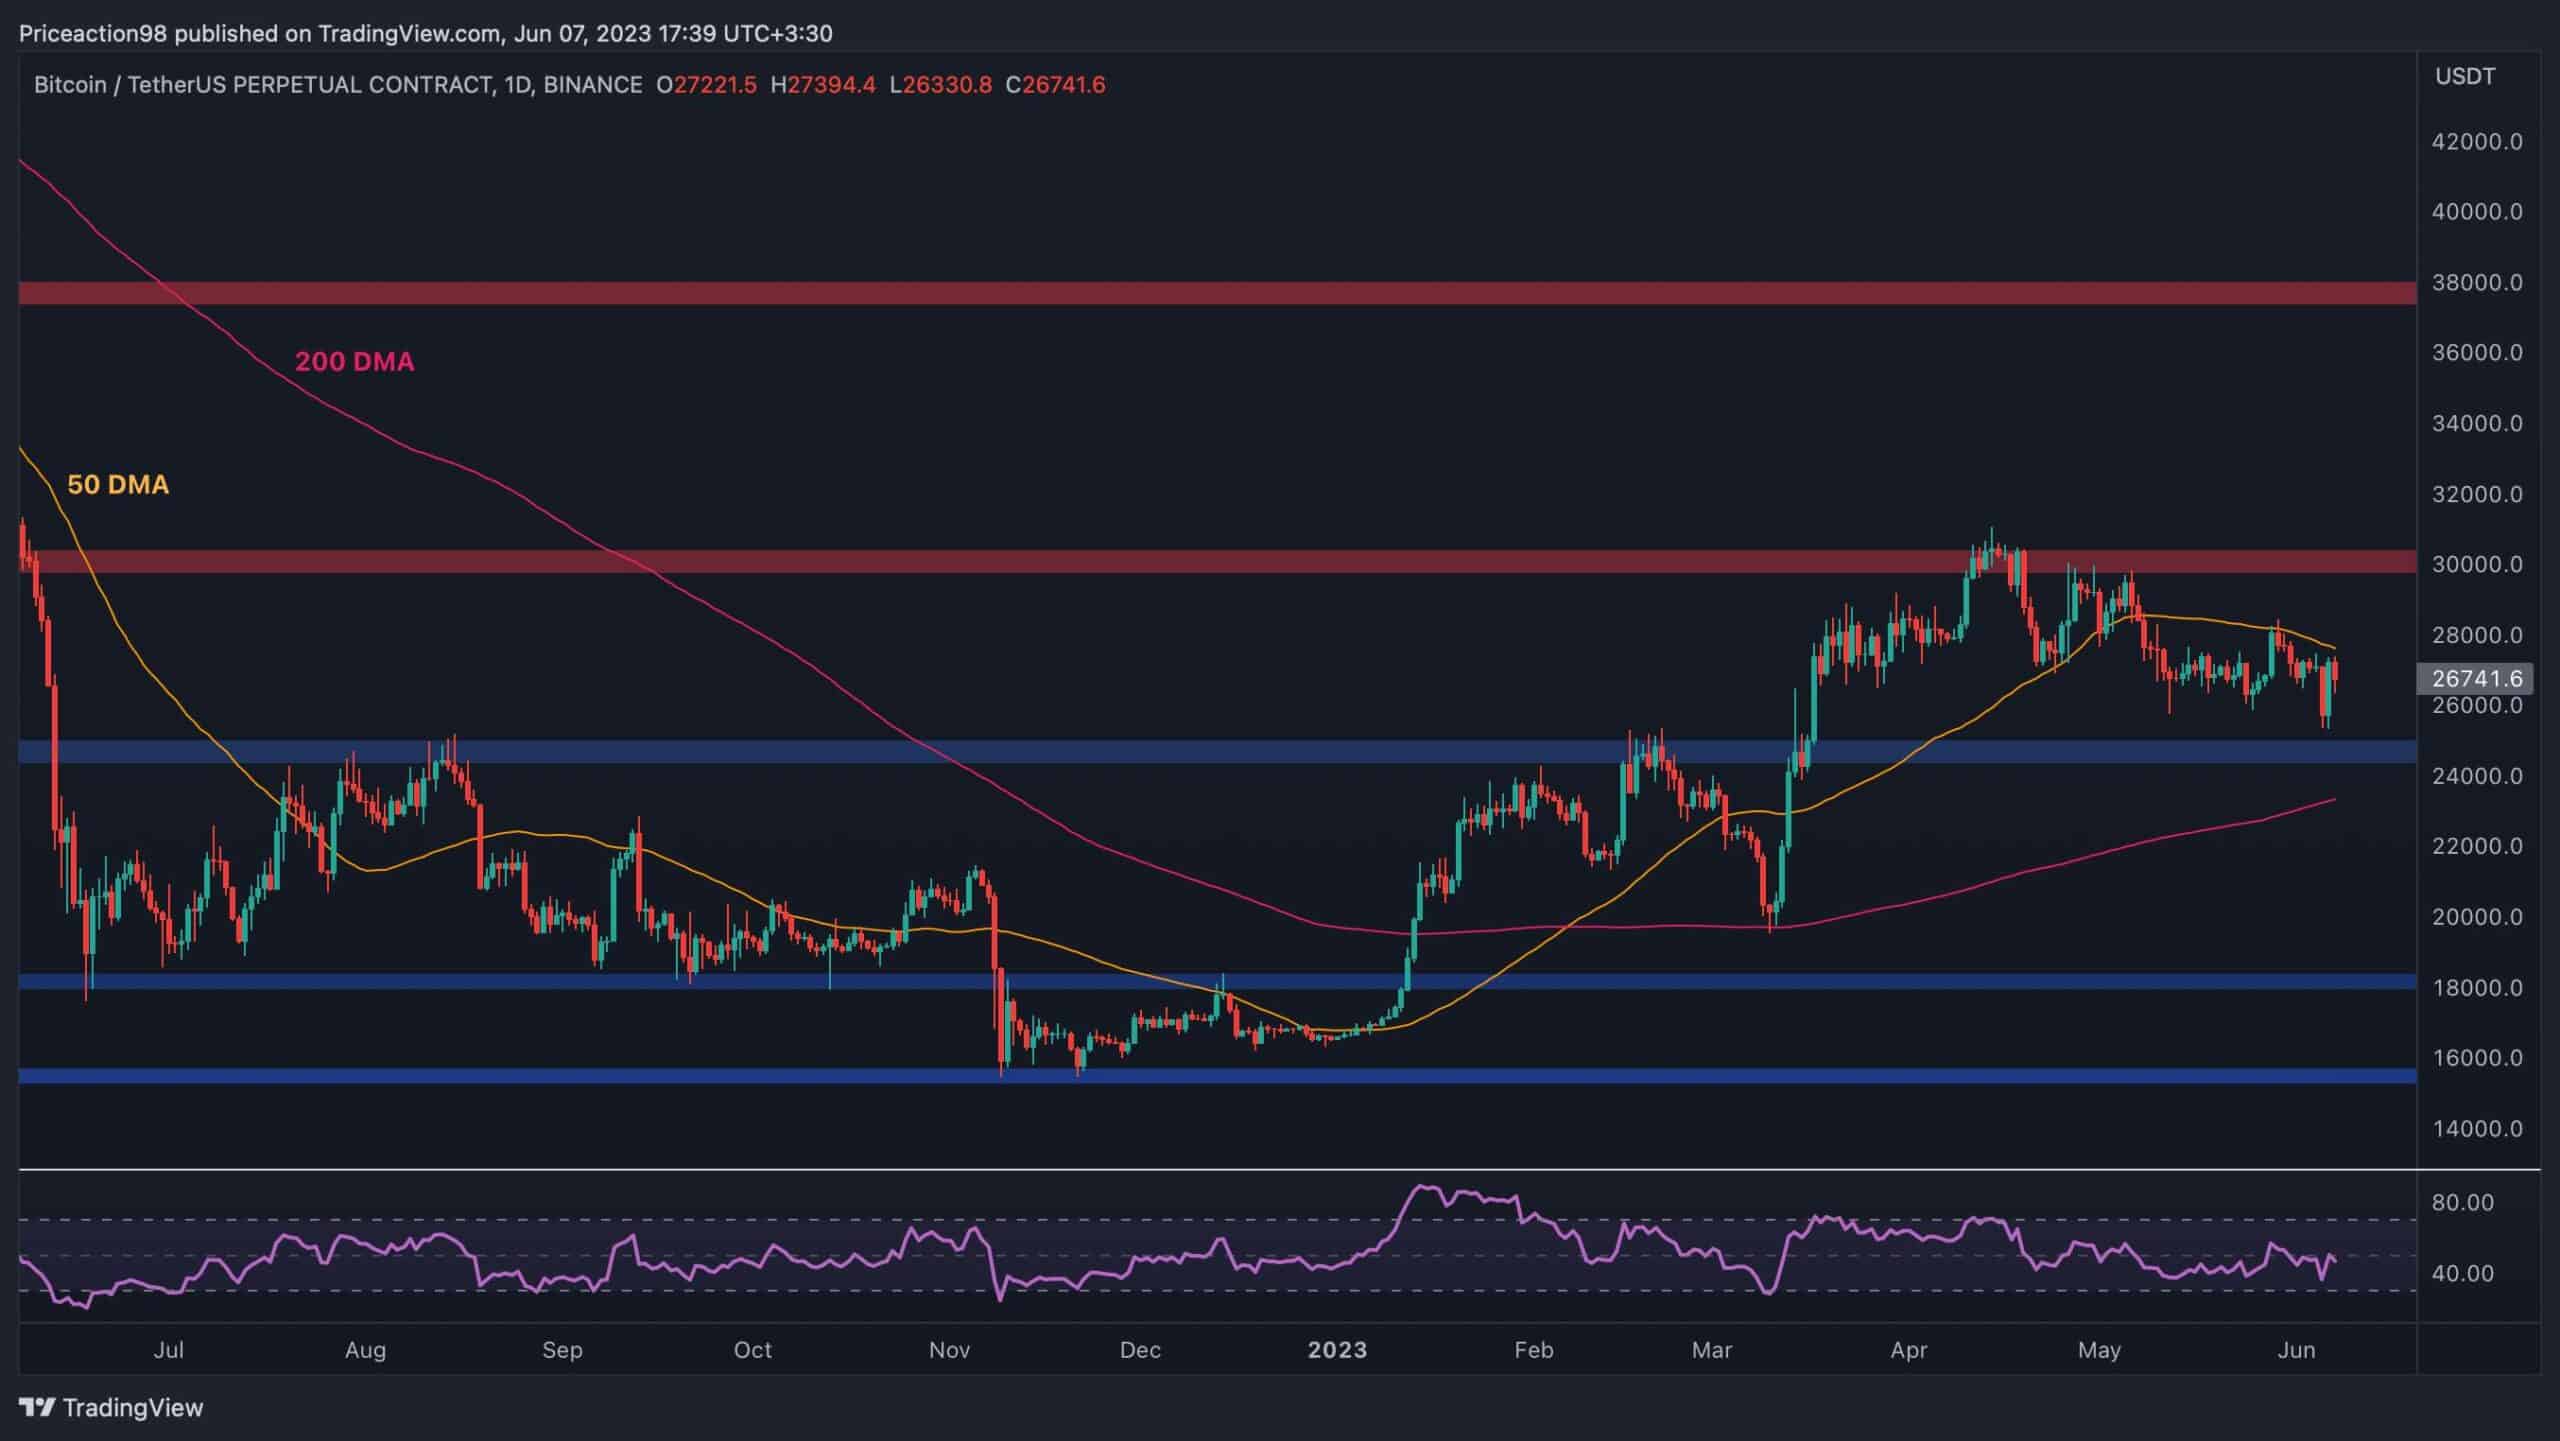
On the daily timeframe, the Bitcoin price has consistently formed lower highs and lows in the past couple of months. The 50-day moving average acted as a strong resistance, causing a downward rejection near the $28K level.
Following yesterday’s rebound, the price is testing the 50-day moving average again. A bullish breakout would result in a rally towards the $30K level, while another rejection would lead to a drop-down to the $25K support level and the key 200-day moving average located around the $24K mark.
 Source: TradingView### The 4-Hour Chart:
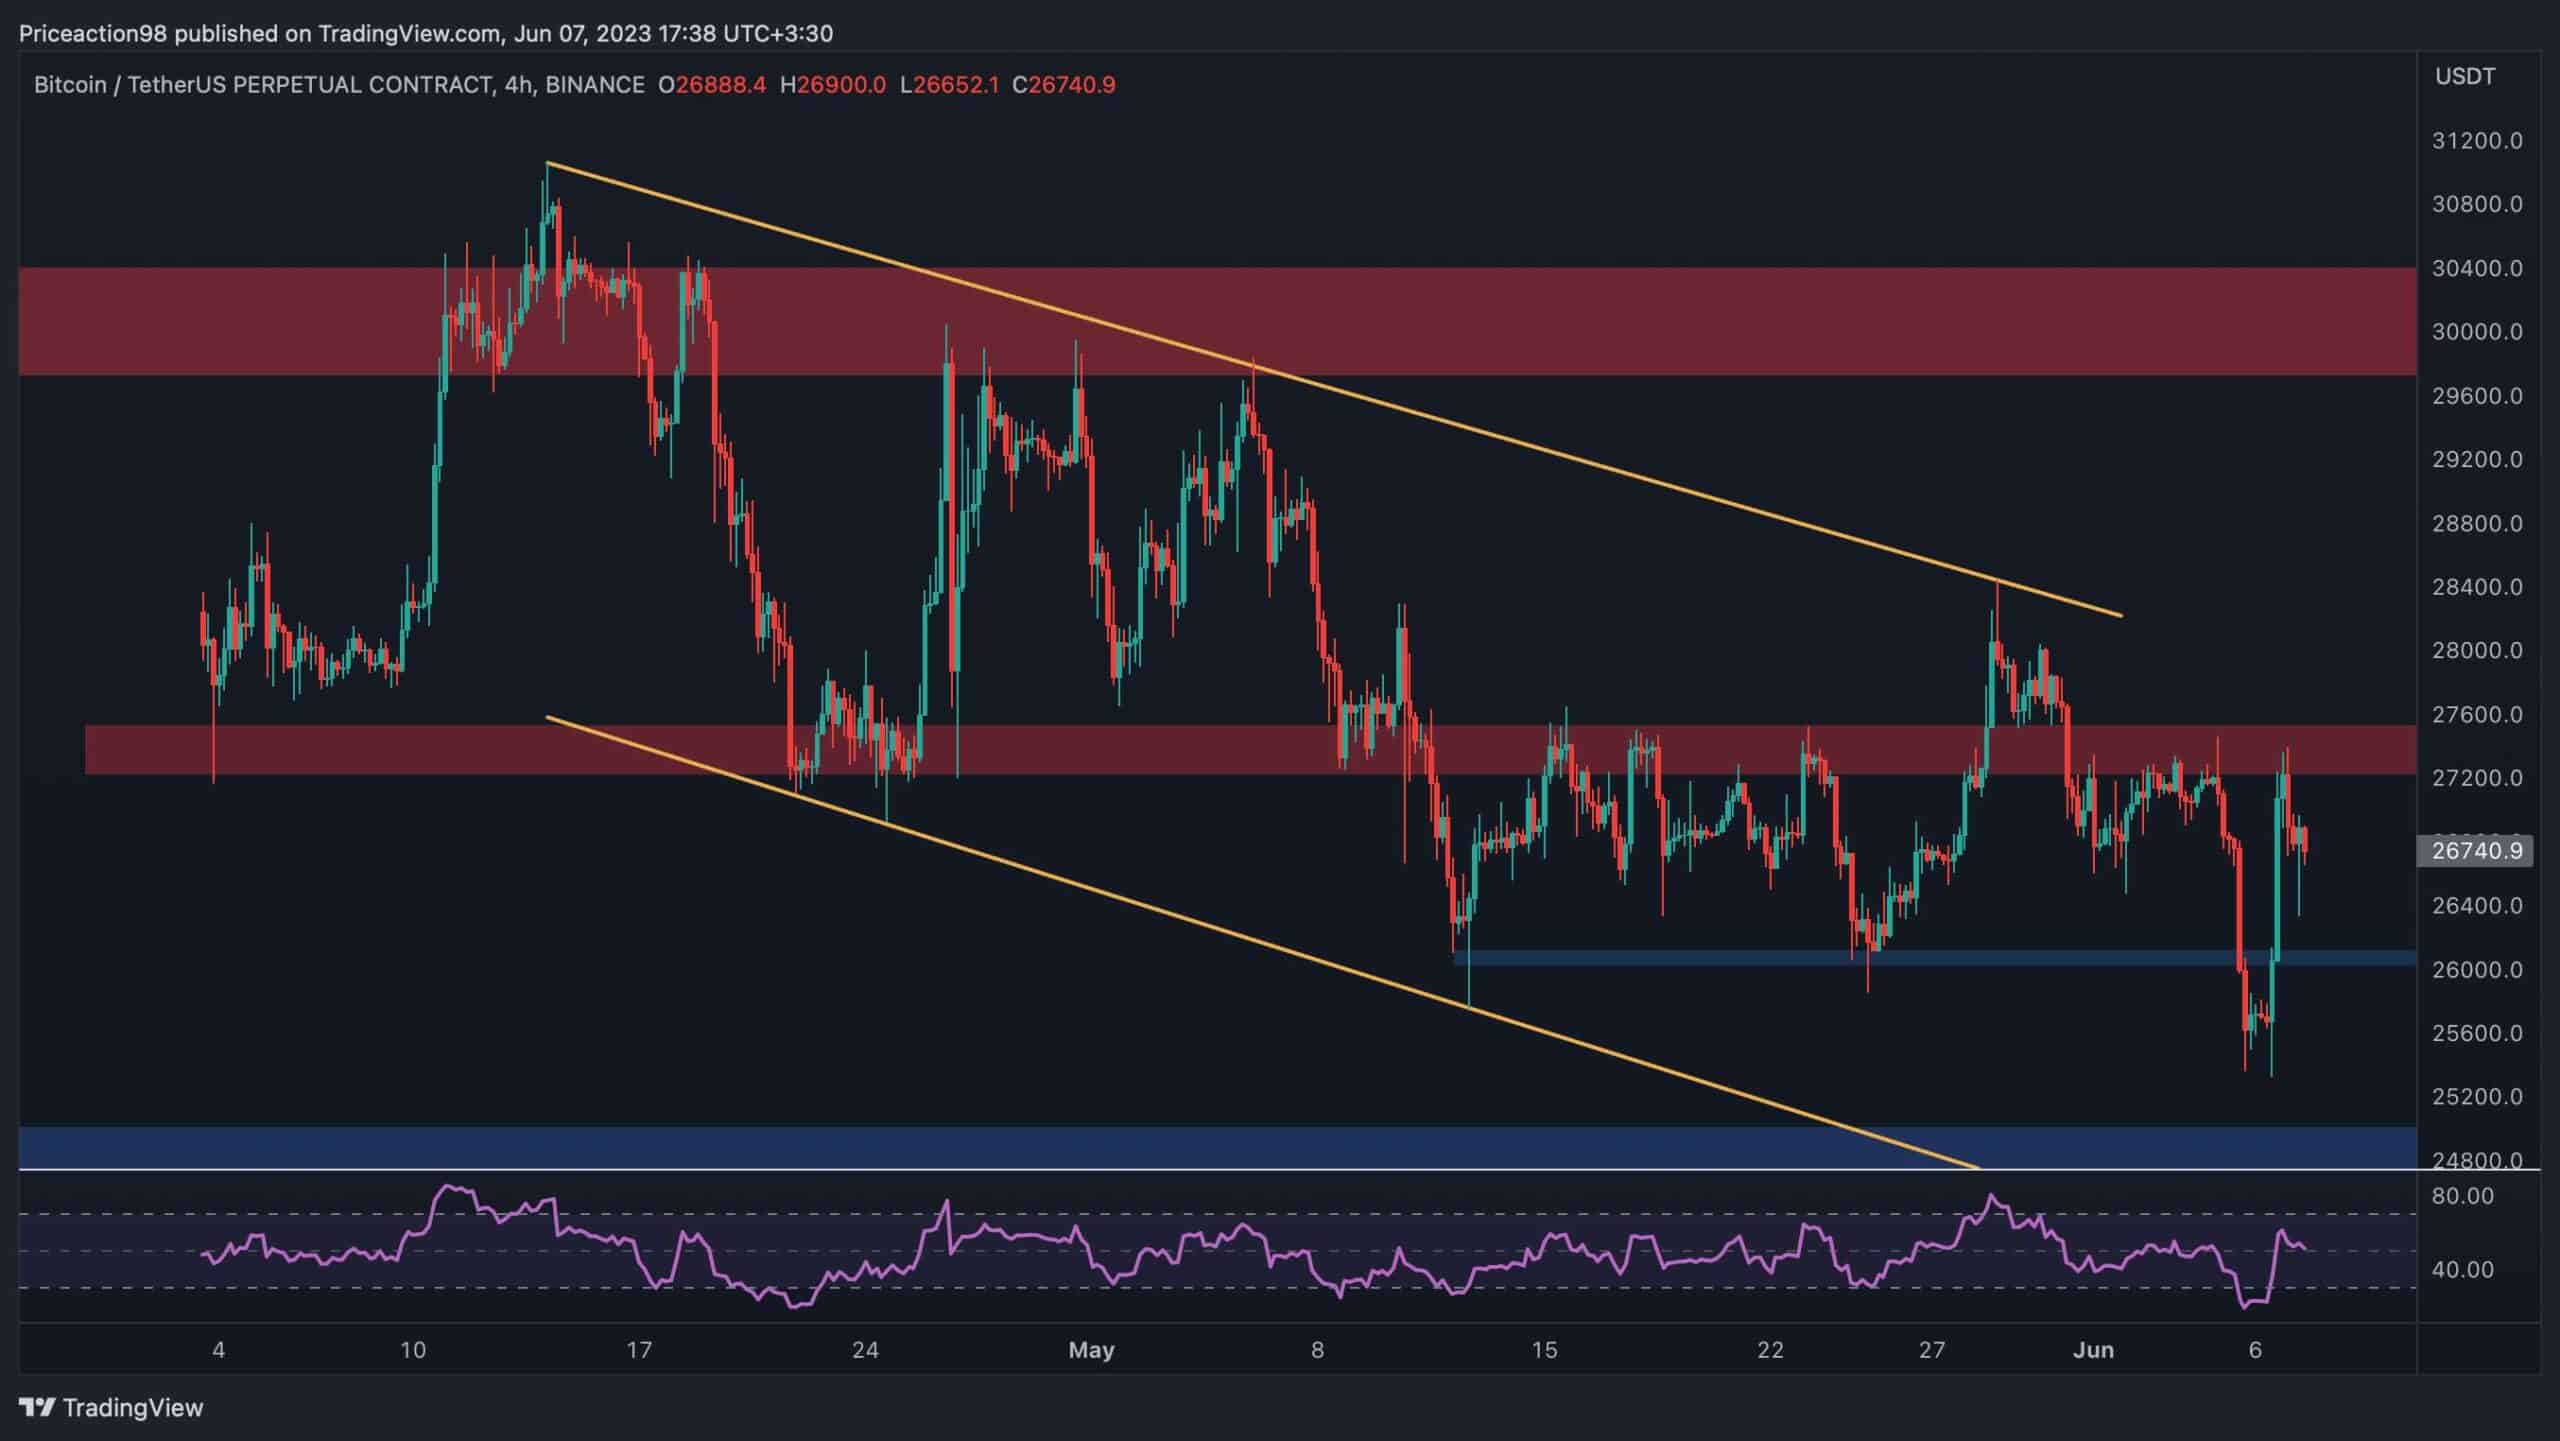
Looking at the 4-hour timeframe, it is clear that the Bitcoin price faced a significant barrier at the $27,500 resistance level and experienced a sharp decline thereafter. The short-term support level at $26K has also been breached, indicating a continued downward movement with strong momentum.
However, the BTC price has now reversed following the RSI’s overbought signal and is currently retesting the $27,500 resistance area. If it breaks above this point, the descending channel is likely to be broken as well, paving the way for the market to rise toward the $30K level once again.
 Source: tradingVIew## On-chain Analysis
By Shayan
While many were optimistic about the beginning of a bull market, a wave of fear and uncertainty spread through the industry because of what happened lately. On Monday, the Securities and Exchange Commission (SEC) filed a lawsuit against Binance, leading to a 5% drop in the price of Bitcoin. The next day, it field a lawsuit against Coinbase as well.
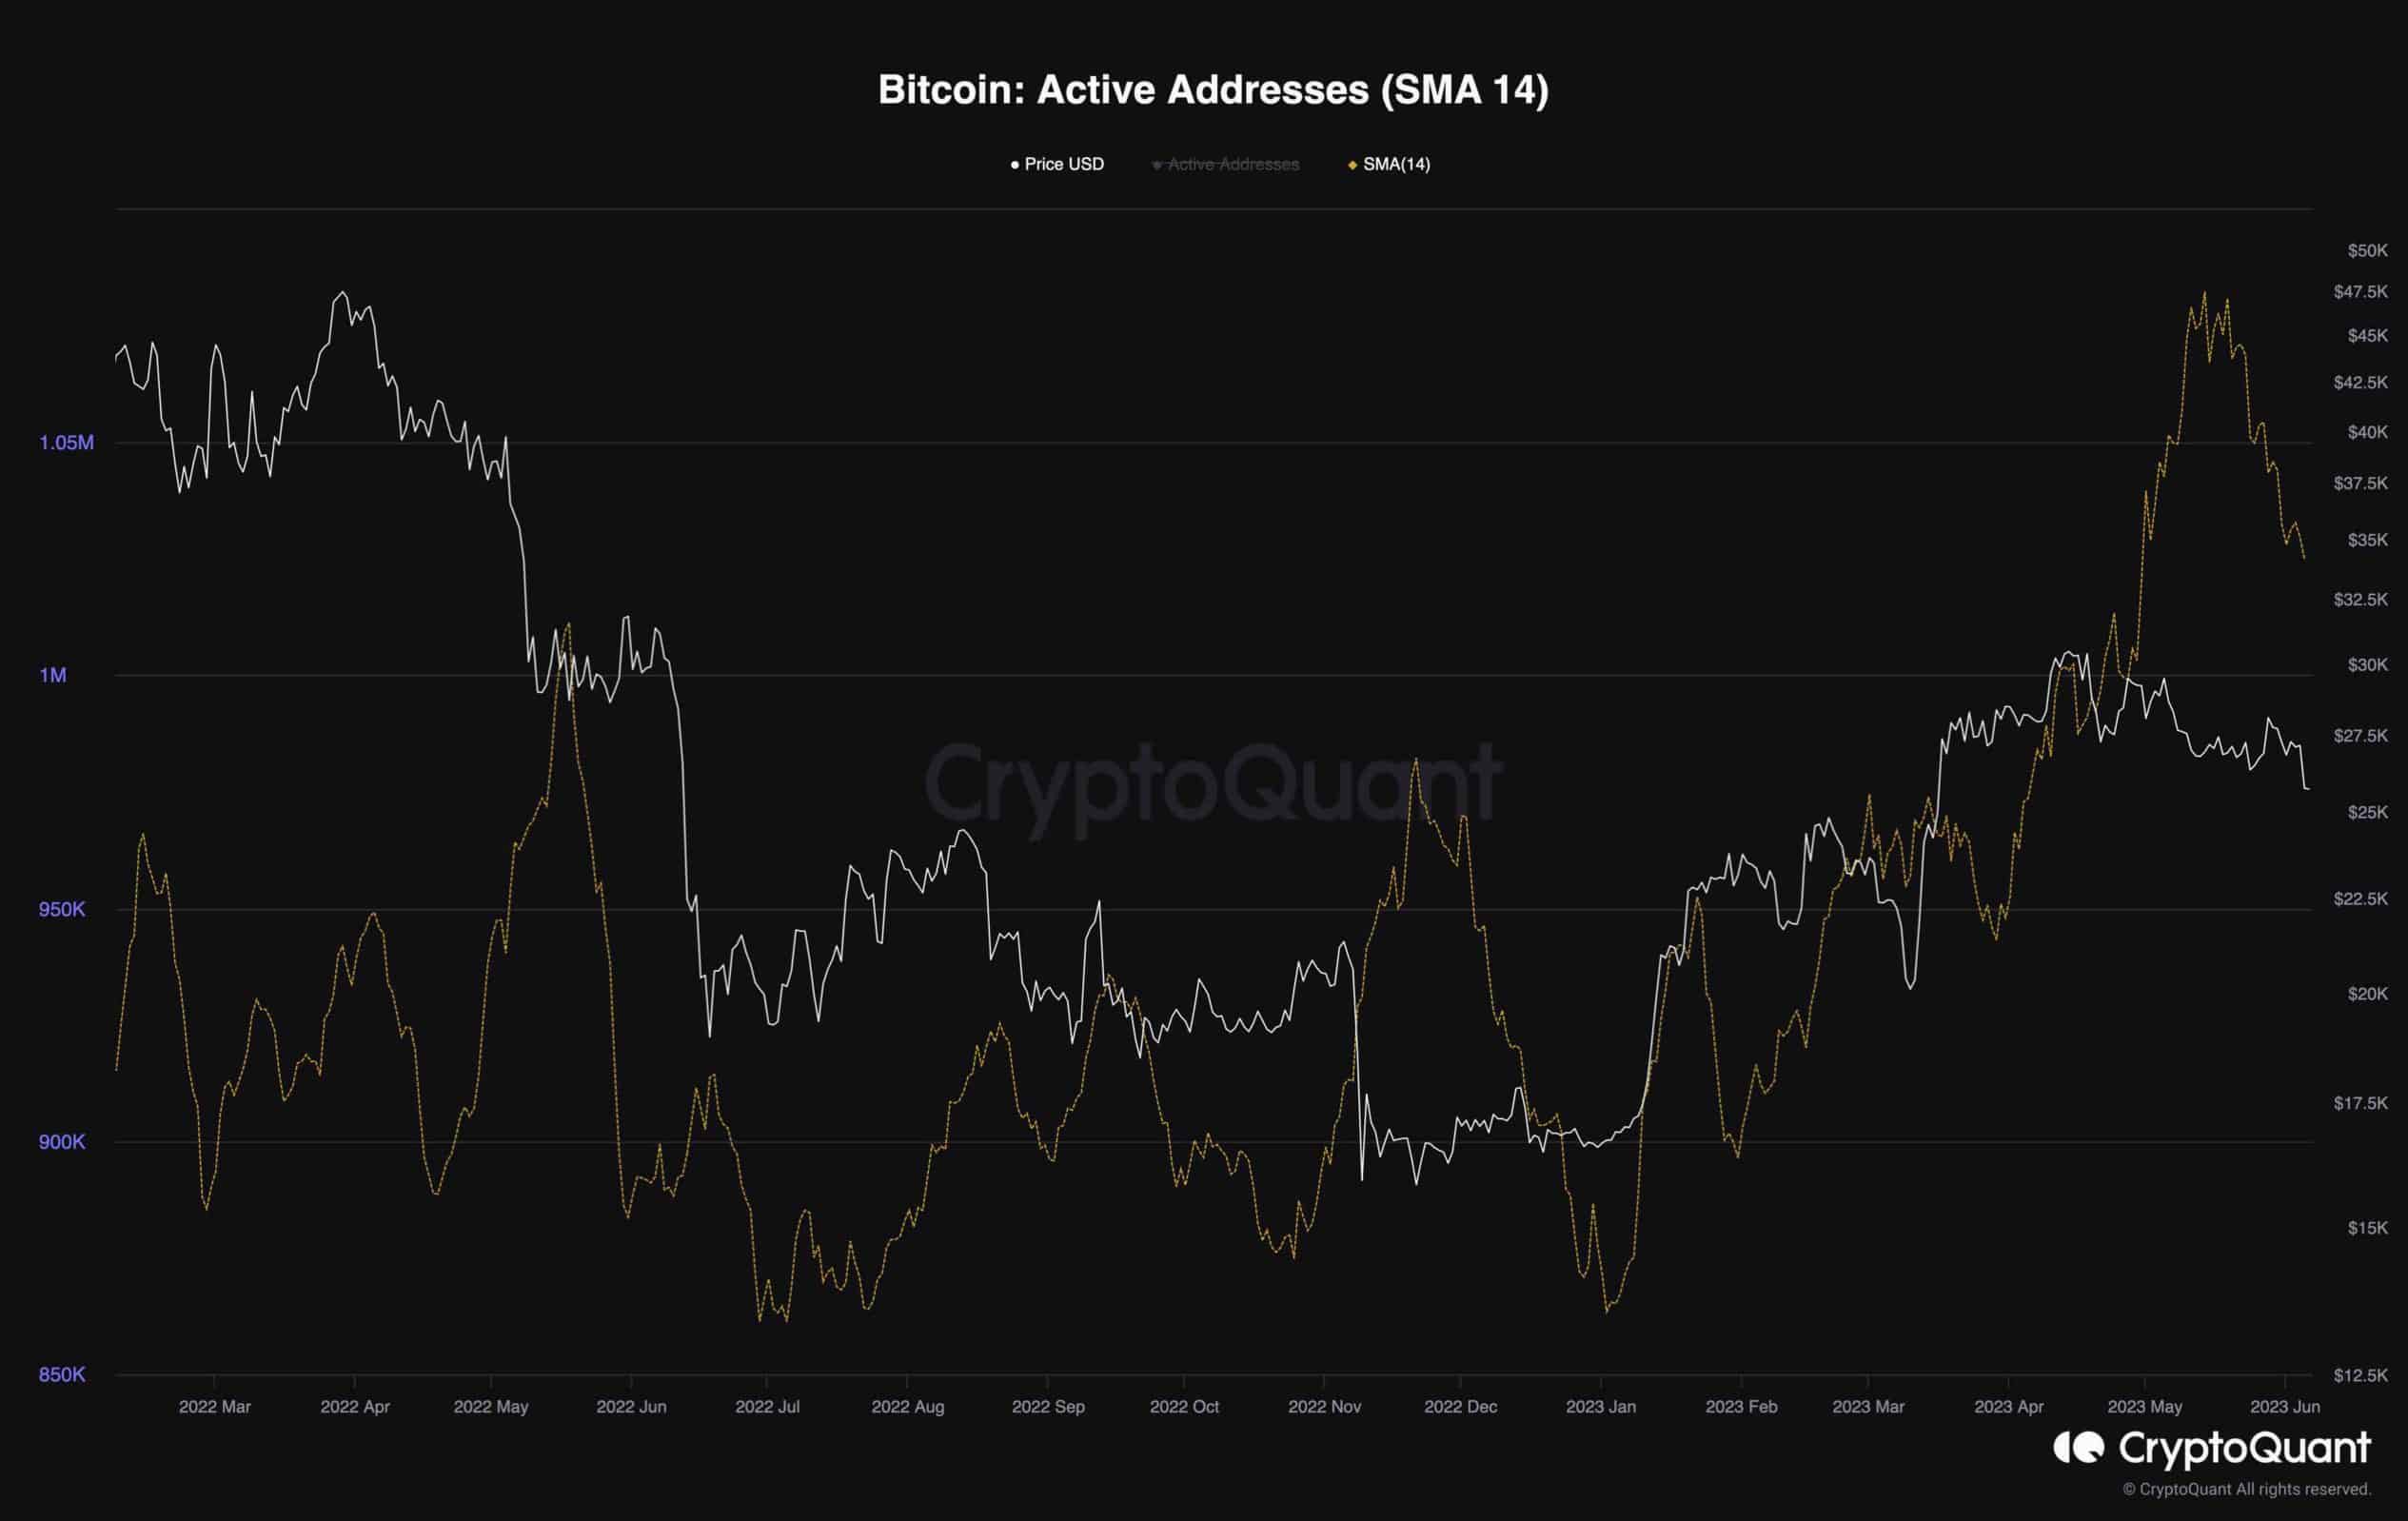
A graph representing the Active Addresses metric, which indicates the number of participants actively engaging with Bitcoin’s network alongside the price, provides valuable insights. The chart demonstrates an upward trend, signaling a positive outlook for network activity and the demand for Bitcoin.
Unfortunately, this trend has recently reversed, and the metric is now experiencing a significant decline, primarily attributed to the recent FUD.
 Source: CryptoQuant
Penafian: Informasi di halaman ini dapat berasal dari pihak ketiga dan tidak mewakili pandangan atau opini Gate. Konten yang ditampilkan hanya untuk tujuan referensi dan bukan merupakan nasihat keuangan, investasi, atau hukum. Gate tidak menjamin keakuratan maupun kelengkapan informasi dan tidak bertanggung jawab atas kerugian apa pun yang timbul akibat penggunaan informasi ini. Investasi aset virtual memiliki risiko tinggi dan rentan terhadap volatilitas harga yang signifikan. Anda dapat kehilangan seluruh modal yang diinvestasikan. Harap pahami sepenuhnya risiko yang terkait dan buat keputusan secara bijak berdasarkan kondisi keuangan serta toleransi risiko Anda sendiri. Untuk detail lebih lanjut, silakan merujuk ke
Penafian.