Calm Before the Storm? BTC Attempts to Push Above $27K (Bitcoin Price Analysis)
CryptoPotato
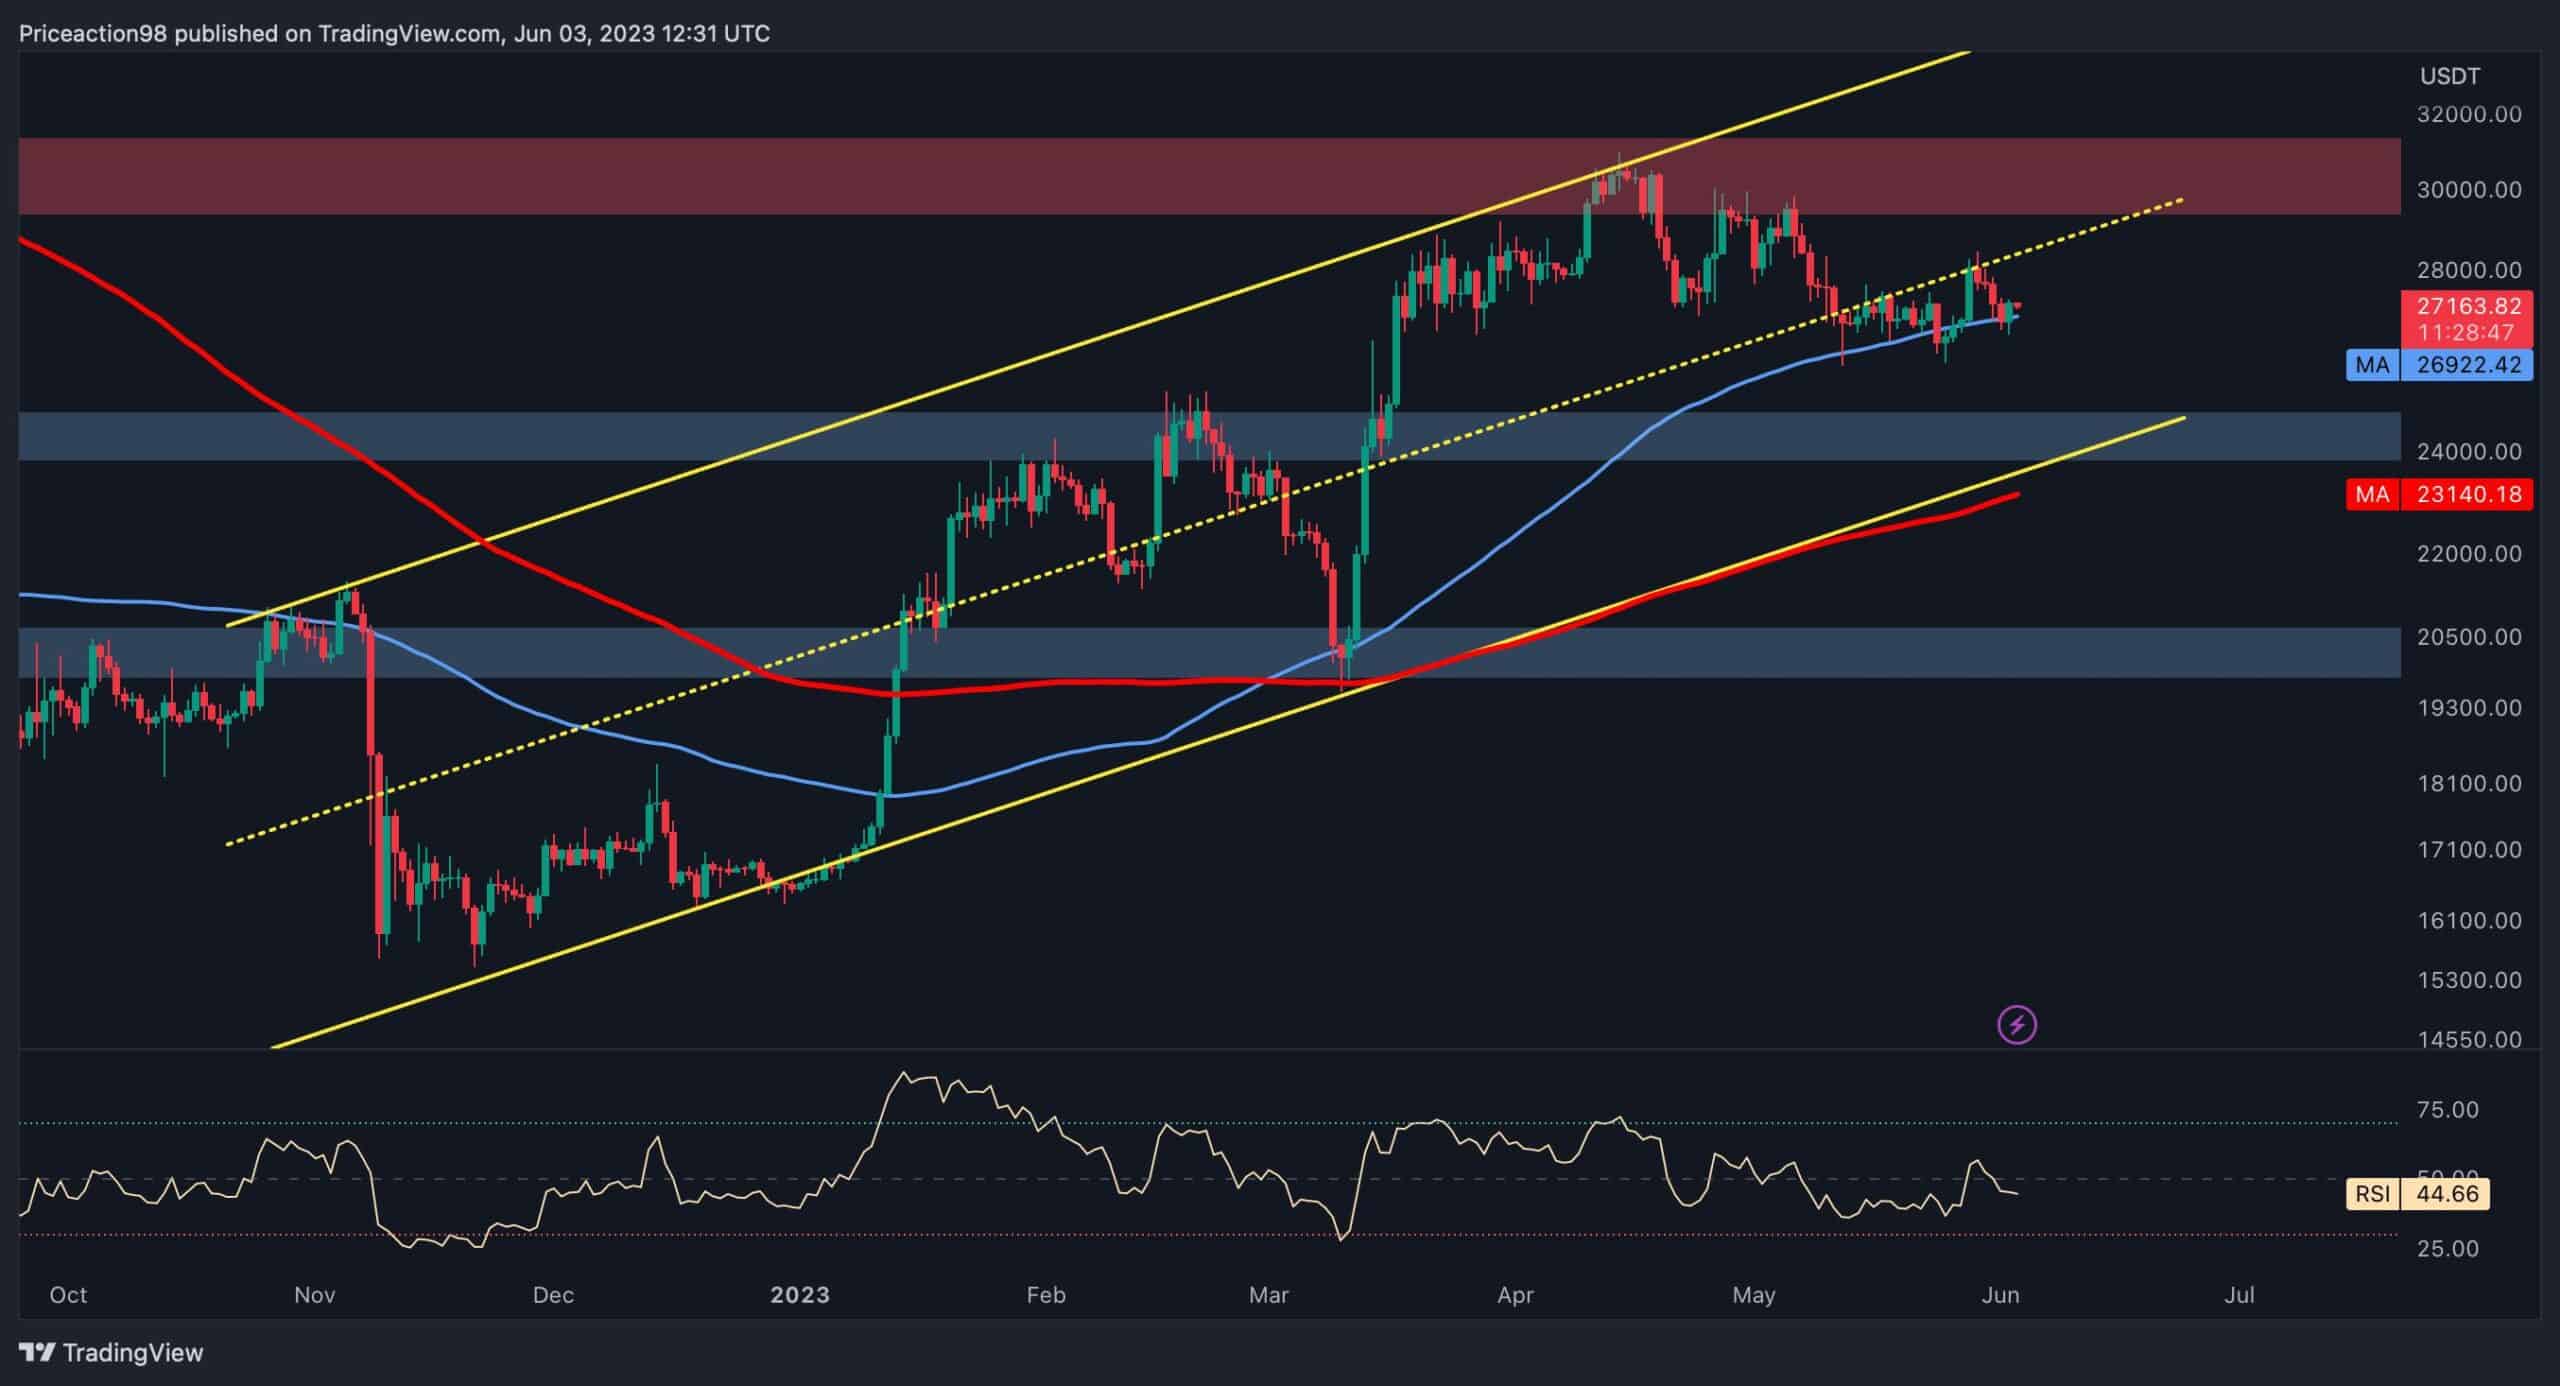
Bitcoin’s price is currently going through a phase of consolidation and has reached the 100-day moving average of $26,922. However, two significant support areas ahead on its path could potentially halt the ongoing decline and trigger the next bullish rally.
Technical Analysis
By Shayan
The Daily Chart
During the consolidation correction stage, BTC dipped slightly below the middle trendline of the ascending channel and tested it as a pullback. However, the Bitcoin price continued the downtrend by printing small consecutive red candles and temporarily stalled at the 100-day moving average of $26.9K.
If it falls below the 100-day moving average, the lower threshold of the channel of around $24K and the 200-day moving average of $23K could be potential price targets.
On the other hand, if Bitcoin finds support at the 100-day moving average, an attempt to surpass the significant resistance level at $30K will be the most likely scenario.
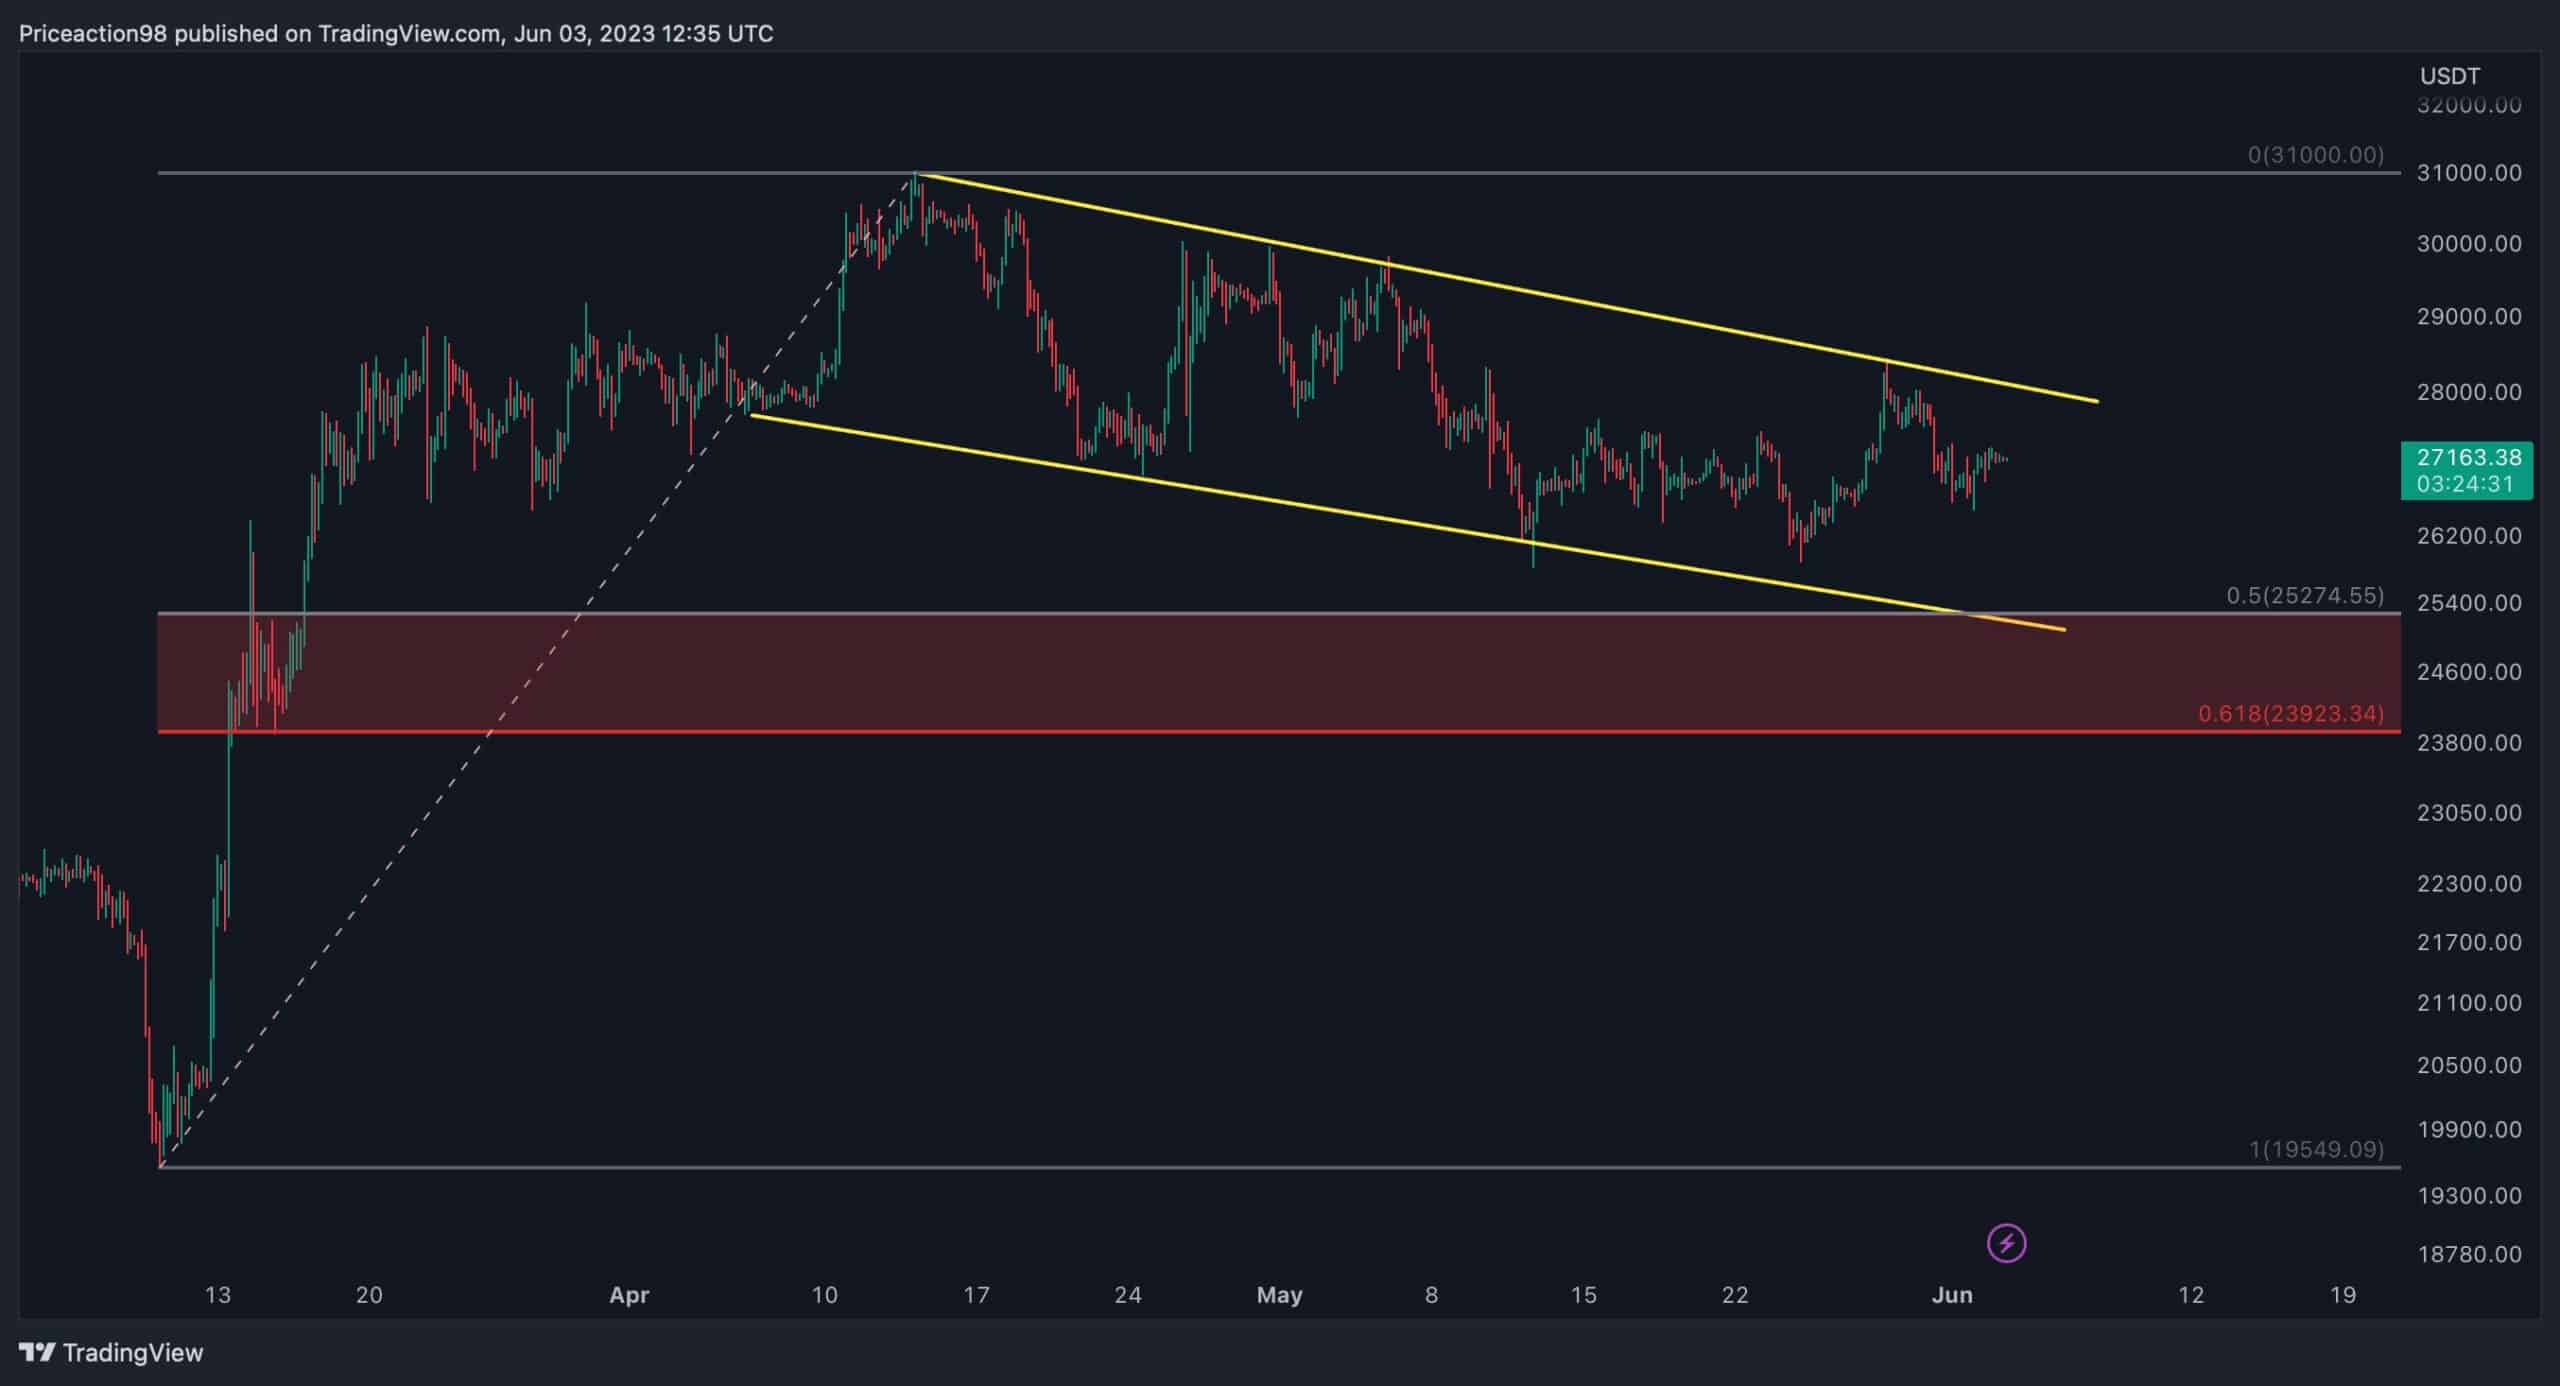
Analyzing the 4-hour timeframe, a flag pattern has been developed during the recent correction phase of the market. Bitcoin’s price is currently consolidating within this flag, forming lower highs and lower lows.
However, there is a substantial support area between the 61.8% ($23,923) and 50% ($25,274) levels of the Fibonacci retracement. These two well-known Fibonacci levels indicate potential targets for correction stages. Given the market situation, it is likely that the price will continue the correction leg until it reaches this critical support zone.
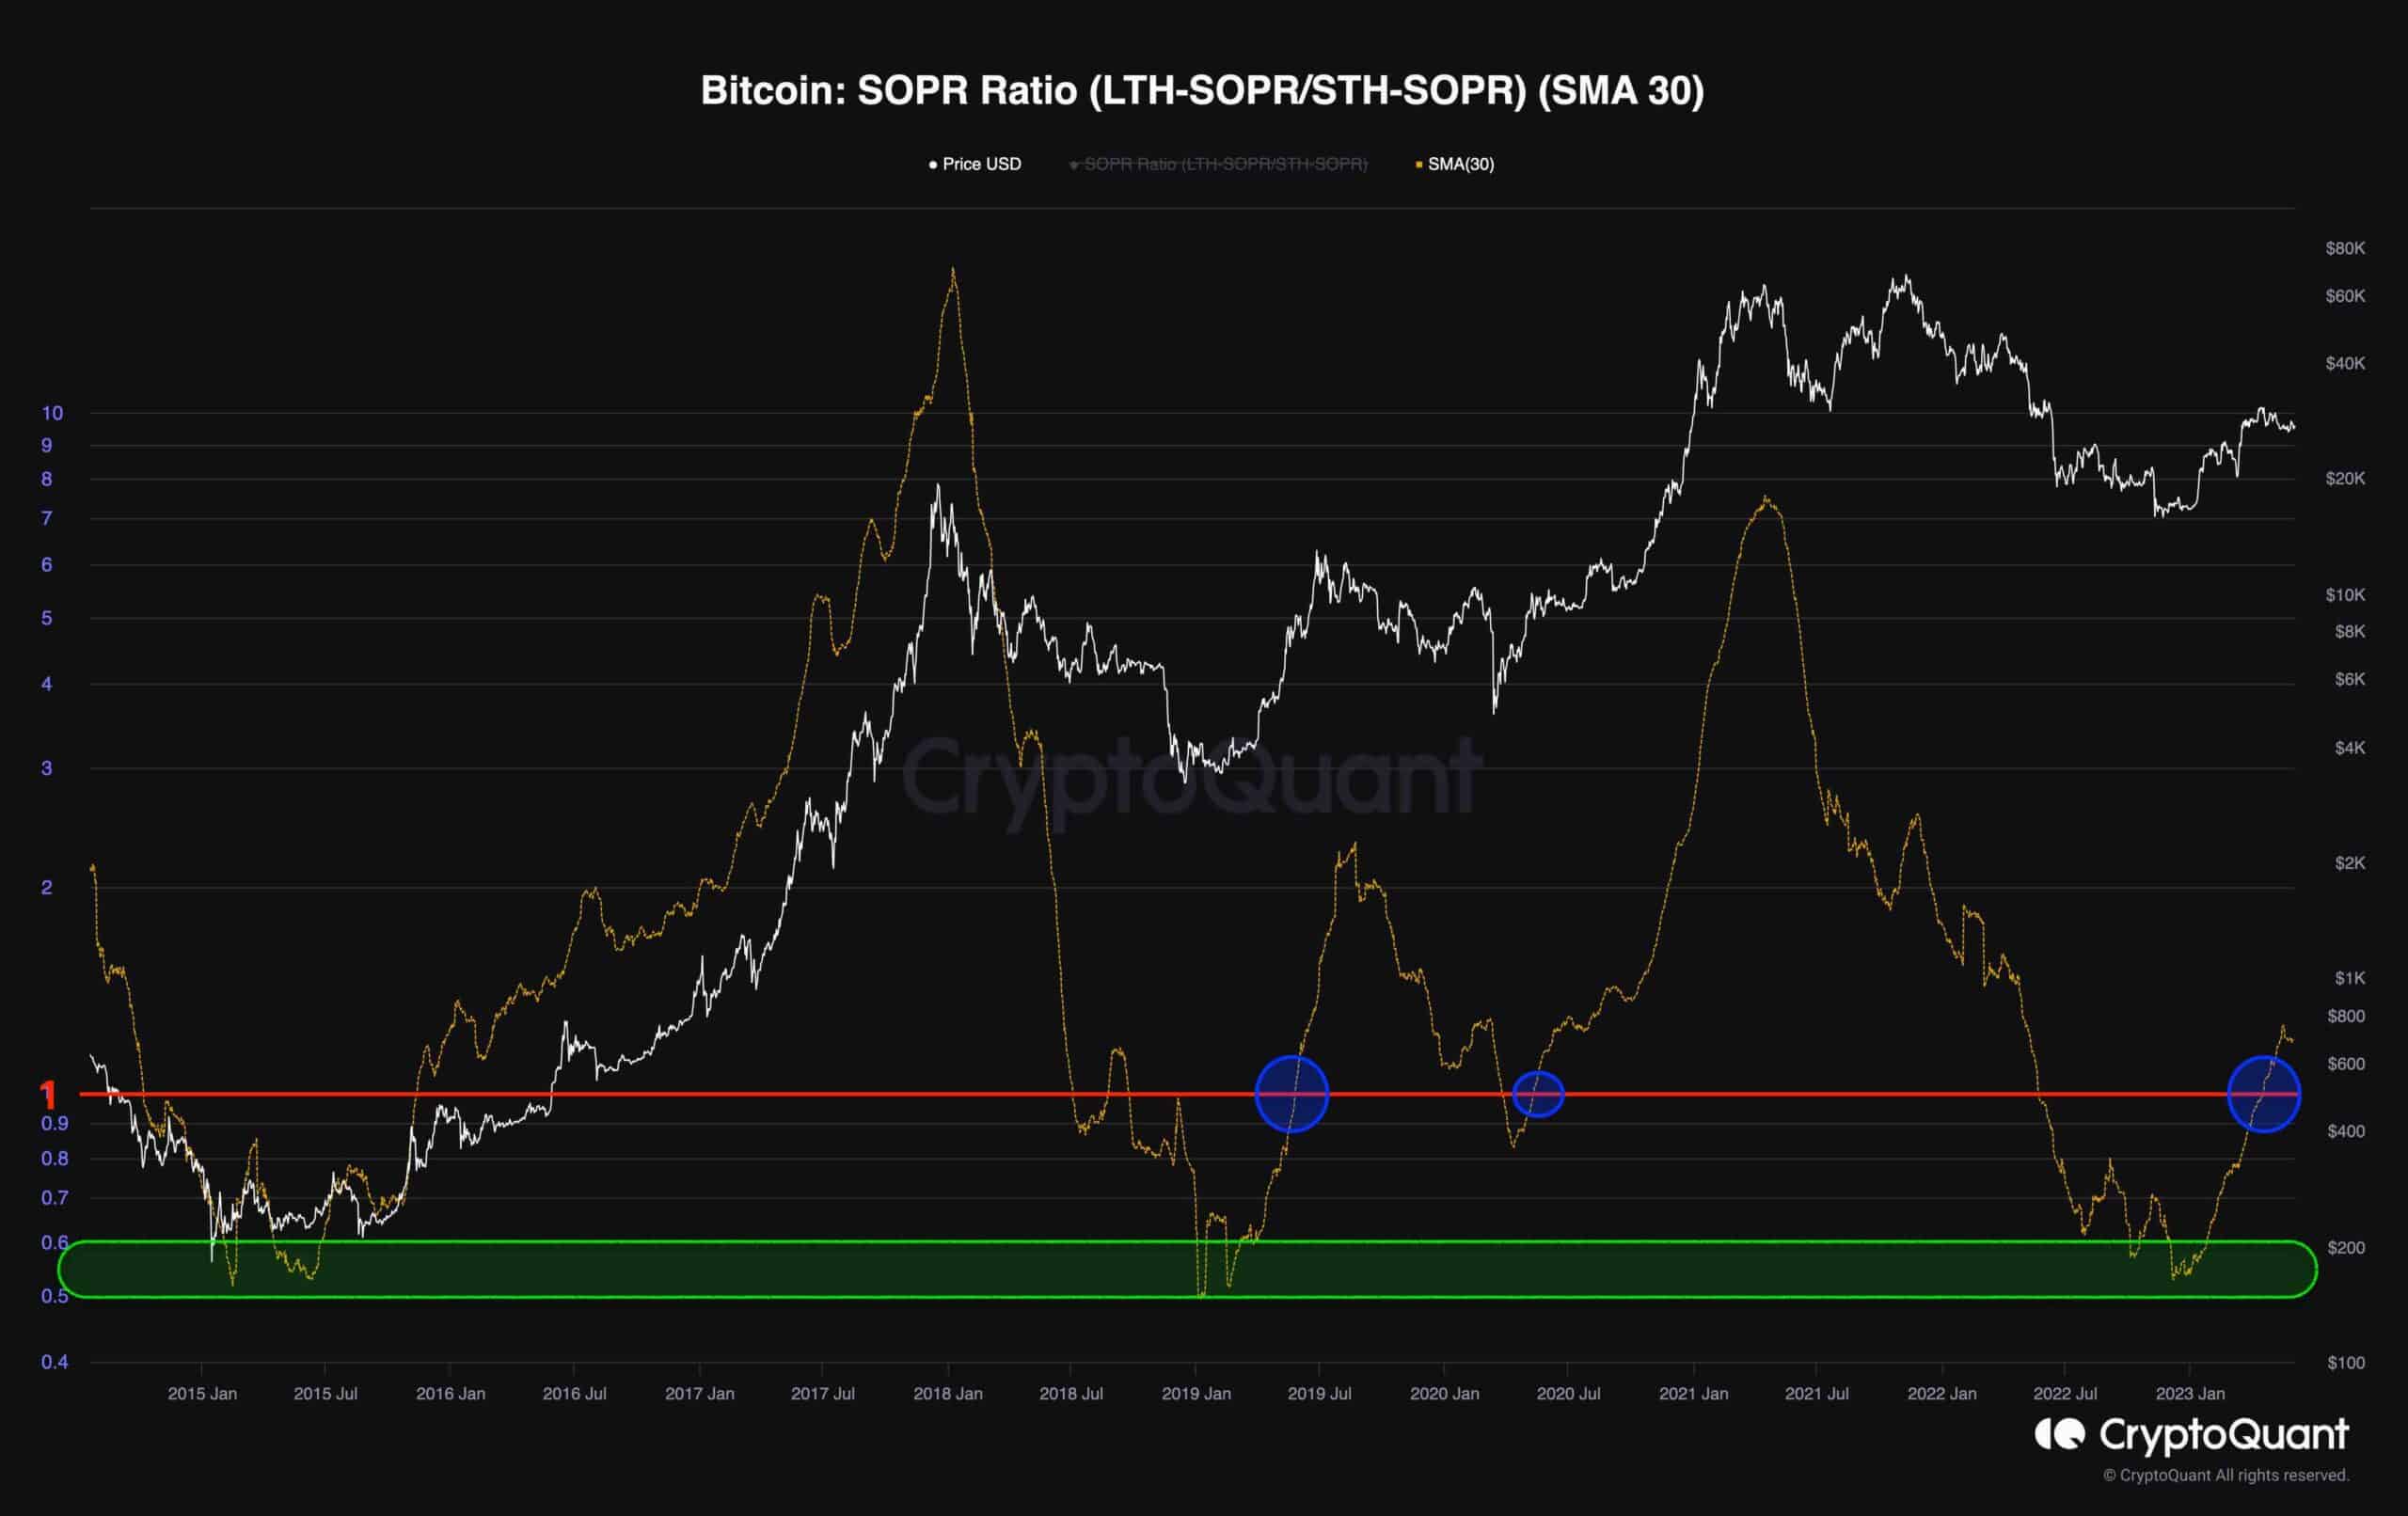
The following chart demonstrates the SOPR ratio metric alongside Bitcoin’s price since the 2015 bear market. The SOPR ratio is measured by dividing the values of long-term holders’ SOPR values by short-term holders. It has consistently signaled long-term investment opportunities, as in the previous two bearish cycles in 2015 and 2019.
This ratio reached its lowest point since 2019 – around 0.53 – in December 2022, indicating the onset of a bullish stage in the market. Currently, it is experiencing an uptrend, surpassing 1, which has historically coincided with successful bull runs in the cryptocurrency market.
Although it is uncertain whether the bull market has concluded, as long as the SOPR Ratio remains above one, the buyers are expected to continue dominating.
免責事項:このページの情報は第三者から提供される場合があり、Gateの見解または意見を代表するものではありません。このページに表示される内容は参考情報のみであり、いかなる金融、投資、または法律上の助言を構成するものではありません。Gateは情報の正確性または完全性を保証せず、当該情報の利用に起因するいかなる損失についても責任を負いません。仮想資産への投資は高いリスクを伴い、大きな価格変動の影響を受けます。投資元本の全額を失う可能性があります。関連するリスクを十分に理解したうえで、ご自身の財務状況およびリスク許容度に基づき慎重に判断してください。詳細は免責事項をご参照ください。
コメント
0/400
コメントなし