Ripple Explodes 11% Weekly But Bulls Must Now Focus on This Resistance (XRP Price Analysis)
CryptoPotato
In recent weeks, Ripple’s price has displayed an upward trend, recovering from a notable support level. However, there is still a crucial resistance level that must fall for the market to enter a bullish phase in the coming months.
Technical Analysis
By: Edris
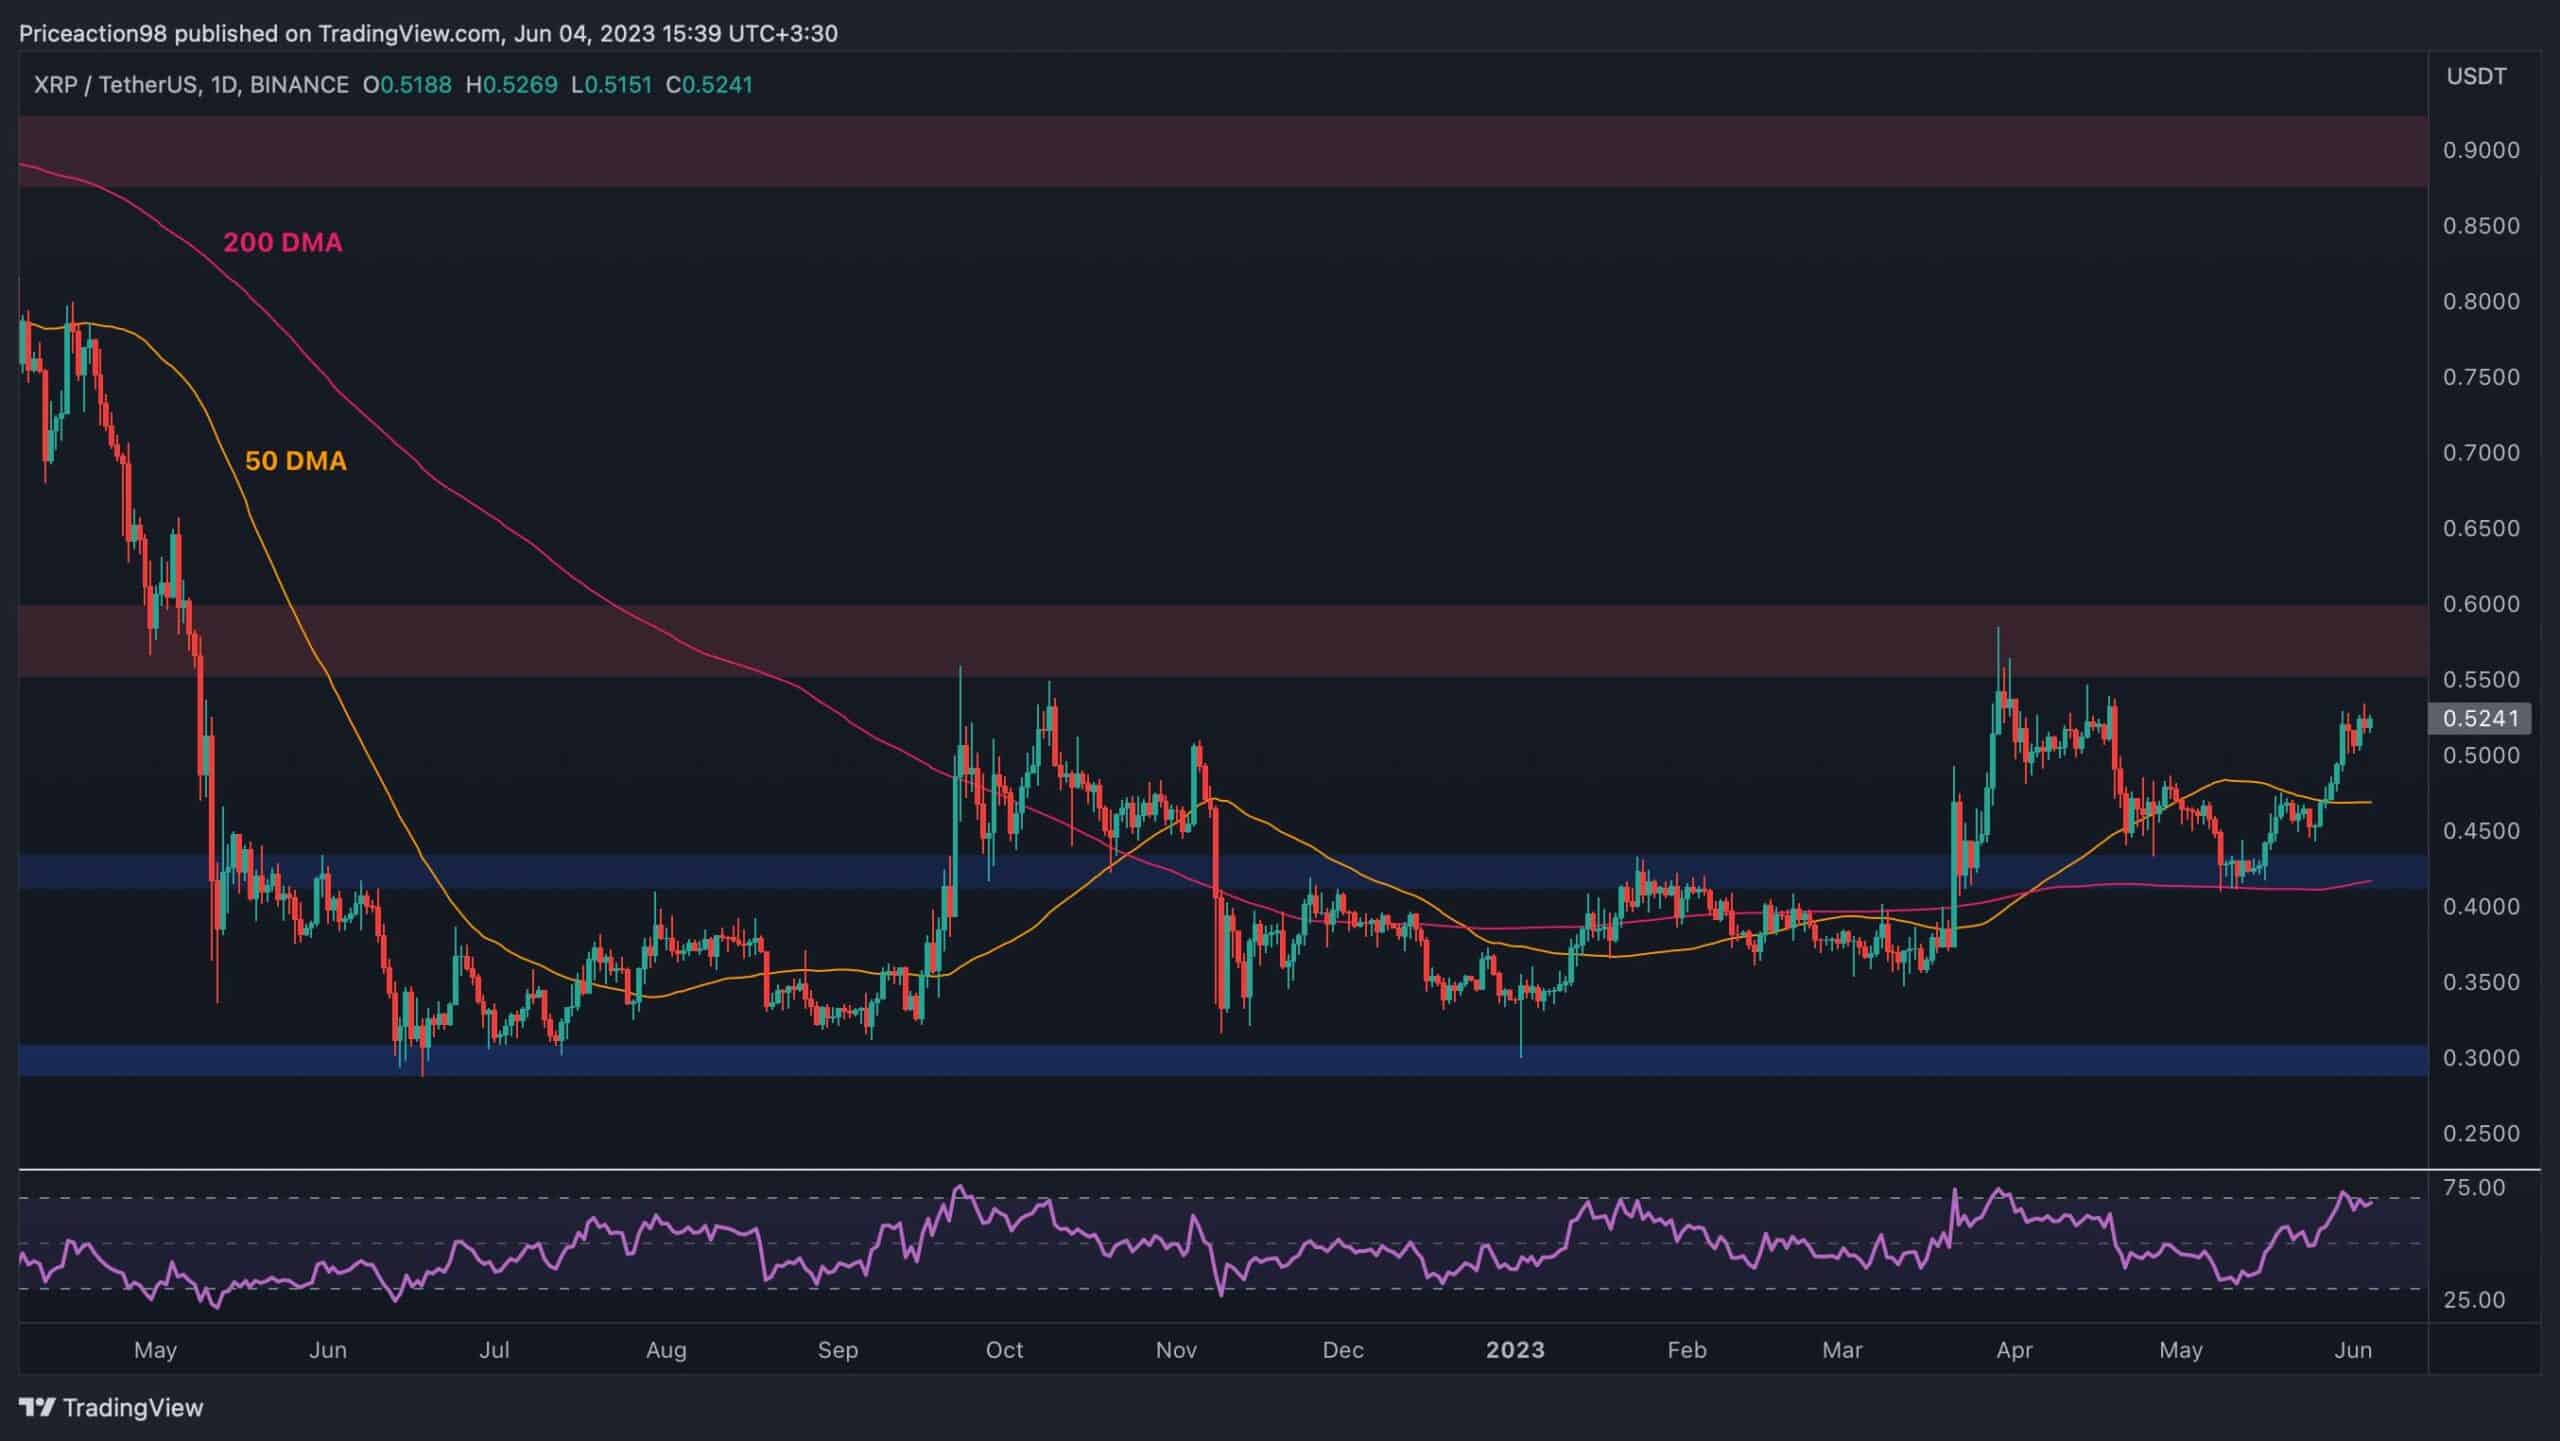
XRP/USDT Daily Chart:
The XRP price has consistently increased after bouncing back from the $0.43 support. This level has also been reinforced by the 200-day moving average, while the price has surpassed the 50-day moving average at around $0.47.
Ripple is currently approaching the $0.6 resistance level, and a successful breakthrough could trigger a potential rally toward $0.9 in the coming months. However, it’s worth noting that the RSI has entered the overbought zone, indicating a potential correction in the near future.
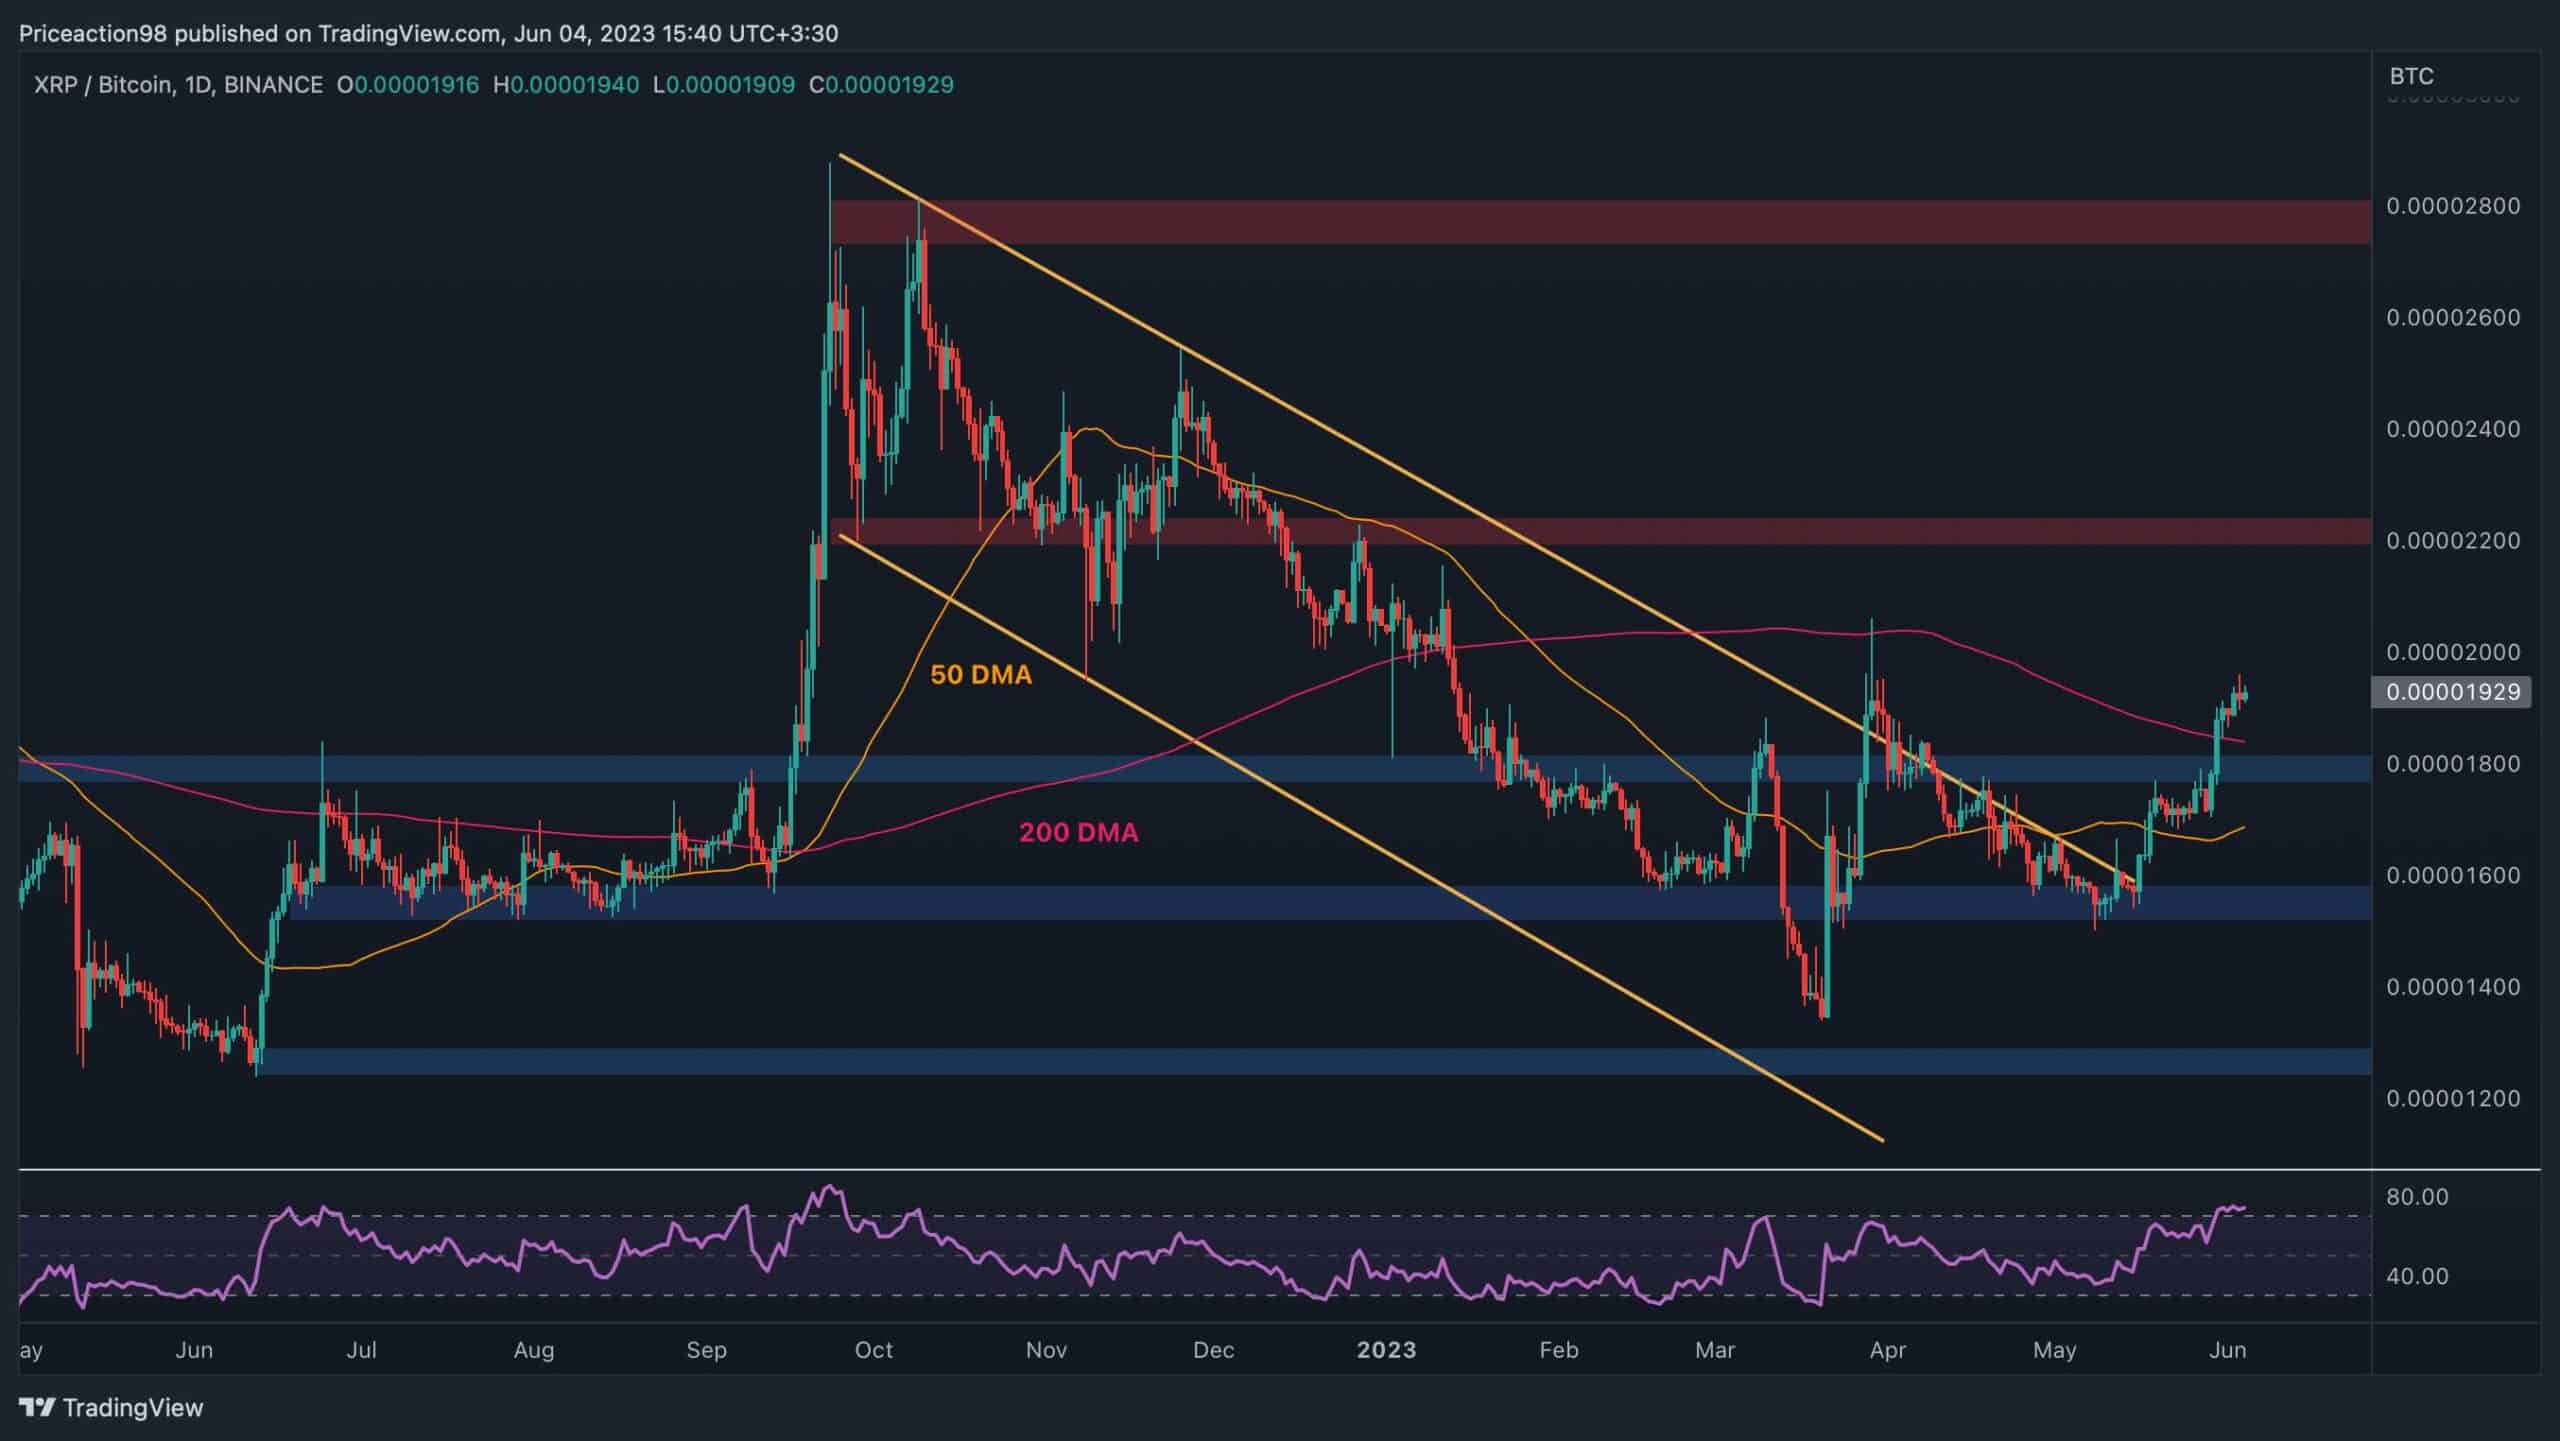
Looking at the BTC paired chart, there is a notable upward trend after the price successfully broke out of the significant descending channel. The 0.000017 SAT and 0.000019 SAT levels, representing the 50-day and 200-day moving averages, respectively, have both been surpassed, indicating positive momentum.
Currently, the Ripple price is approaching the psychological resistance level at 0.00002 SAT. However, it is important to note that the RSI indicator is signaling overbought conditions, implying a potential correction in the near term prior to any further upward movement.
免責事項:このページの情報は第三者から提供される場合があり、Gateの見解または意見を代表するものではありません。このページに表示される内容は参考情報のみであり、いかなる金融、投資、または法律上の助言を構成するものではありません。Gateは情報の正確性または完全性を保証せず、当該情報の利用に起因するいかなる損失についても責任を負いません。仮想資産への投資は高いリスクを伴い、大きな価格変動の影響を受けます。投資元本の全額を失う可能性があります。関連するリスクを十分に理解したうえで、ご自身の財務状況およびリスク許容度に基づき慎重に判断してください。詳細は免責事項をご参照ください。
コメント
0/400
コメントなし