How Will The SEC Fiasco Impact Bitcoin and What_s Next? (BTC Price Analysis)
CryptoPotato
The price of Bitcoin is currently on a downward trajectory since it faced resistance at $30K in April. However, there are notable support levels that may prevent further decline.
Technical Analysis
By: Edris
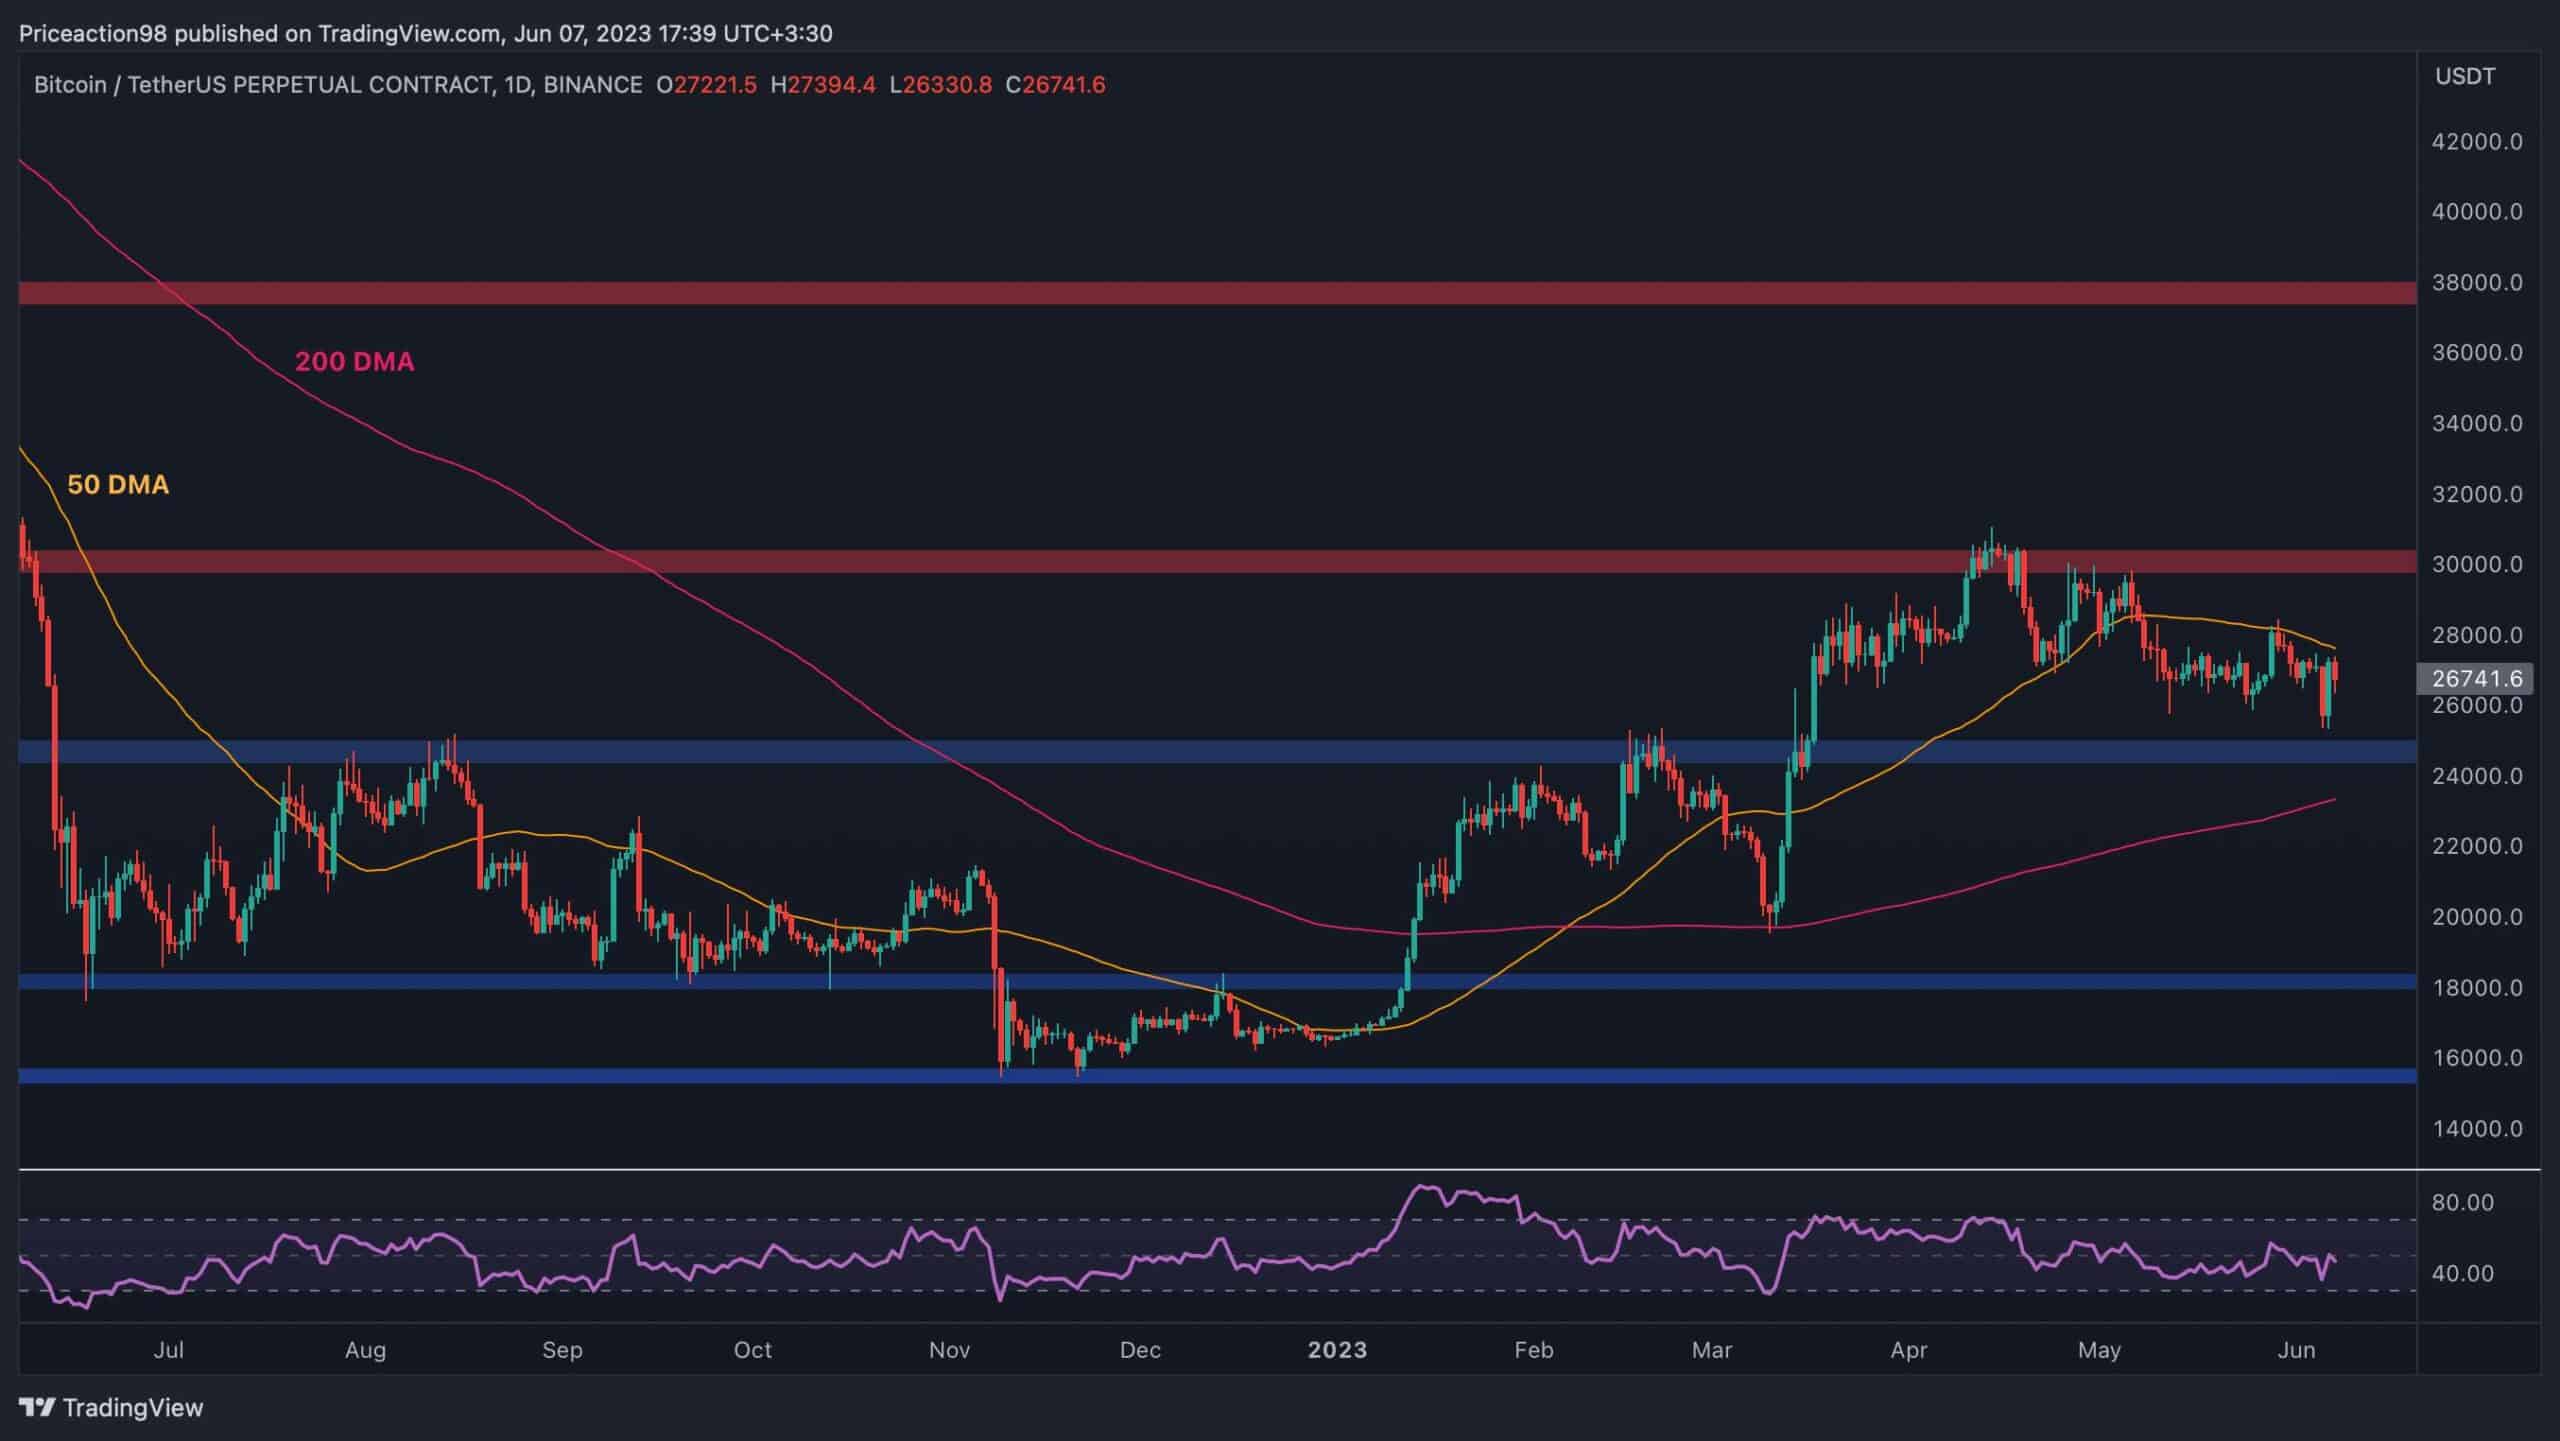
The Daily Chart:
On the daily timeframe, the Bitcoin price has consistently formed lower highs and lows in the past couple of months. The 50-day moving average acted as a strong resistance, causing a downward rejection near the $28K level.
Following yesterday’s rebound, the price is testing the 50-day moving average again. A bullish breakout would result in a rally towards the $30K level, while another rejection would lead to a drop-down to the $25K support level and the key 200-day moving average located around the $24K mark.
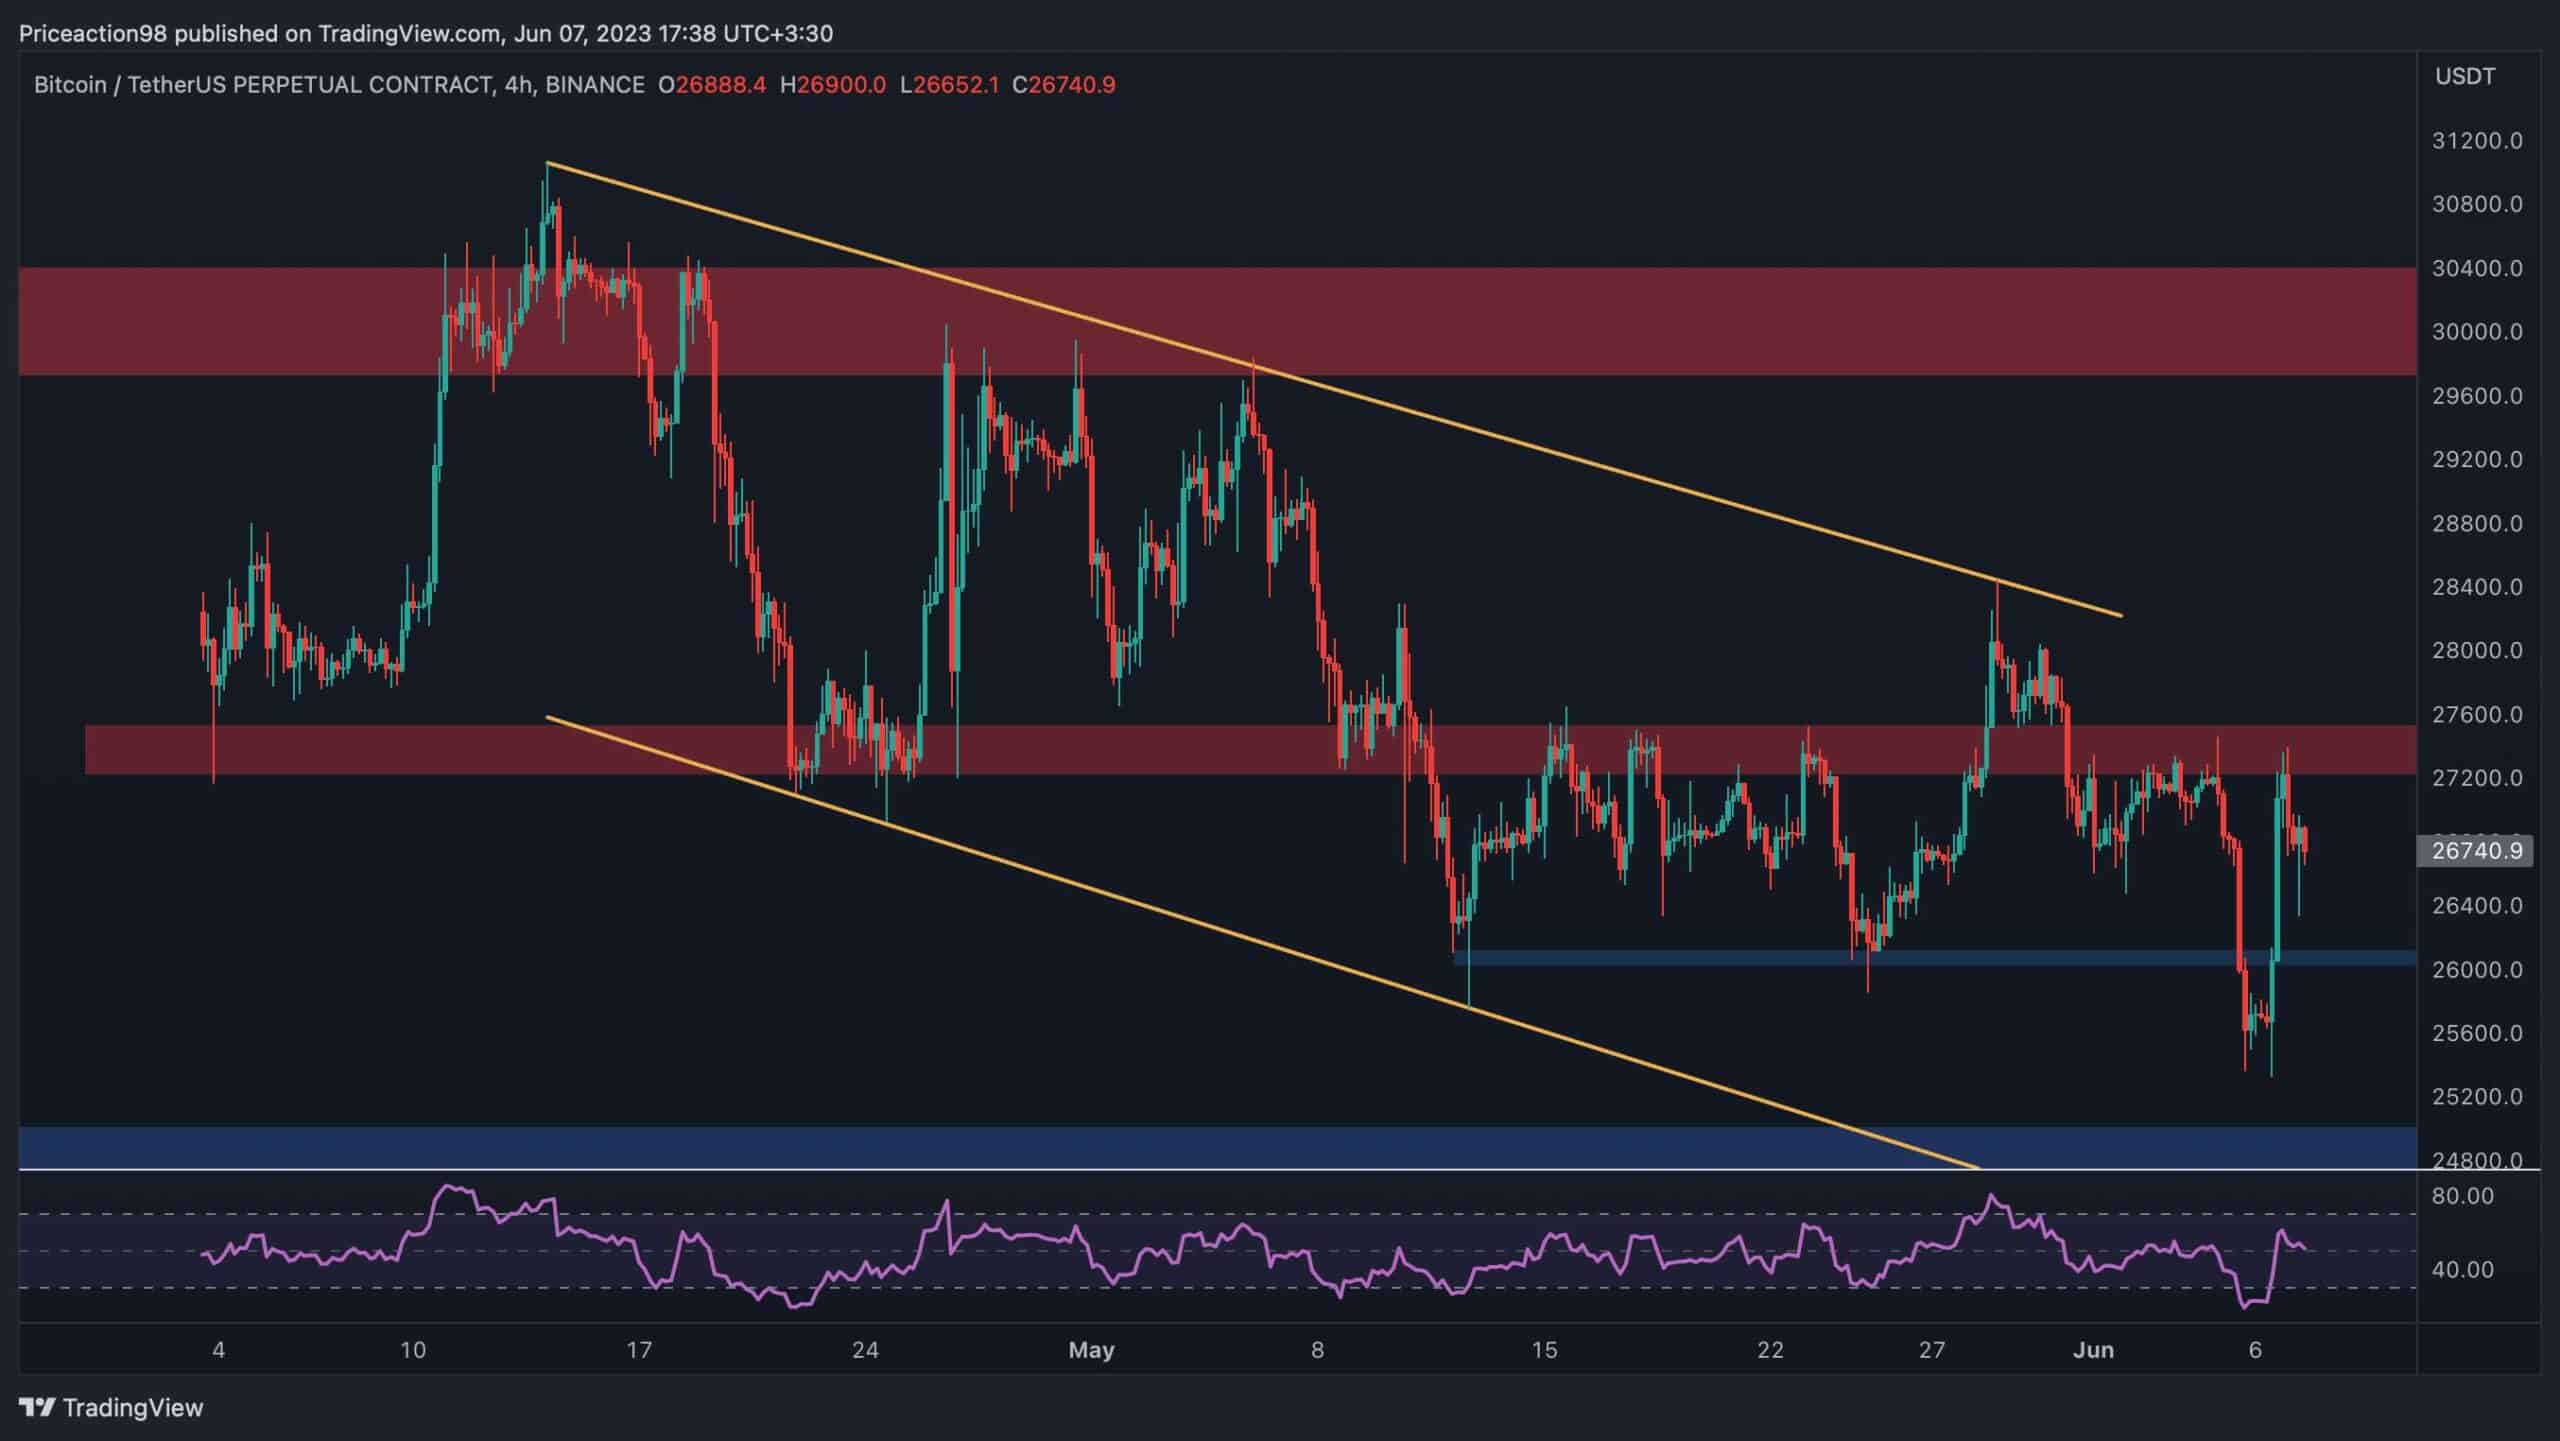
Looking at the 4-hour timeframe, it is clear that the Bitcoin price faced a significant barrier at the $27,500 resistance level and experienced a sharp decline thereafter. The short-term support level at $26K has also been breached, indicating a continued downward movement with strong momentum.
However, the BTC price has now reversed following the RSI’s overbought signal and is currently retesting the $27,500 resistance area. If it breaks above this point, the descending channel is likely to be broken as well, paving the way for the market to rise toward the $30K level once again.
By Shayan
While many were optimistic about the beginning of a bull market, a wave of fear and uncertainty spread through the industry because of what happened lately. On Monday, the Securities and Exchange Commission (SEC) filed a lawsuit against Binance, leading to a 5% drop in the price of Bitcoin. The next day, it field a lawsuit against Coinbase as well.
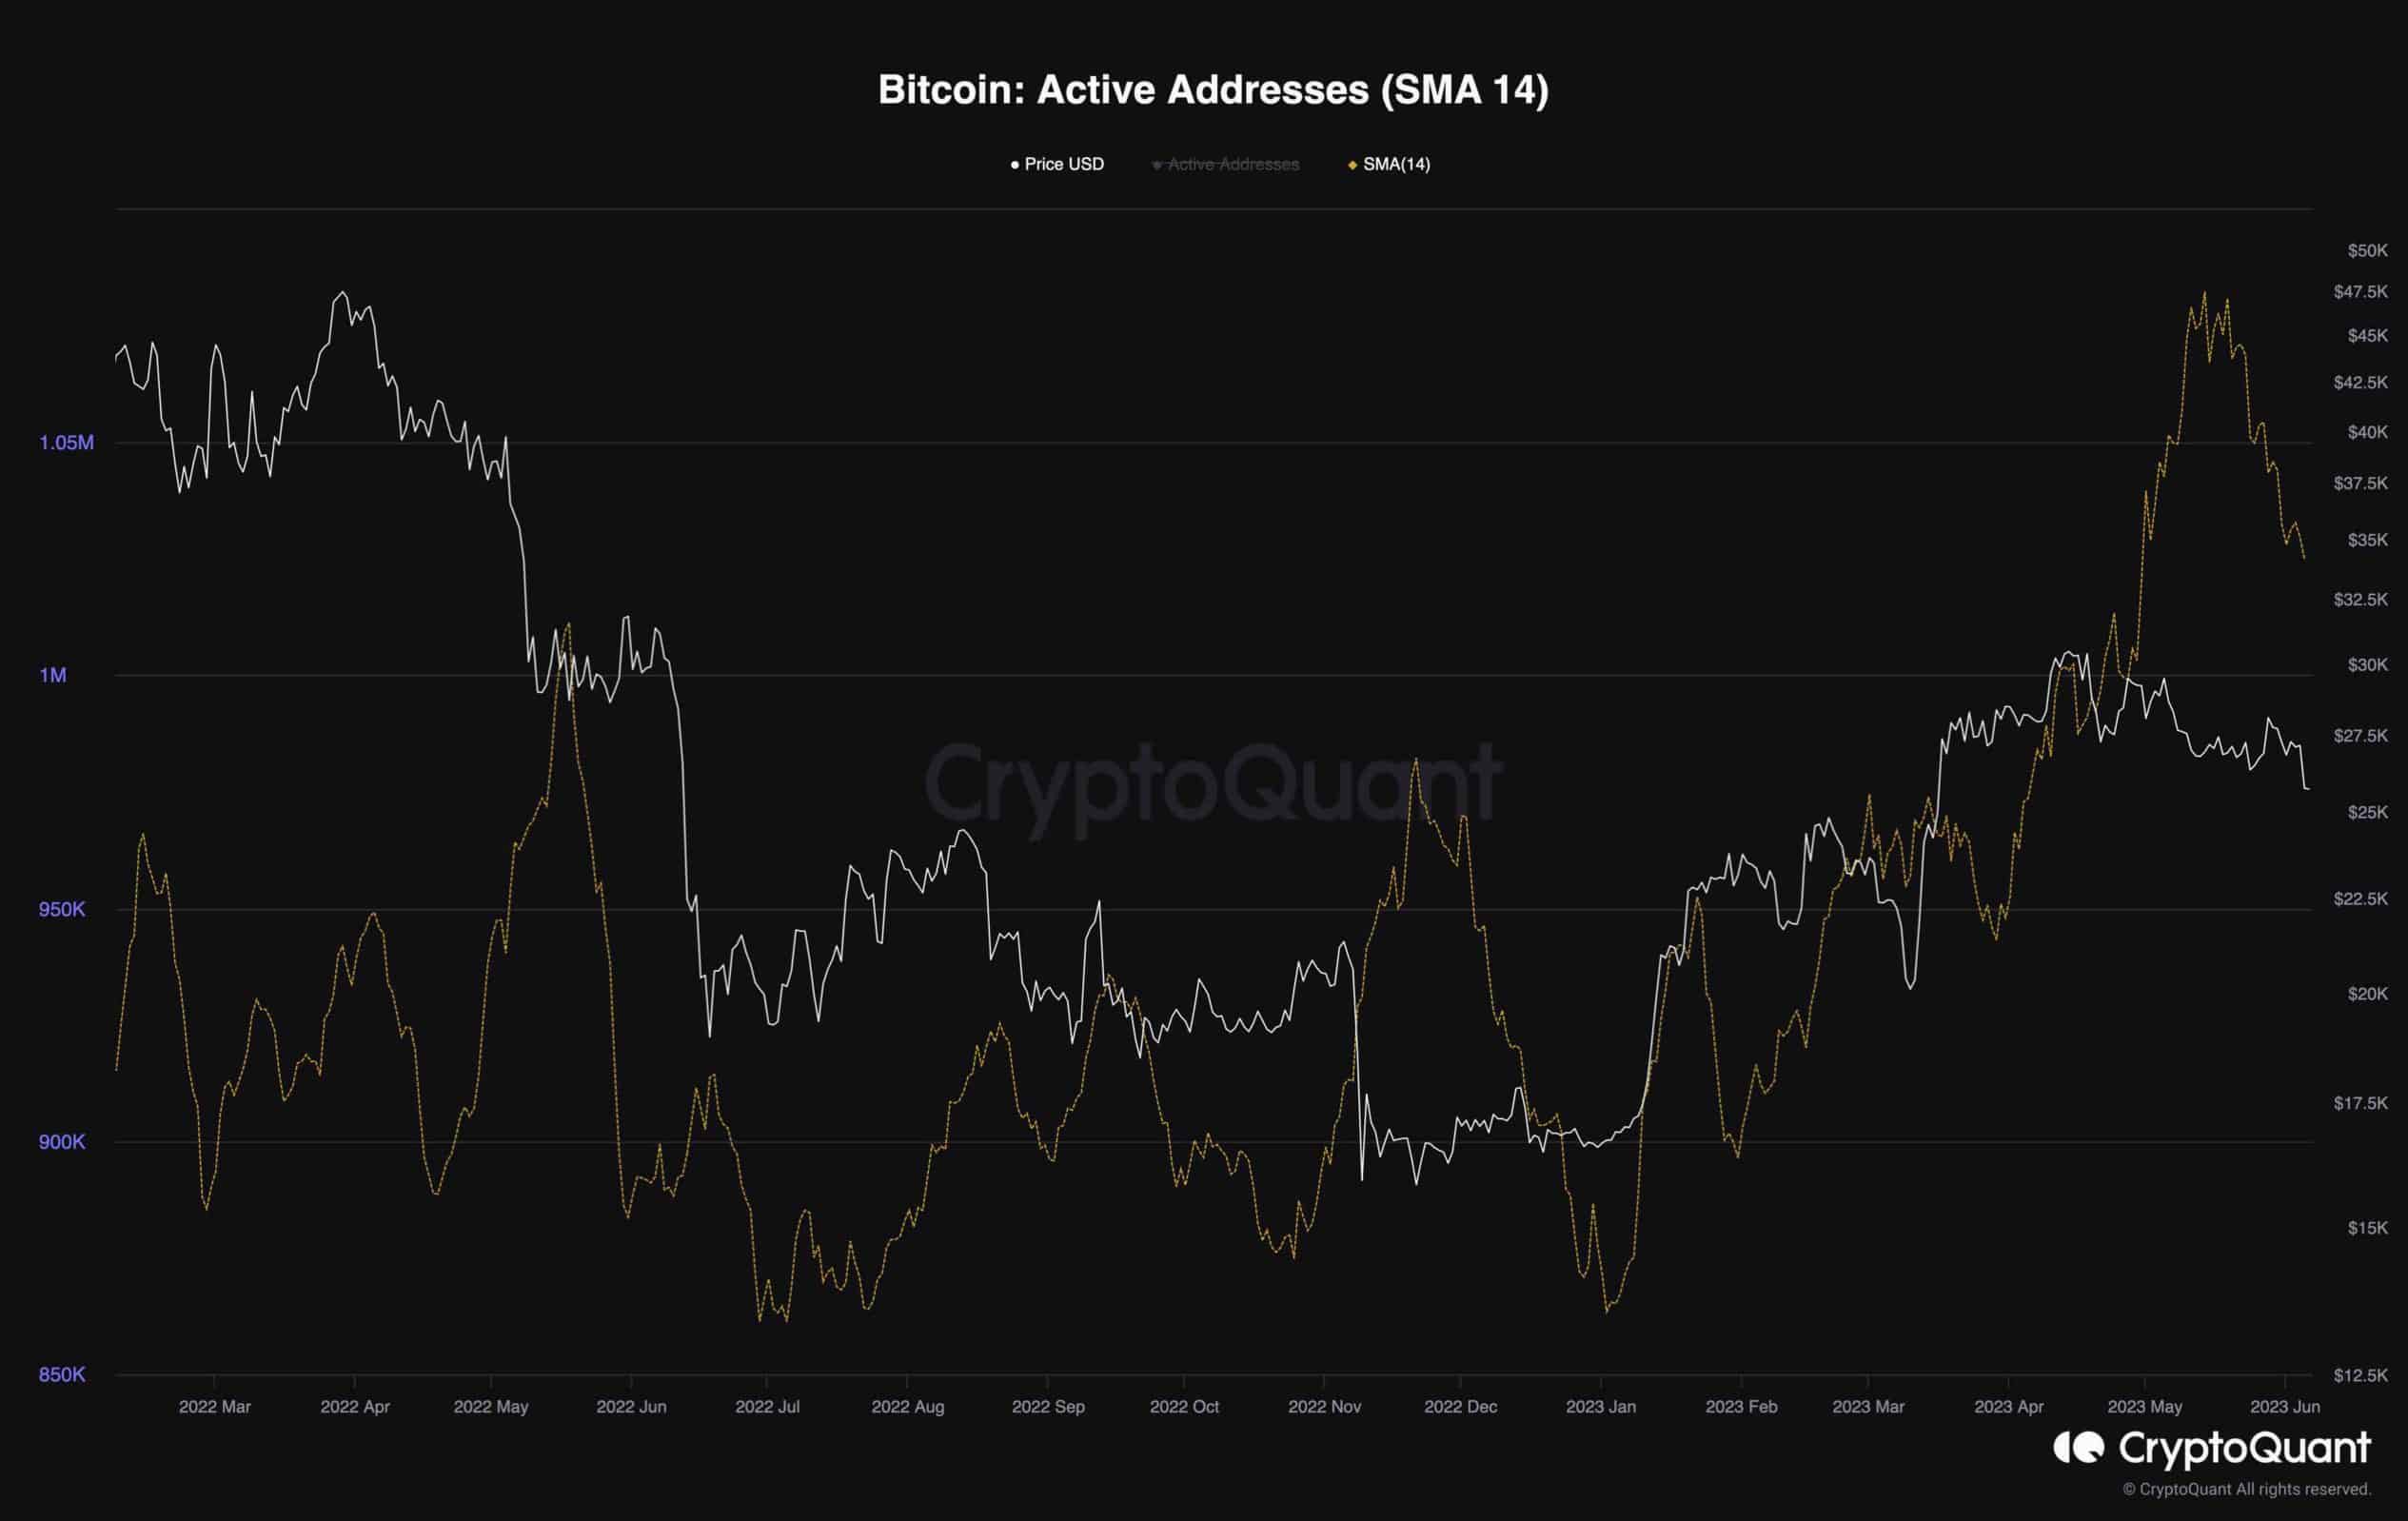
A graph representing the Active Addresses metric, which indicates the number of participants actively engaging with Bitcoin’s network alongside the price, provides valuable insights. The chart demonstrates an upward trend, signaling a positive outlook for network activity and the demand for Bitcoin.
Unfortunately, this trend has recently reversed, and the metric is now experiencing a significant decline, primarily attributed to the recent FUD.
免責事項:このページの情報は第三者から提供される場合があり、Gateの見解または意見を代表するものではありません。このページに表示される内容は参考情報のみであり、いかなる金融、投資、または法律上の助言を構成するものではありません。Gateは情報の正確性または完全性を保証せず、当該情報の利用に起因するいかなる損失についても責任を負いません。仮想資産への投資は高いリスクを伴い、大きな価格変動の影響を受けます。投資元本の全額を失う可能性があります。関連するリスクを十分に理解したうえで、ご自身の財務状況およびリスク許容度に基づき慎重に判断してください。詳細は免責事項をご参照ください。
コメント
0/400
コメントなし