Calm Before the Storm? XRP at a Strong Support as Big Move Seems Imminent (Ripple Price Analysis)
CryptoPotato
Technical Analysis
By TradingRage
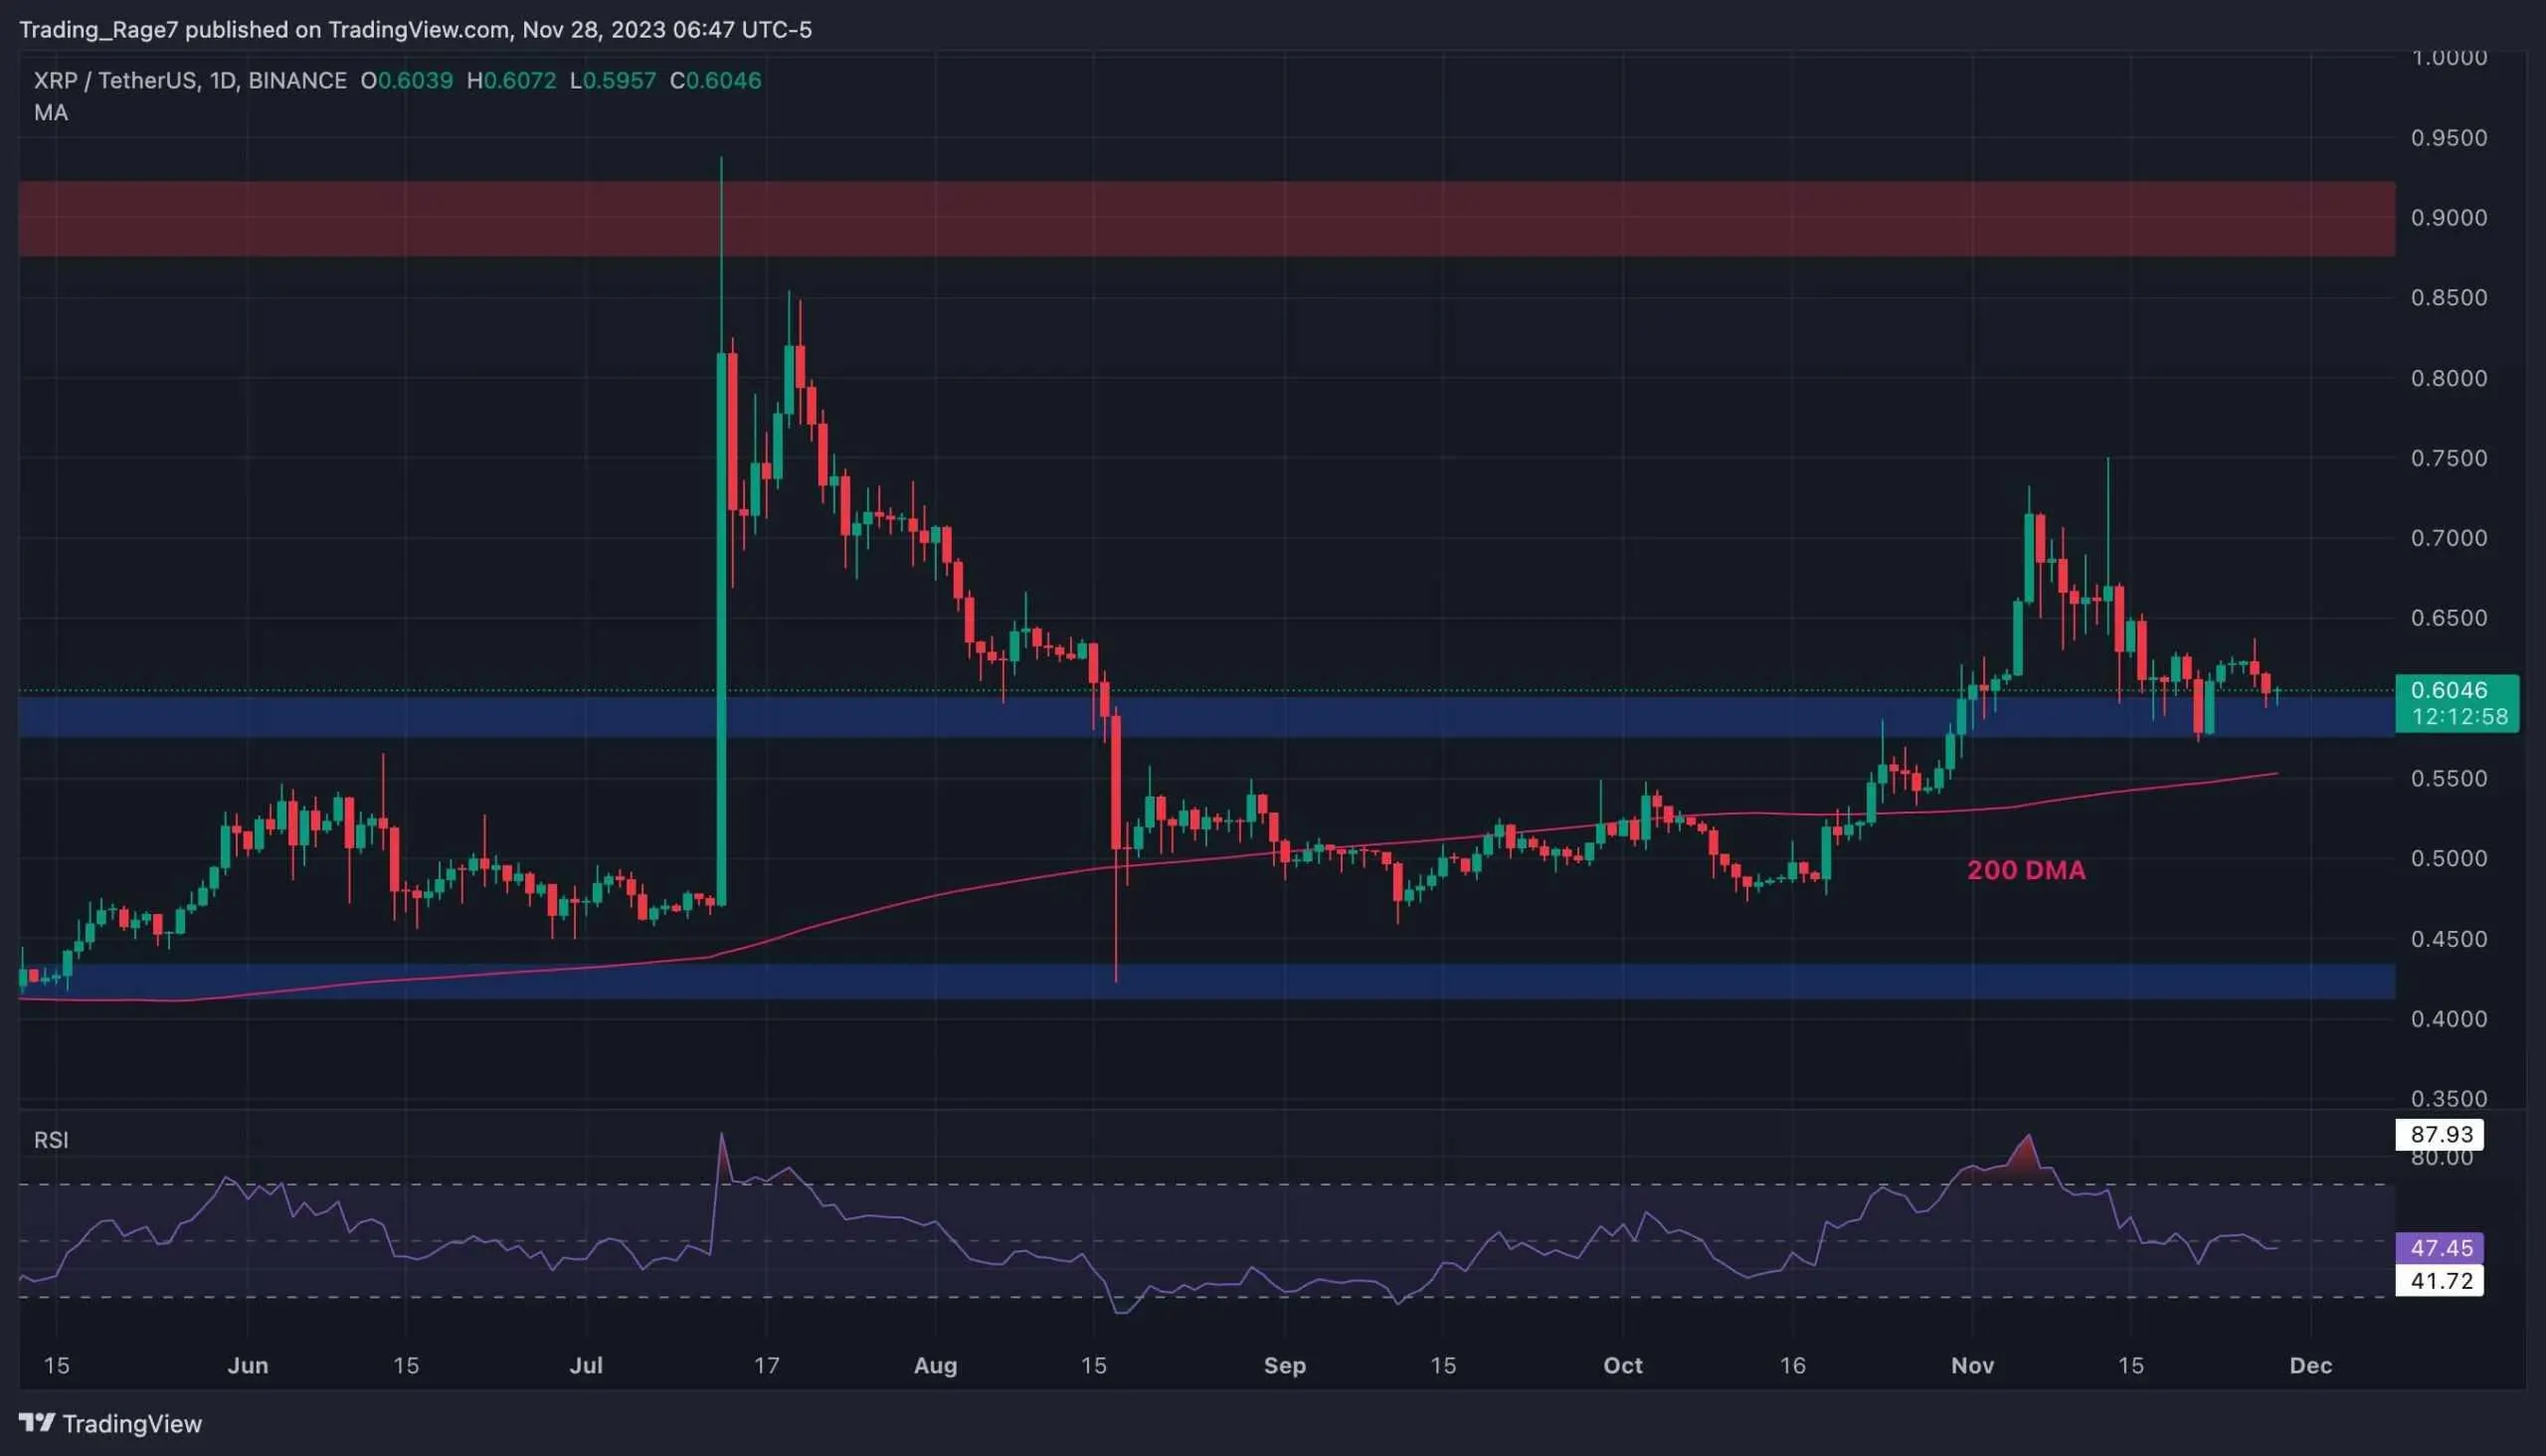
Ripple’s price has been experiencing a pullback on both the USDT and BTC pairs over the last few weeks. Yet, the market might begin another bullish move soon, as the price is currently at strong support levels.
The USDT Paired Chart
On the USDT paired chart, the price has been on the decline over the recent weeks after it failed to move past the $0.7 mark.
The $0.6 support level is currently preventing the price from dropping lower. Yet, even if this level breaks down, the 200-day moving average located around the $0.55 mark can be counted on as a turning point to push XRP higher. In this case, it is likely that a rally toward the $0.9 level will finally occur.
 Source: TradingView### The BTC Paired Chart
Against BTC, the price is currently testing the 1,600 SAT support zone after failing to stay above the 200-day moving average, which is hovering around the 1,900 SAT mark.
If a bullish rebound occurs, the market is likely to rise toward the 1,800 SAT resistance level and potentially the 200-day moving average.
A breakout above these resistance elements will pave the way for an increase toward the key 2,200 SAT area. Yet, the relative strength index suggests that the momentum is still bearish, as it is showing values below 50%. Therefore, a breakdown of the 1,600 SAT level and a consequent drop towards the 1,250 SAT support is still probable in the short run.
 Source: TradingView
免責事項:このページの情報は第三者から提供される場合があり、Gateの見解または意見を代表するものではありません。このページに表示される内容は参考情報のみであり、いかなる金融、投資、または法律上の助言を構成するものではありません。Gateは情報の正確性または完全性を保証せず、当該情報の利用に起因するいかなる損失についても責任を負いません。仮想資産への投資は高いリスクを伴い、大きな価格変動の影響を受けます。投資元本の全額を失う可能性があります。関連するリスクを十分に理解したうえで、ご自身の財務状況およびリスク許容度に基づき慎重に判断してください。詳細は免責事項をご参照ください。
コメント
0/400
コメントなし