Fartcoin 突破了持續數月的下降通道,這是幾個月來它首次突破該結構。目前 Fartcoin 價格上漲至 0.2989 美元,週漲幅達 6.9%。此次突破將市場注意力引向 0.2362 美元的支撐位和 0.3002 美元的阻力位之間的既定區間。該代幣目前在這兩個關鍵價位之間交易,定義了近期的市場區間。
數月下降通道的技術性突破
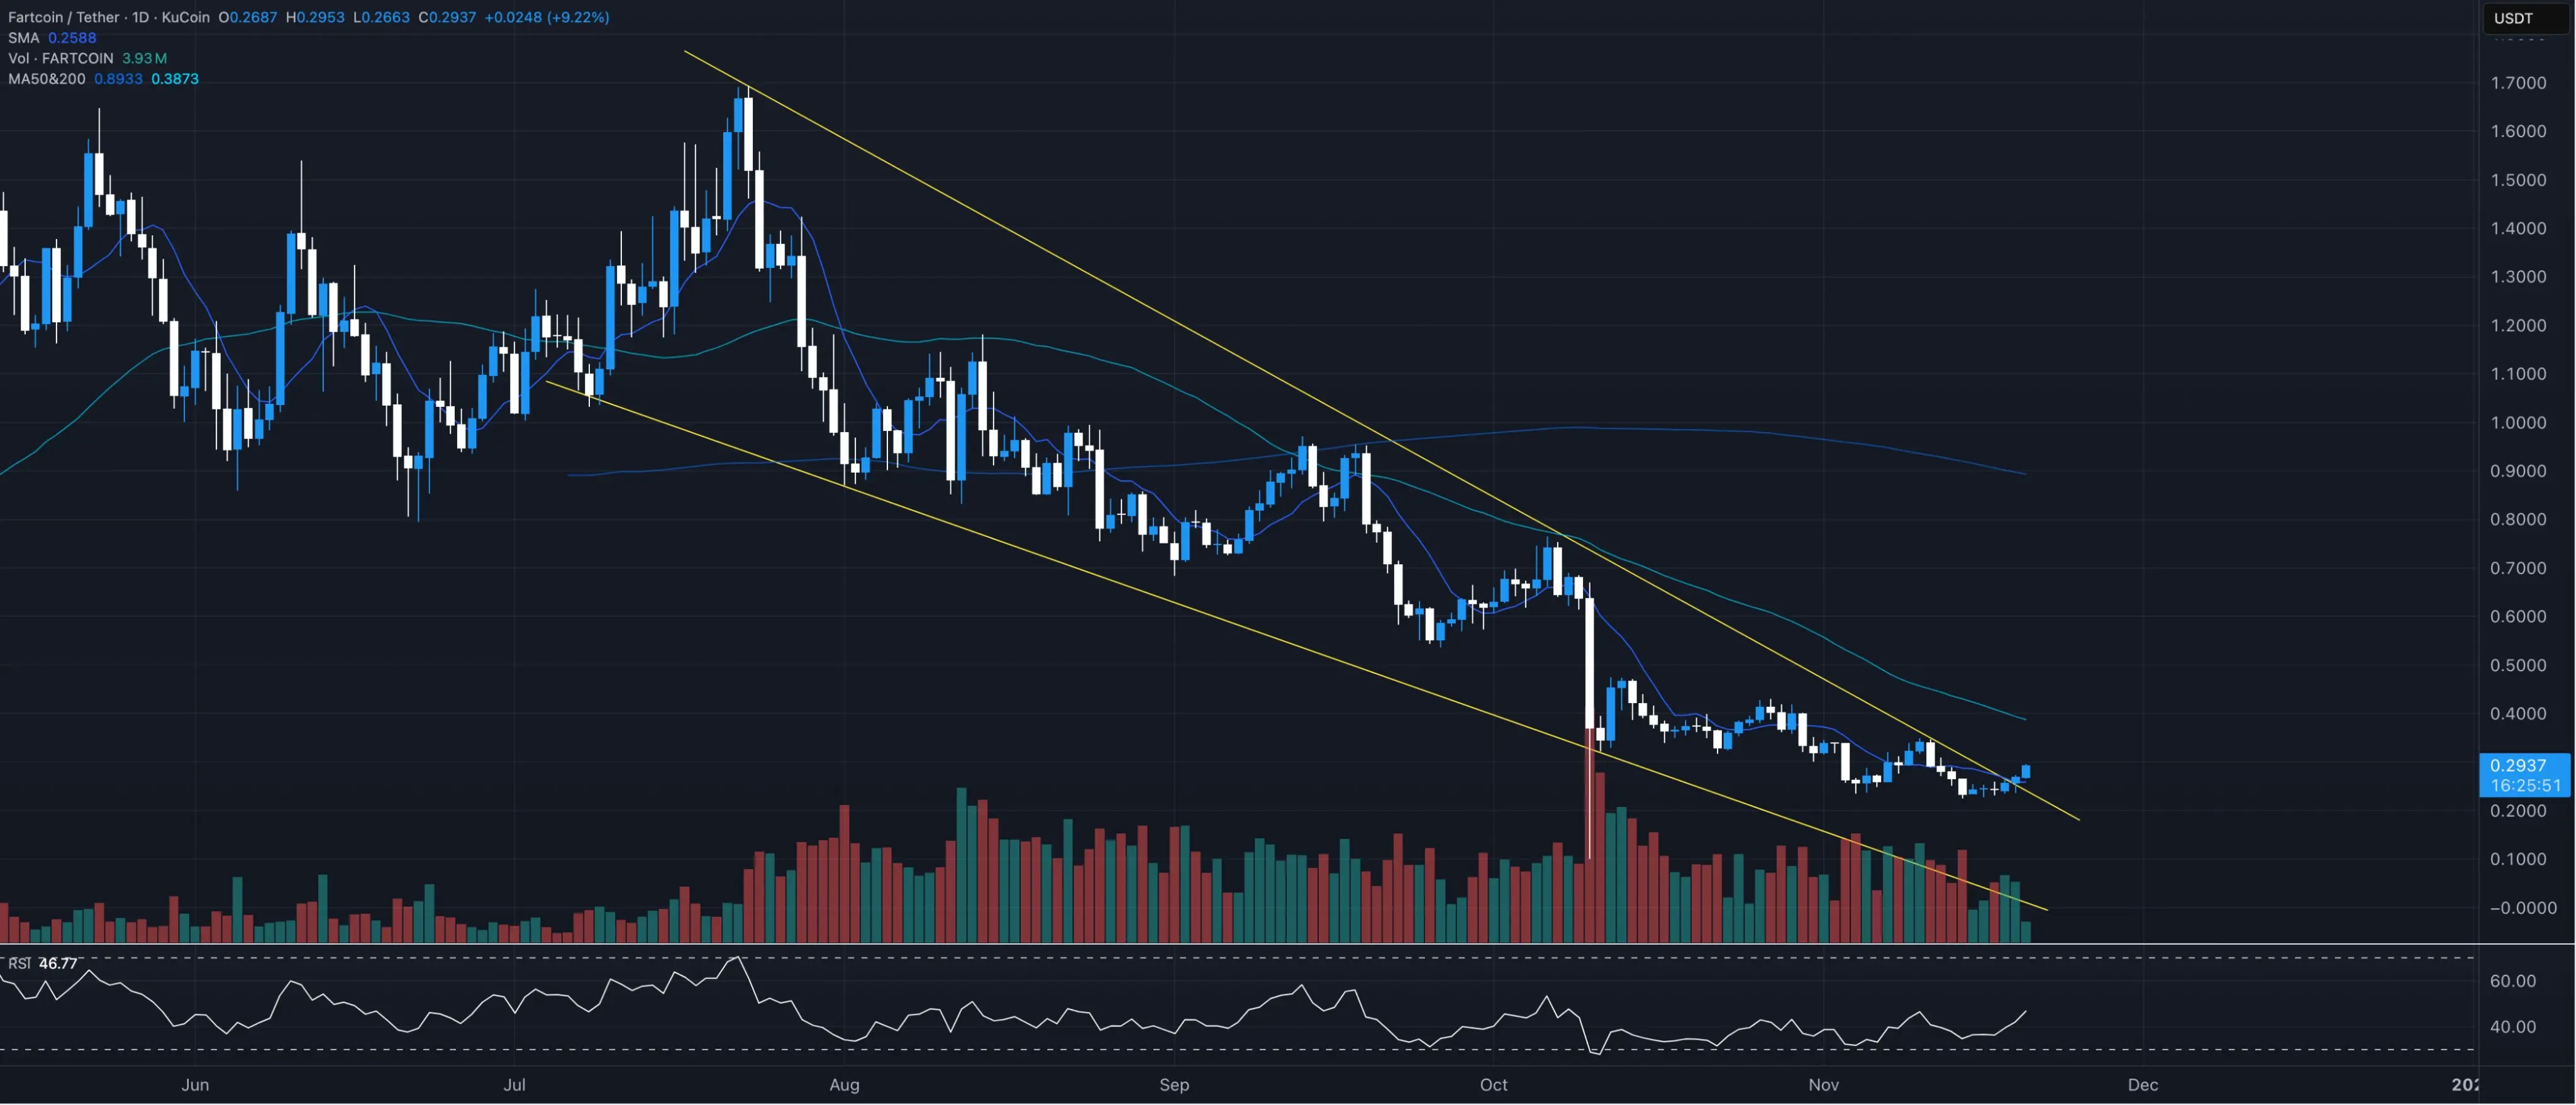
(來源:Trading View)
這次 Fartcoin 突破是在經歷了數月的下跌後出現的,此前價格一直維持在一個清晰的通道內。在整個下跌過程中,交易量保持活躍,圖表顯示價格持續與通道的上下邊界互動。值得注意的是,最近的 K 線收盤價突破了上趨勢線,這標誌著該結構結束。
下降通道是技術分析中最經典的形態之一。當價格在兩條平行的下傾趨勢線之間波動時,就形成了下降通道。上軌代表阻力,每次價格觸及該線時都會遭遇賣壓而回落;下軌代表支撐,價格觸及該線時通常會獲得買盤支撐而反彈。Fartcoin 在數月時間內一直受困於這個通道,每次試圖向上突破時都被上軌壓制。
這種持續數月的通道形態具有重要意義。時間越長,通道的有效性越高,突破時的技術意義也越重大。當價格最終突破上軌時,往往預示著趨勢反轉的可能性。這次 Fartcoin 的突破正是發生在 K 線收盤價明確站上上趨勢線之後,而非僅僅是盤中觸及,這增加了突破的可靠性。
這一轉變與 Fartcoin 價格反彈至當前水準直接相關。反彈發生時,價格正接近 0.2362 美元的支撐位,該支撐位在先前的幾次測試中限制了價格的下跌。從技術形態來看,這個支撐位正好位於下降通道的下軌附近,價格在此獲得強勁支撐後向上反彈,最終突破了上軌,形成了完整的「通道突破」形態。
目前,Fartcoin 價格從該支撐位向阻力位移動,形成了一個明確的短期波動區間,交易員們將繼續密切關注。這個 0.2362 至 0.3002 美元的區間,寬度約為 27%,為短期交易者提供了清晰的操作框架。
0.3002 美元阻力位的關鍵考驗
交易員關注 0.3002 美元阻力位,該代幣正在測試近期形態的上邊界。市場目前觀察到,該代幣的交易價格接近今年稍早據稱曾建立多頭部位的區域。該區域包括略低於 0.3002 美元的區域,該區域目前構成阻力。接近該區域為評估突破後的 Fartcoin 價格走勢提供了另一個參考基準。
0.3002 美元為何如此關鍵?從歷史價格走勢來看,這個價位在今年稍早曾是重要的成交密集區。當價格在某個區間內大量換手時,該區間往往會在未來成為重要的支撐或阻力位。如果價格從下方接近,該區間就成為阻力;如果價格從上方回落,該區間就成為支撐。目前 Fartcoin 正在從下方測試這個區域,因此它表現為阻力。
價格回落至這些水準也凸顯了在永續市場中新開倉位的重要性。重新入場的決定讓市場對當前的走勢更加關注,交易者現在密切關注該代幣如何在近期形態的上邊界附近穩定。如果 Fartcoin 能夠在 0.3002 美元附近橫盤整理,吸收該價位的賣壓,然後放量突破,將確認新一輪上漲趨勢的開始。
相反,如果價格在接近 0.3002 美元時遭遇強大阻力並快速回落,可能預示著突破失敗,價格可能重新測試 0.2362 美元支撐位。這種「假突破」在技術分析中並不罕見,當市場動能不足以突破關鍵阻力時,往往會出現這種情況。
Fartcoin 當前技術面關鍵價位
上方阻力:0.3002 美元(今年稍早多頭建倉區,成交密集帶)
當前價格:0.2989 美元(接近阻力位測試中)
下方支撐:0.2362 美元(通道突破前的反彈起點,多次測試有效)
短期區間:0.2362 至 0.3002 美元(約 27% 波動空間)
市場結構與長期均線的參考意義
0.2362 美元支撐位和 0.3002 美元阻力位之間的活躍區間持續影響市場預期。Fartcoin 突破該區間後位於其上軌附近,目前價格在阻力位附近交易。然而,能否突破該區間取決於市場如何消化近期的上漲動能。
從更宏觀的圖表來看,Fartcoin 目前的交易價格仍低於長期均線,而這些均線也高於目前價格。這些均線水準為接下來的交易時段提供了額外的參考指標。移動平均線是技術分析中最常用的趨勢指標之一,它們平滑了價格波動,提供了更清晰的趨勢方向。
當價格位於長期均線(如 200 日均線)下方時,通常被視為長期下降趨勢。即使出現短期反彈,只要未能突破長期均線,趨勢反轉就尚未確認。Fartcoin 目前的情況正是如此:雖然突破了下降通道,但仍位於長期均線下方,這意味著從更大時間框架來看,下降趨勢尚未完全扭轉。
這種技術面配置為交易者提供了多層次的分析框架。短期內,0.2362 至 0.3002 美元的區間定義了波動範圍。中期內,長期均線提供了更高的阻力位,可能在 0.35 至 0.40 美元區間(具體位置取決於使用的均線參數)。只有當價格突破這些長期均線時,才能確認趨勢已經從下降轉為上升。
隨著突破的推進,交易者們會繼續參考短期波動區間以及影響先前走勢的早期結構性因素。通道突破提供了初步的看漲訊號,但需要更多證據來確認。成交量的配合、在關鍵阻力位的表現、以及與長期均線的互動,都將在未來幾週內提供重要線索。
交易策略與風險管理建議
對於考慮參與 Fartcoin 的交易者,當前的技術結構提供了相對清晰的操作框架。保守型交易者可能會等待價格明確突破 0.3002 美元並站穩後再入場,這樣可以確認突破有效性,降低假突破風險。激進型交易者可能會在當前價格 0.2989 美元附近建立小倉位,設置止損在 0.2362 美元下方。
如果 Fartcoin 成功突破 0.3002 美元,下一個目標位可能在 0.35 至 0.40 美元區間,這是長期均線可能所在的位置。從當前價格到該區間,潛在漲幅約為 17% 至 34%。相反,如果跌破 0.2362 美元支撐,可能重新測試更低的支撐位,風險約為 21%。
Застереження: Інформація на цій сторінці може походити від третіх осіб і не відображає погляди або думки Gate. Вміст, що відображається на цій сторінці, є лише довідковим і не є фінансовою, інвестиційною або юридичною порадою. Gate не гарантує точність або повноту інформації і не несе відповідальності за будь-які збитки, що виникли в результаті використання цієї інформації. Інвестиції у віртуальні активи пов'язані з високим ризиком і піддаються значній ціновій волатильності. Ви можете втратити весь вкладений капітал. Будь ласка, повністю усвідомлюйте відповідні ризики та приймайте обережні рішення, виходячи з вашого фінансового становища та толерантності до ризику. Для отримання детальної інформації, будь ласка, зверніться до
Застереження.
Пов'язані статті
Solana наближається до рівня опору $95 з різким зростанням обсягів $17B
Solana наближається до ключового рівня опору біля $95, з підвищеним обсягом торгів та відкритим інтересом, що свідчить про активний інтерес трейдерів. Токен наразі коштує $90.20, і може піднятися вище, якщо подолає $95, але може протестувати $85 , якщо буде відхилений.
CryptoFrontNews19хв. тому
Аналитик стверджує, що Bittensor (TAO) може бути готовий до зростання – ось цільова ціна
Біттензор (TAO) знову виділяється після кількох місяців руху вбік. Токен, орієнтований на ШІ, коливається поблизу ключової зони підтримки, і деякі аналітики вважають, що графік може готуватися до більшого руху.
Криптоаналітик Karamata поділився аналізом графіка TAO, стверджуючи, що він може налаштовуватися на значний рух в найближчому майбутньому.
CaptainAltcoin20хв. тому
HBAR на роздоріжжі: чи підтримка $0.095 спровокує прорив до $0.106?
HBAR торгується за ціною $0.09739 і вище за рівень S/R у діапазоні $0.094-$0.096 на 12-годинному графіку.
Найближчий рівень опору знаходиться на рівні $0.10 з тиском по нисхідній трендовій лінії приблизно на рівні $0.104-$0.106.
Підтримка знаходиться на рівні $0.095835, а прорив — на рівні .
CryptoNewsLand49хв. тому
PEPE коливається біля критичної підтримки $0.053414, оскільки $432M Обсяг зростає, що посилює спостереження за проривом
PEPE торгується за $0.053416, трохи вище рівня підтримки на $0.053414, з значним обсягом торгів, що зріс на 22.14%. Опір знаходиться на рівні $0.053676. Незважаючи на незначне зниження ціни, спостерігається зростання активності на ринку, що свідчить про потенційну волатильність.
CryptoNewsLand54хв. тому
Будівельники відходять від Aave – що це означає для ціни AAVE?
Aave (AAVE) одночасно має справу з двома дуже різними заголовками. З одного боку, протокол зазнав $24 мільйонної експлуатації, пов’язаної з отруєнням адреси, що знову нагадує користувачам, що ризики безпеки все ще існують у сфері DeFi.
Незважаючи на цей інцидент, реакція ринку була дещо
CaptainAltcoin1год тому
AVAX тестує рівень опору $9.38 після зростання на 8.3% — прорив чи відкат попереду?
AVAX також торгується за ціною $9.16 з щоденним приростом 8.3 відсотка, але все ще нижче рівня опору $9.38.
Сильна активність покупців біля $8.46 продовжує запобігати глибшому зниженню.
Щоденне закриття вище за $9.38 може відкрити шлях до $9.50, тоді як відторгнення ризикує опуститися до $8.30.
Avalanche’s
CryptoNewsLand1год тому

