The price of Bitcoin is currently on a downward trajectory since it faced resistance at $30K in April. However, there are notable support levels that may prevent further decline.
Technical Analysis
By: Edris
The Daily Chart:
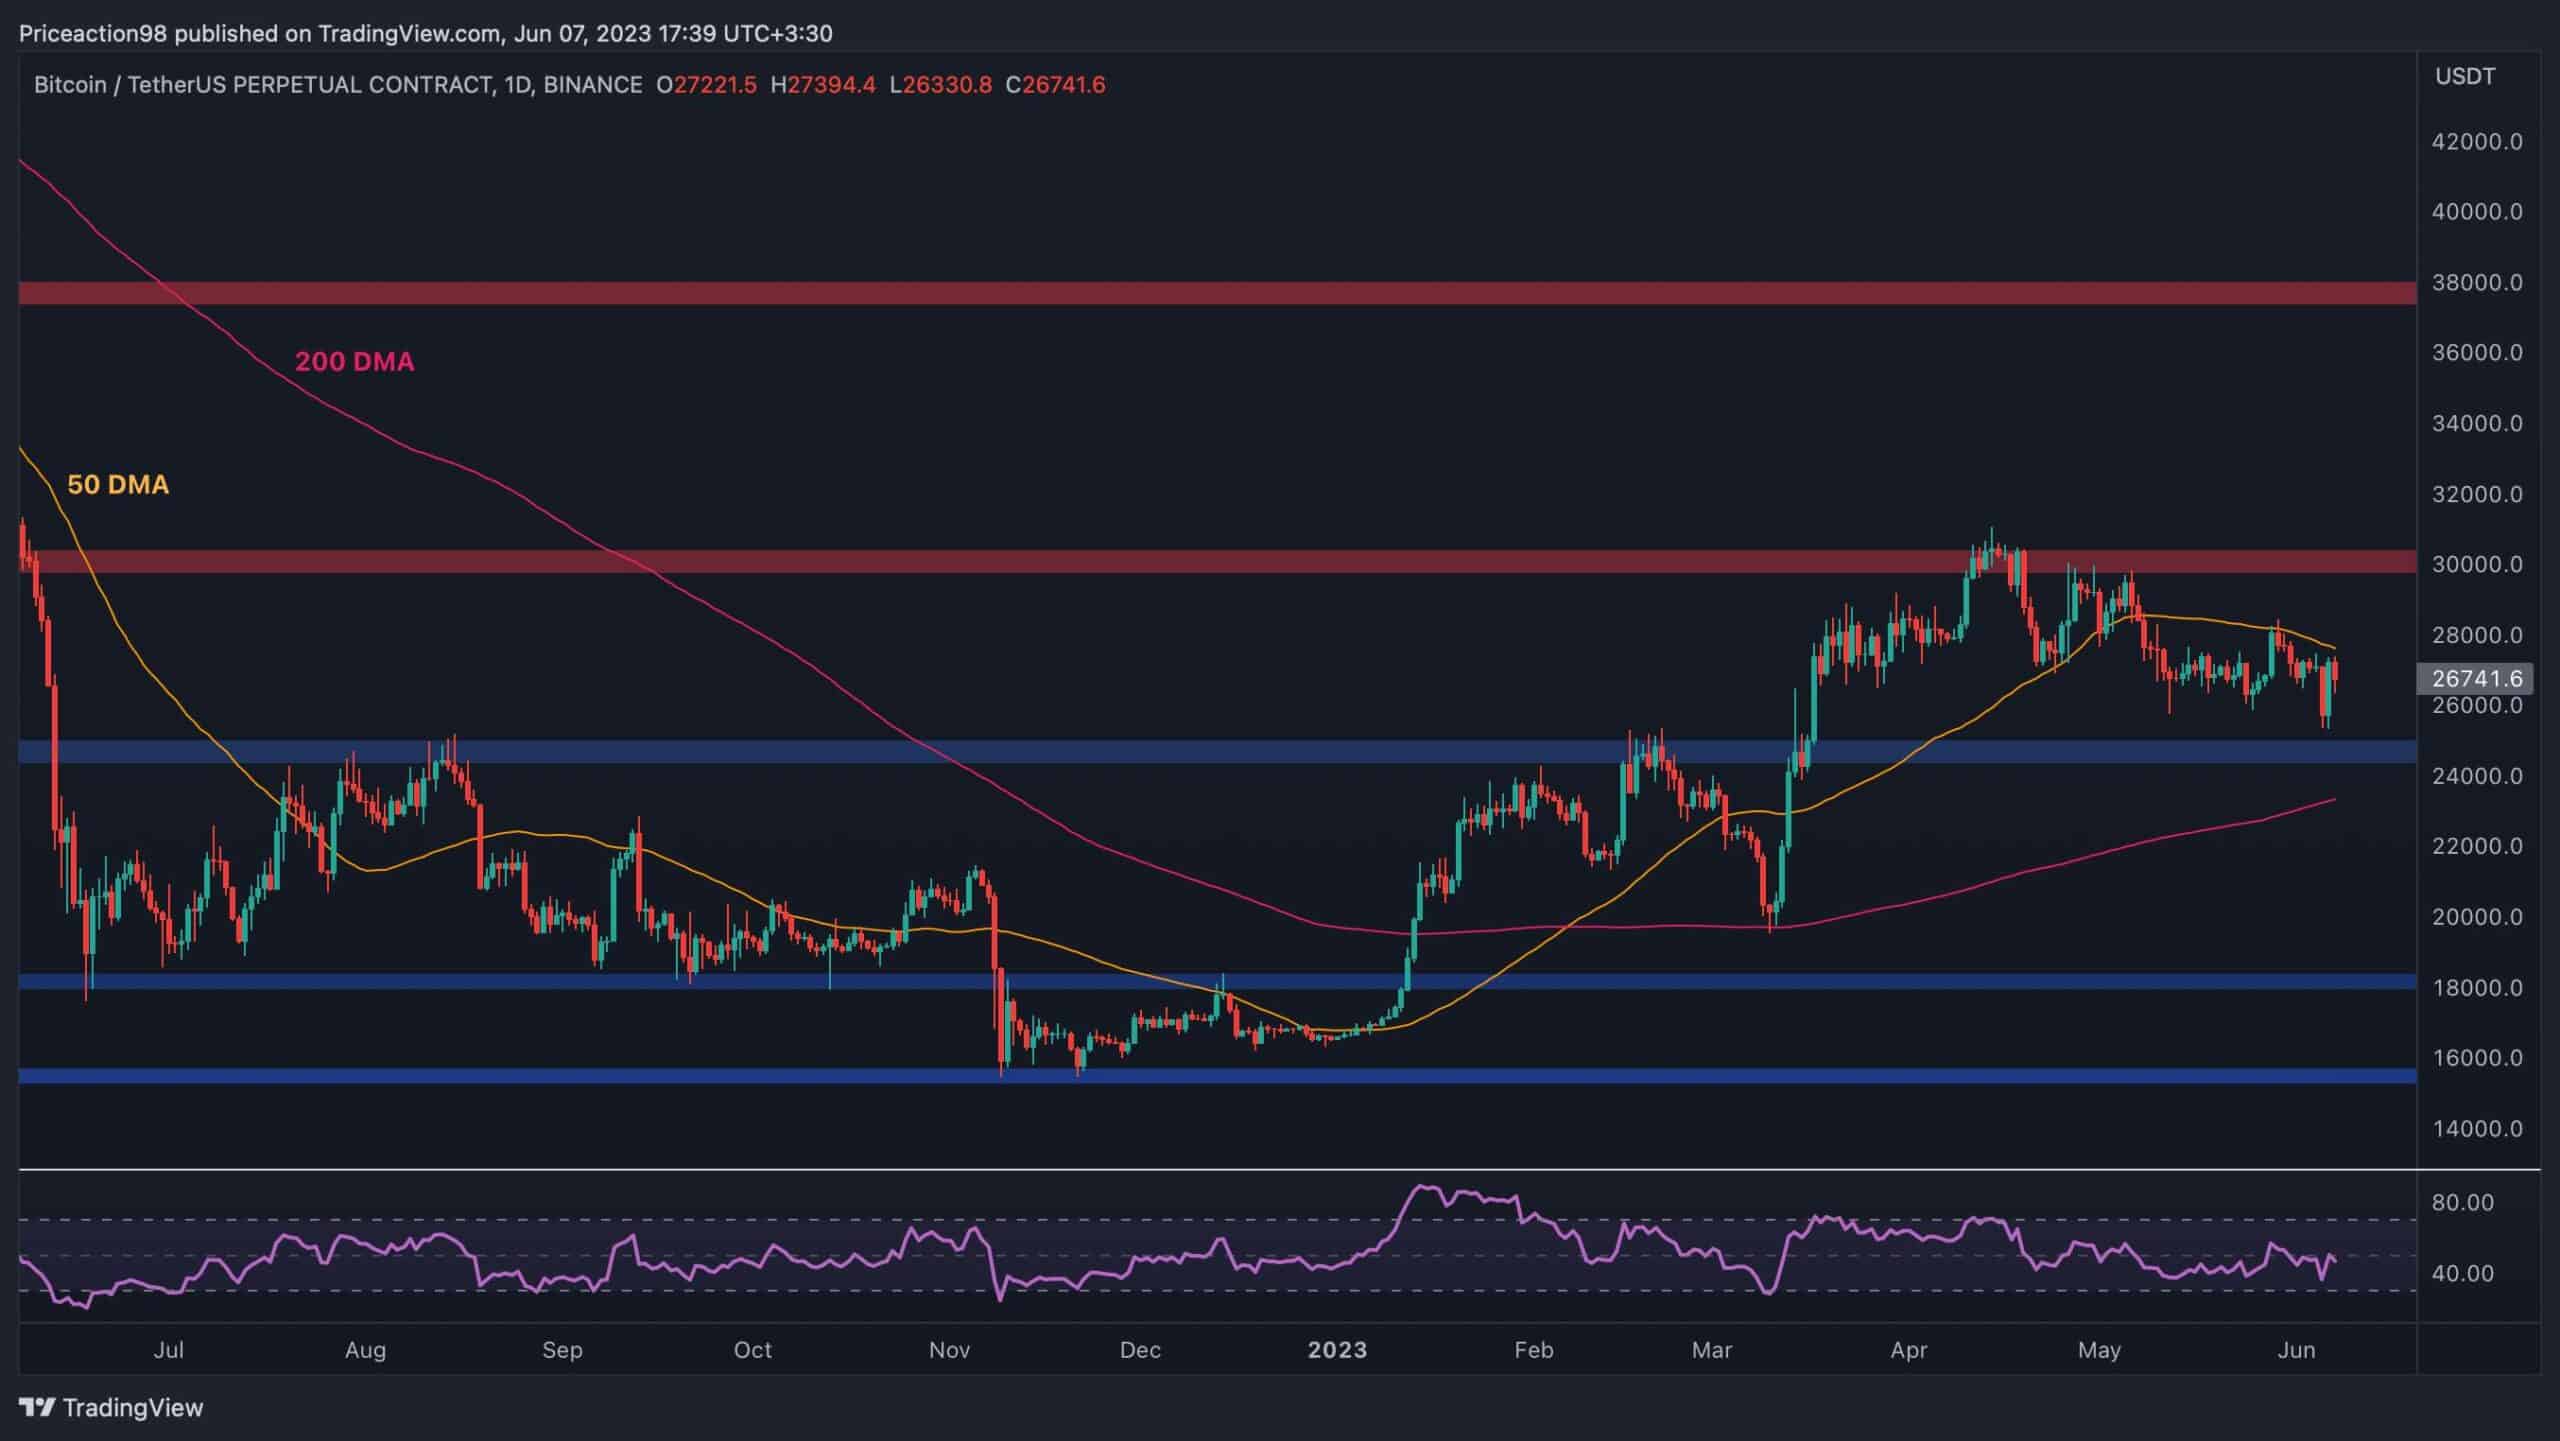
On the daily timeframe, the Bitcoin price has consistently formed lower highs and lows in the past couple of months. The 50-day moving average acted as a strong resistance, causing a downward rejection near the $28K level.
Following yesterday’s rebound, the price is testing the 50-day moving average again. A bullish breakout would result in a rally towards the $30K level, while another rejection would lead to a drop-down to the $25K support level and the key 200-day moving average located around the $24K mark.
 Source: TradingView### The 4-Hour Chart:
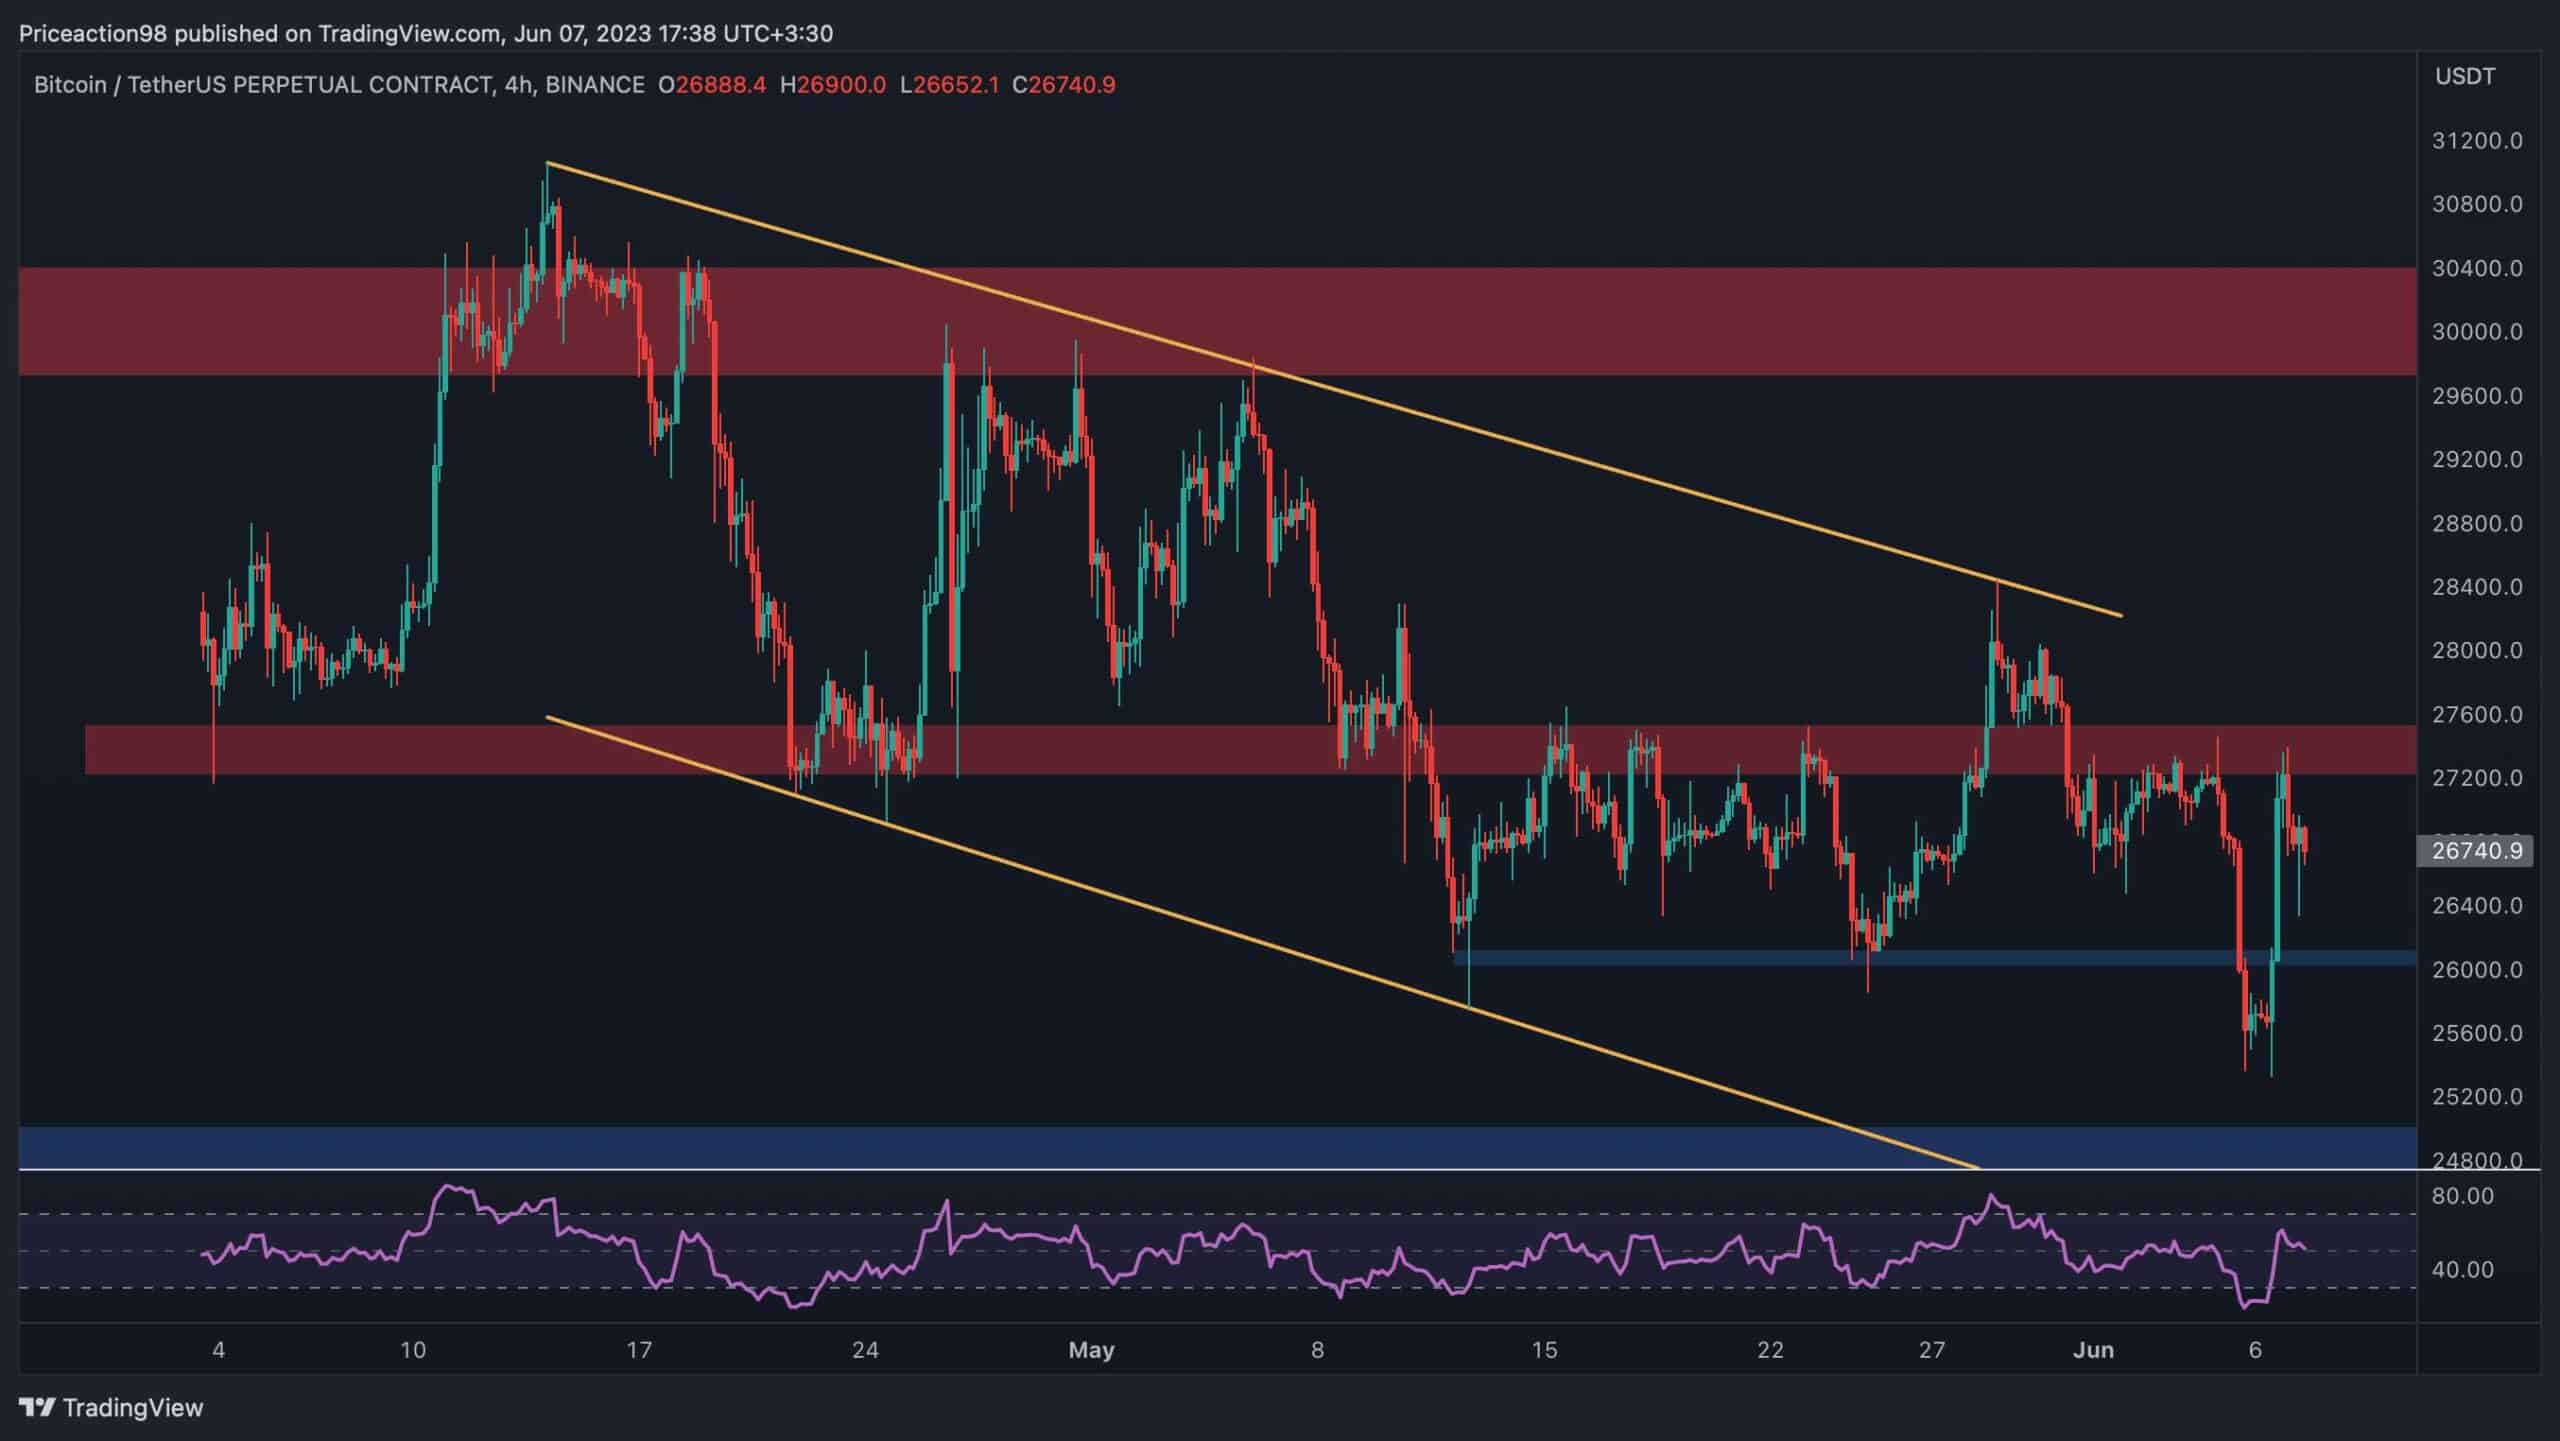
Looking at the 4-hour timeframe, it is clear that the Bitcoin price faced a significant barrier at the $27,500 resistance level and experienced a sharp decline thereafter. The short-term support level at $26K has also been breached, indicating a continued downward movement with strong momentum.
However, the BTC price has now reversed following the RSI’s overbought signal and is currently retesting the $27,500 resistance area. If it breaks above this point, the descending channel is likely to be broken as well, paving the way for the market to rise toward the $30K level once again.
 Source: tradingVIew## On-chain Analysis
By Shayan
While many were optimistic about the beginning of a bull market, a wave of fear and uncertainty spread through the industry because of what happened lately. On Monday, the Securities and Exchange Commission (SEC) filed a lawsuit against Binance, leading to a 5% drop in the price of Bitcoin. The next day, it field a lawsuit against Coinbase as well.
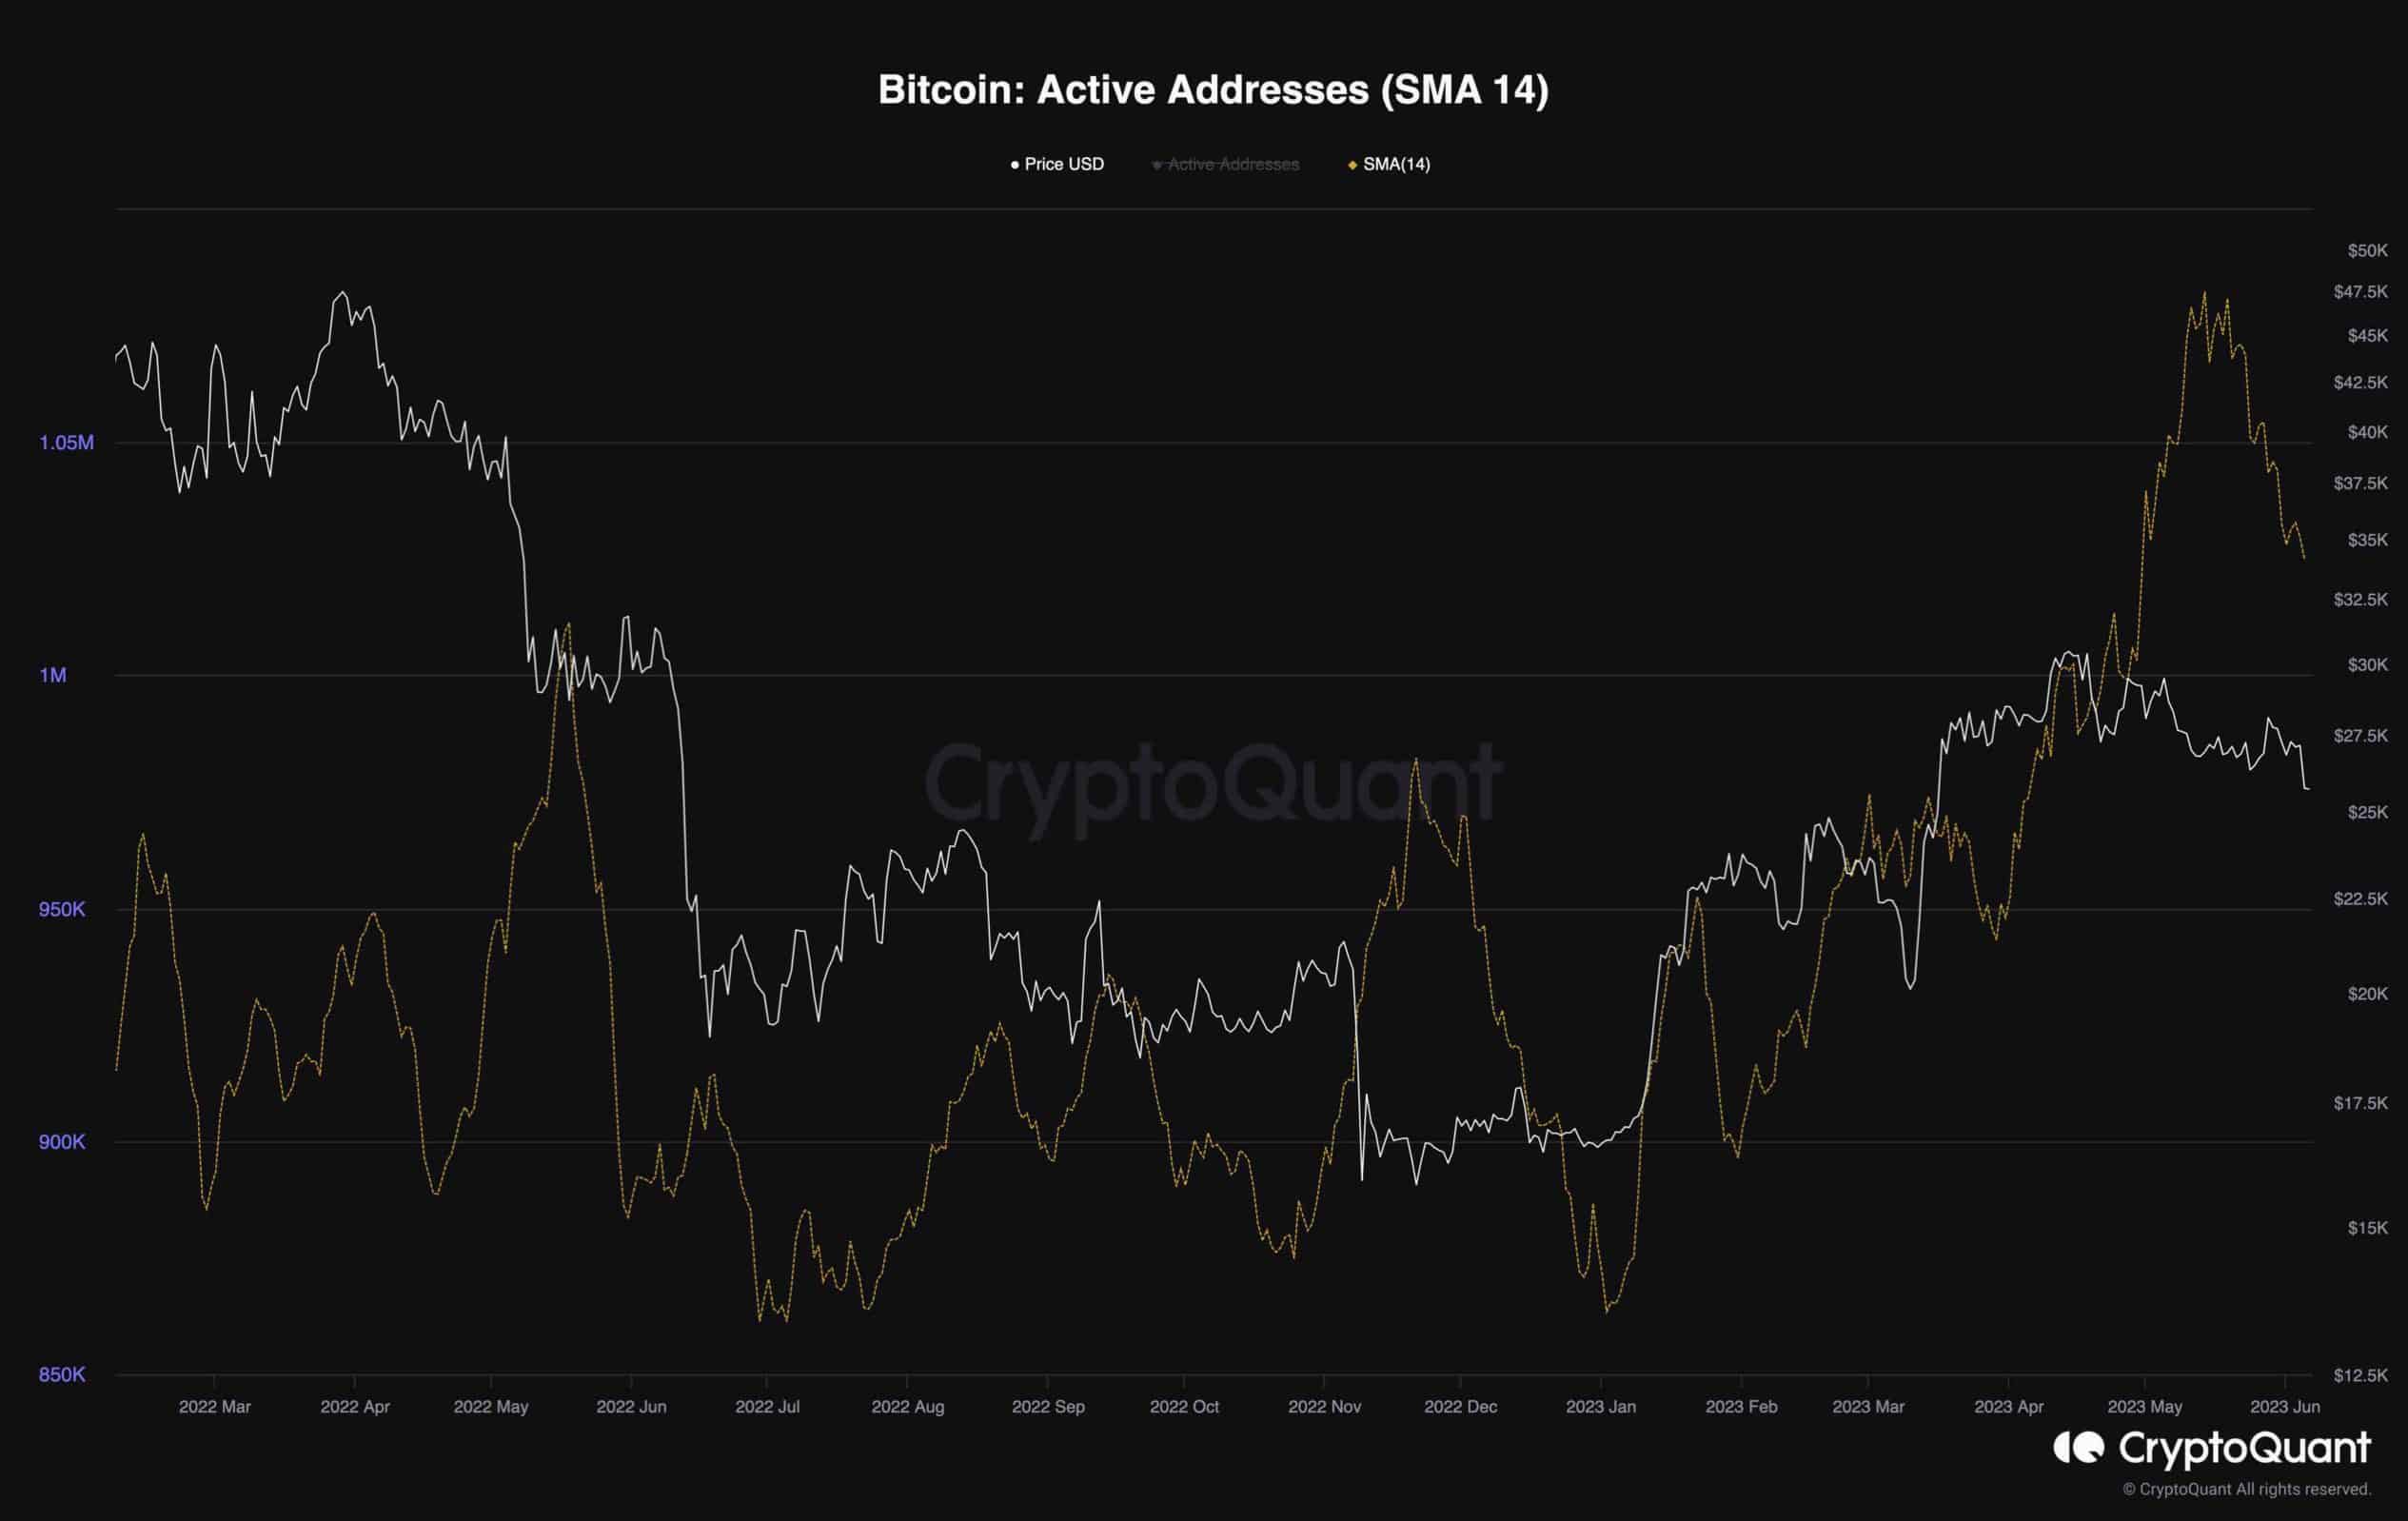
A graph representing the Active Addresses metric, which indicates the number of participants actively engaging with Bitcoin’s network alongside the price, provides valuable insights. The chart demonstrates an upward trend, signaling a positive outlook for network activity and the demand for Bitcoin.
Unfortunately, this trend has recently reversed, and the metric is now experiencing a significant decline, primarily attributed to the recent FUD.
 Source: CryptoQuant
Isenção de responsabilidade: As informações contidas nesta página podem ser provenientes de terceiros e não representam os pontos de vista ou opiniões da Gate. O conteúdo apresentado nesta página é apenas para referência e não constitui qualquer aconselhamento financeiro, de investimento ou jurídico. A Gate não garante a exatidão ou o carácter exaustivo das informações e não poderá ser responsabilizada por quaisquer perdas resultantes da utilização destas informações. Os investimentos em ativos virtuais implicam riscos elevados e estão sujeitos a uma volatilidade de preços significativa. Pode perder todo o seu capital investido. Compreenda plenamente os riscos relevantes e tome decisões prudentes com base na sua própria situação financeira e tolerância ao risco. Para mais informações, consulte a
Isenção de responsabilidade.
