Básico
Negociação à Vista
Negoceie criptomoedas livremente
Margem
Aumente o seu lucro com a alavancagem
Converter e investir automaticamente
0 Fees
Opere qualquer volume sem tarifas nem derrapagem
ETF
Obtenha exposição a posições alavancadas de uma forma simples
Negociação Pré-Mercado
Negoceie novos tokens pré-listagem
Futuros
Centenas de contratos liquidados em USDT ou BTC
TradFi
Ouro
Plataforma de ativos tradicionais globais
Opções
Hot
Negoceie Opções Vanilla ao estilo europeu
Conta Unificada
Maximize a eficiência do seu capital
Negociação de demonstração
Arranque dos futuros
Prepare-se para a sua negociação de futuros
Eventos de futuros
Participe em eventos para recompensas
Negociação de demonstração
Utilize fundos virtuais para experimentar uma negociação sem riscos
Lançamento
CandyDrop
Recolher doces para ganhar airdrops
Launchpool
Faça staking rapidamente, ganhe potenciais novos tokens
HODLer Airdrop
Detenha GT e obtenha airdrops maciços de graça
Launchpad
Chegue cedo ao próximo grande projeto de tokens
Pontos Alpha
Negoceie ativos on-chain para airdrops
Pontos de futuros
Ganhe pontos de futuros e receba recompensas de airdrop
Investimento
Simple Earn
Ganhe juros com tokens inativos
Investimento automático
Invista automaticamente de forma regular.
Investimento Duplo
Aproveite a volatilidade do mercado
Soft Staking
Ganhe recompensas com staking flexível
Empréstimo de criptomoedas
0 Fees
Dê em garantia uma criptomoeda para pedir outra emprestada
Centro de empréstimos
Centro de empréstimos integrado
Centro de Património VIP
Aumento de património premium
Gestão de património privado
Alocação de ativos premium
Fundo Quant
Estratégias quant de topo
Staking
Faça staking de criptomoedas para ganhar em produtos PoS
Alavancagem inteligente
New
Alavancagem sem liquidação
Cunhagem de GUSD
Cunhe GUSD para retornos RWA
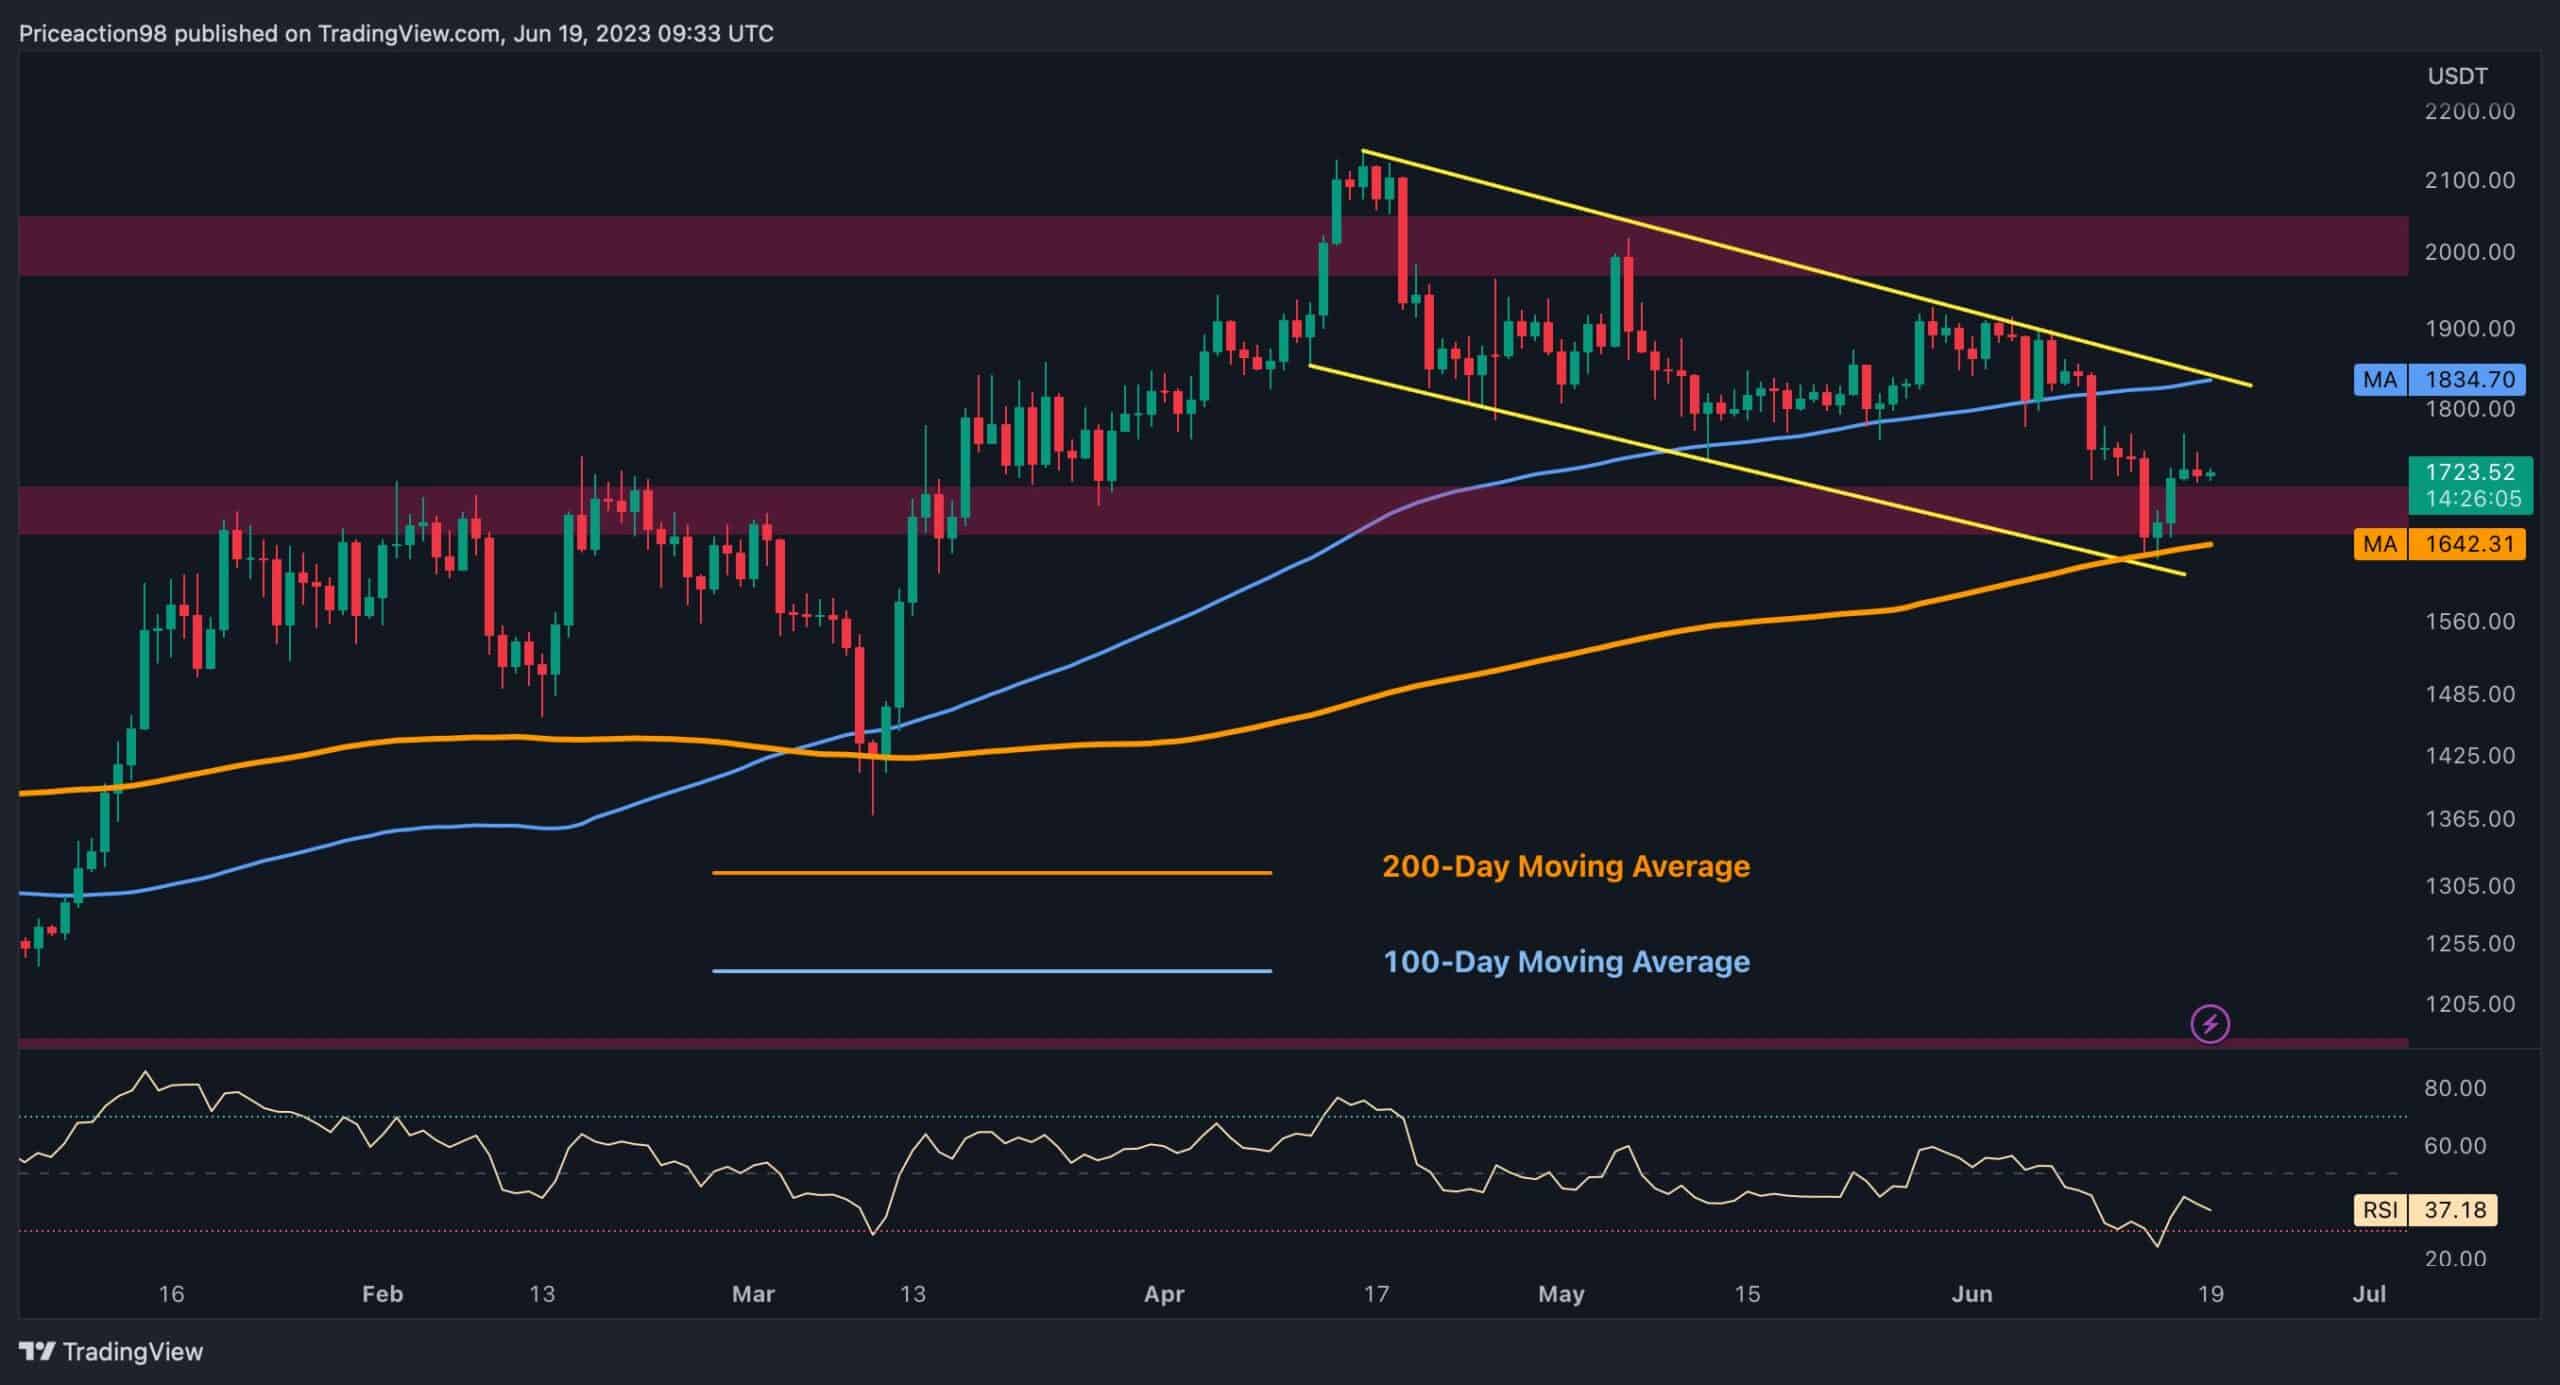 Source: TradingView## The 4-Hour Chart
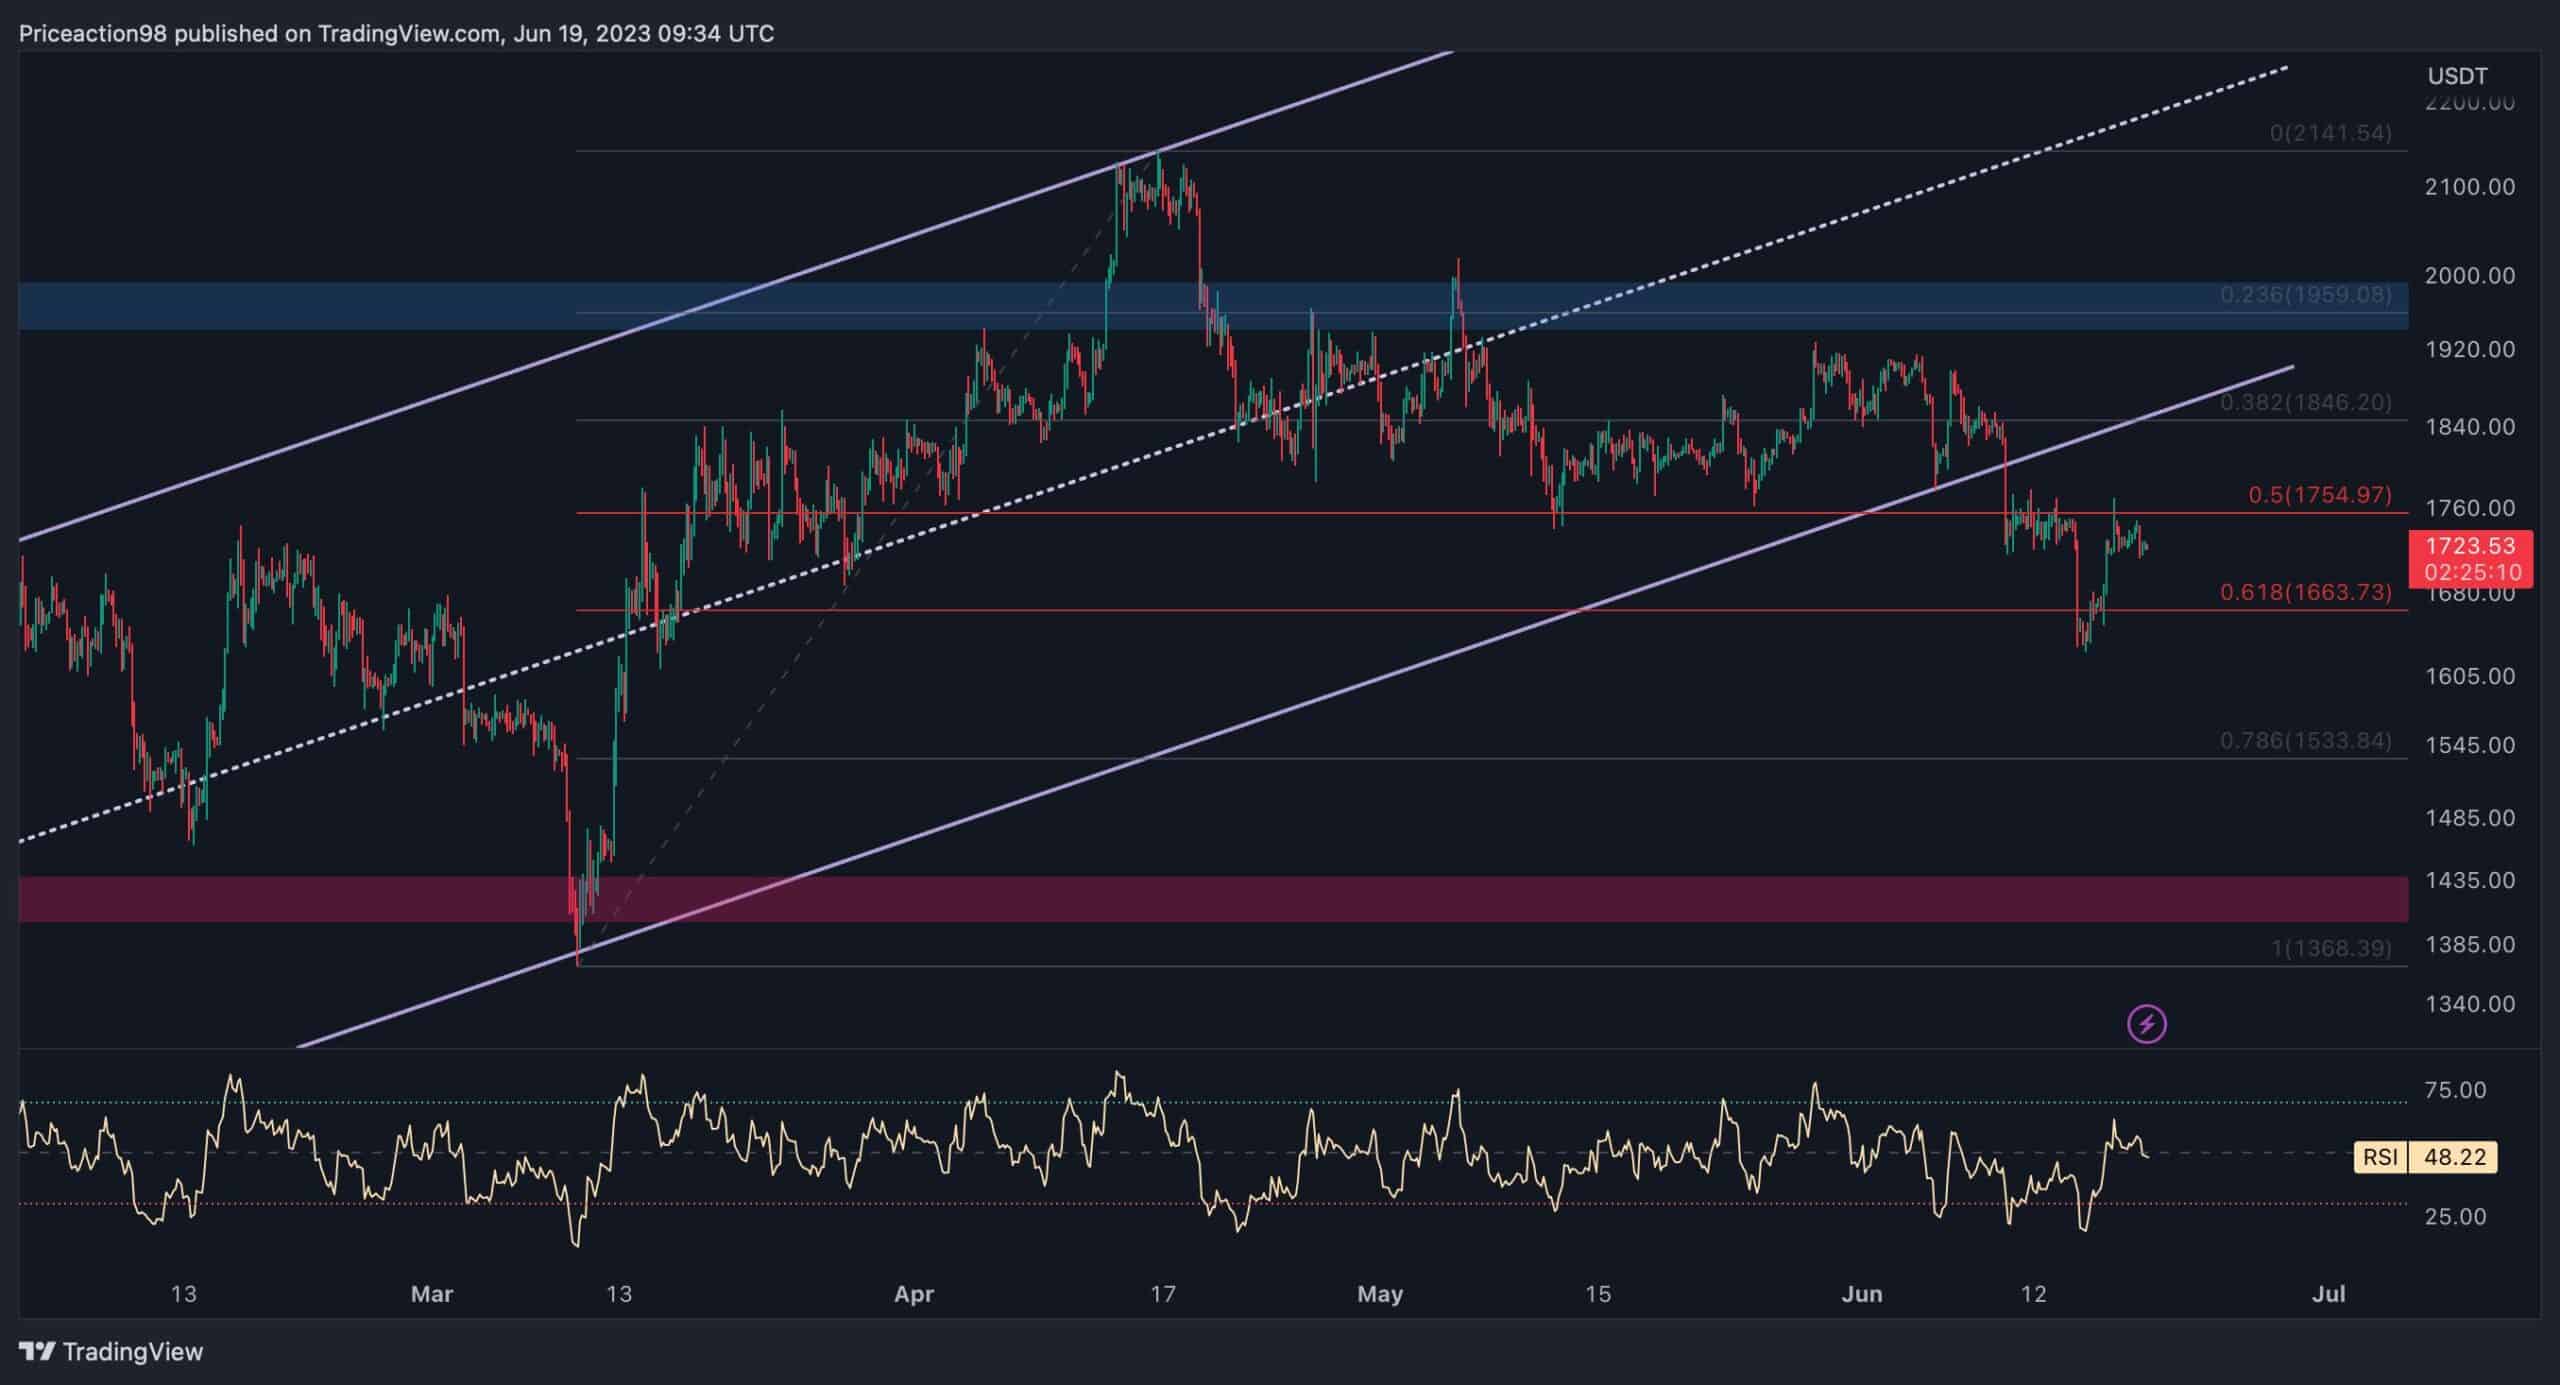 Source: TradingView## On-chain Analysis
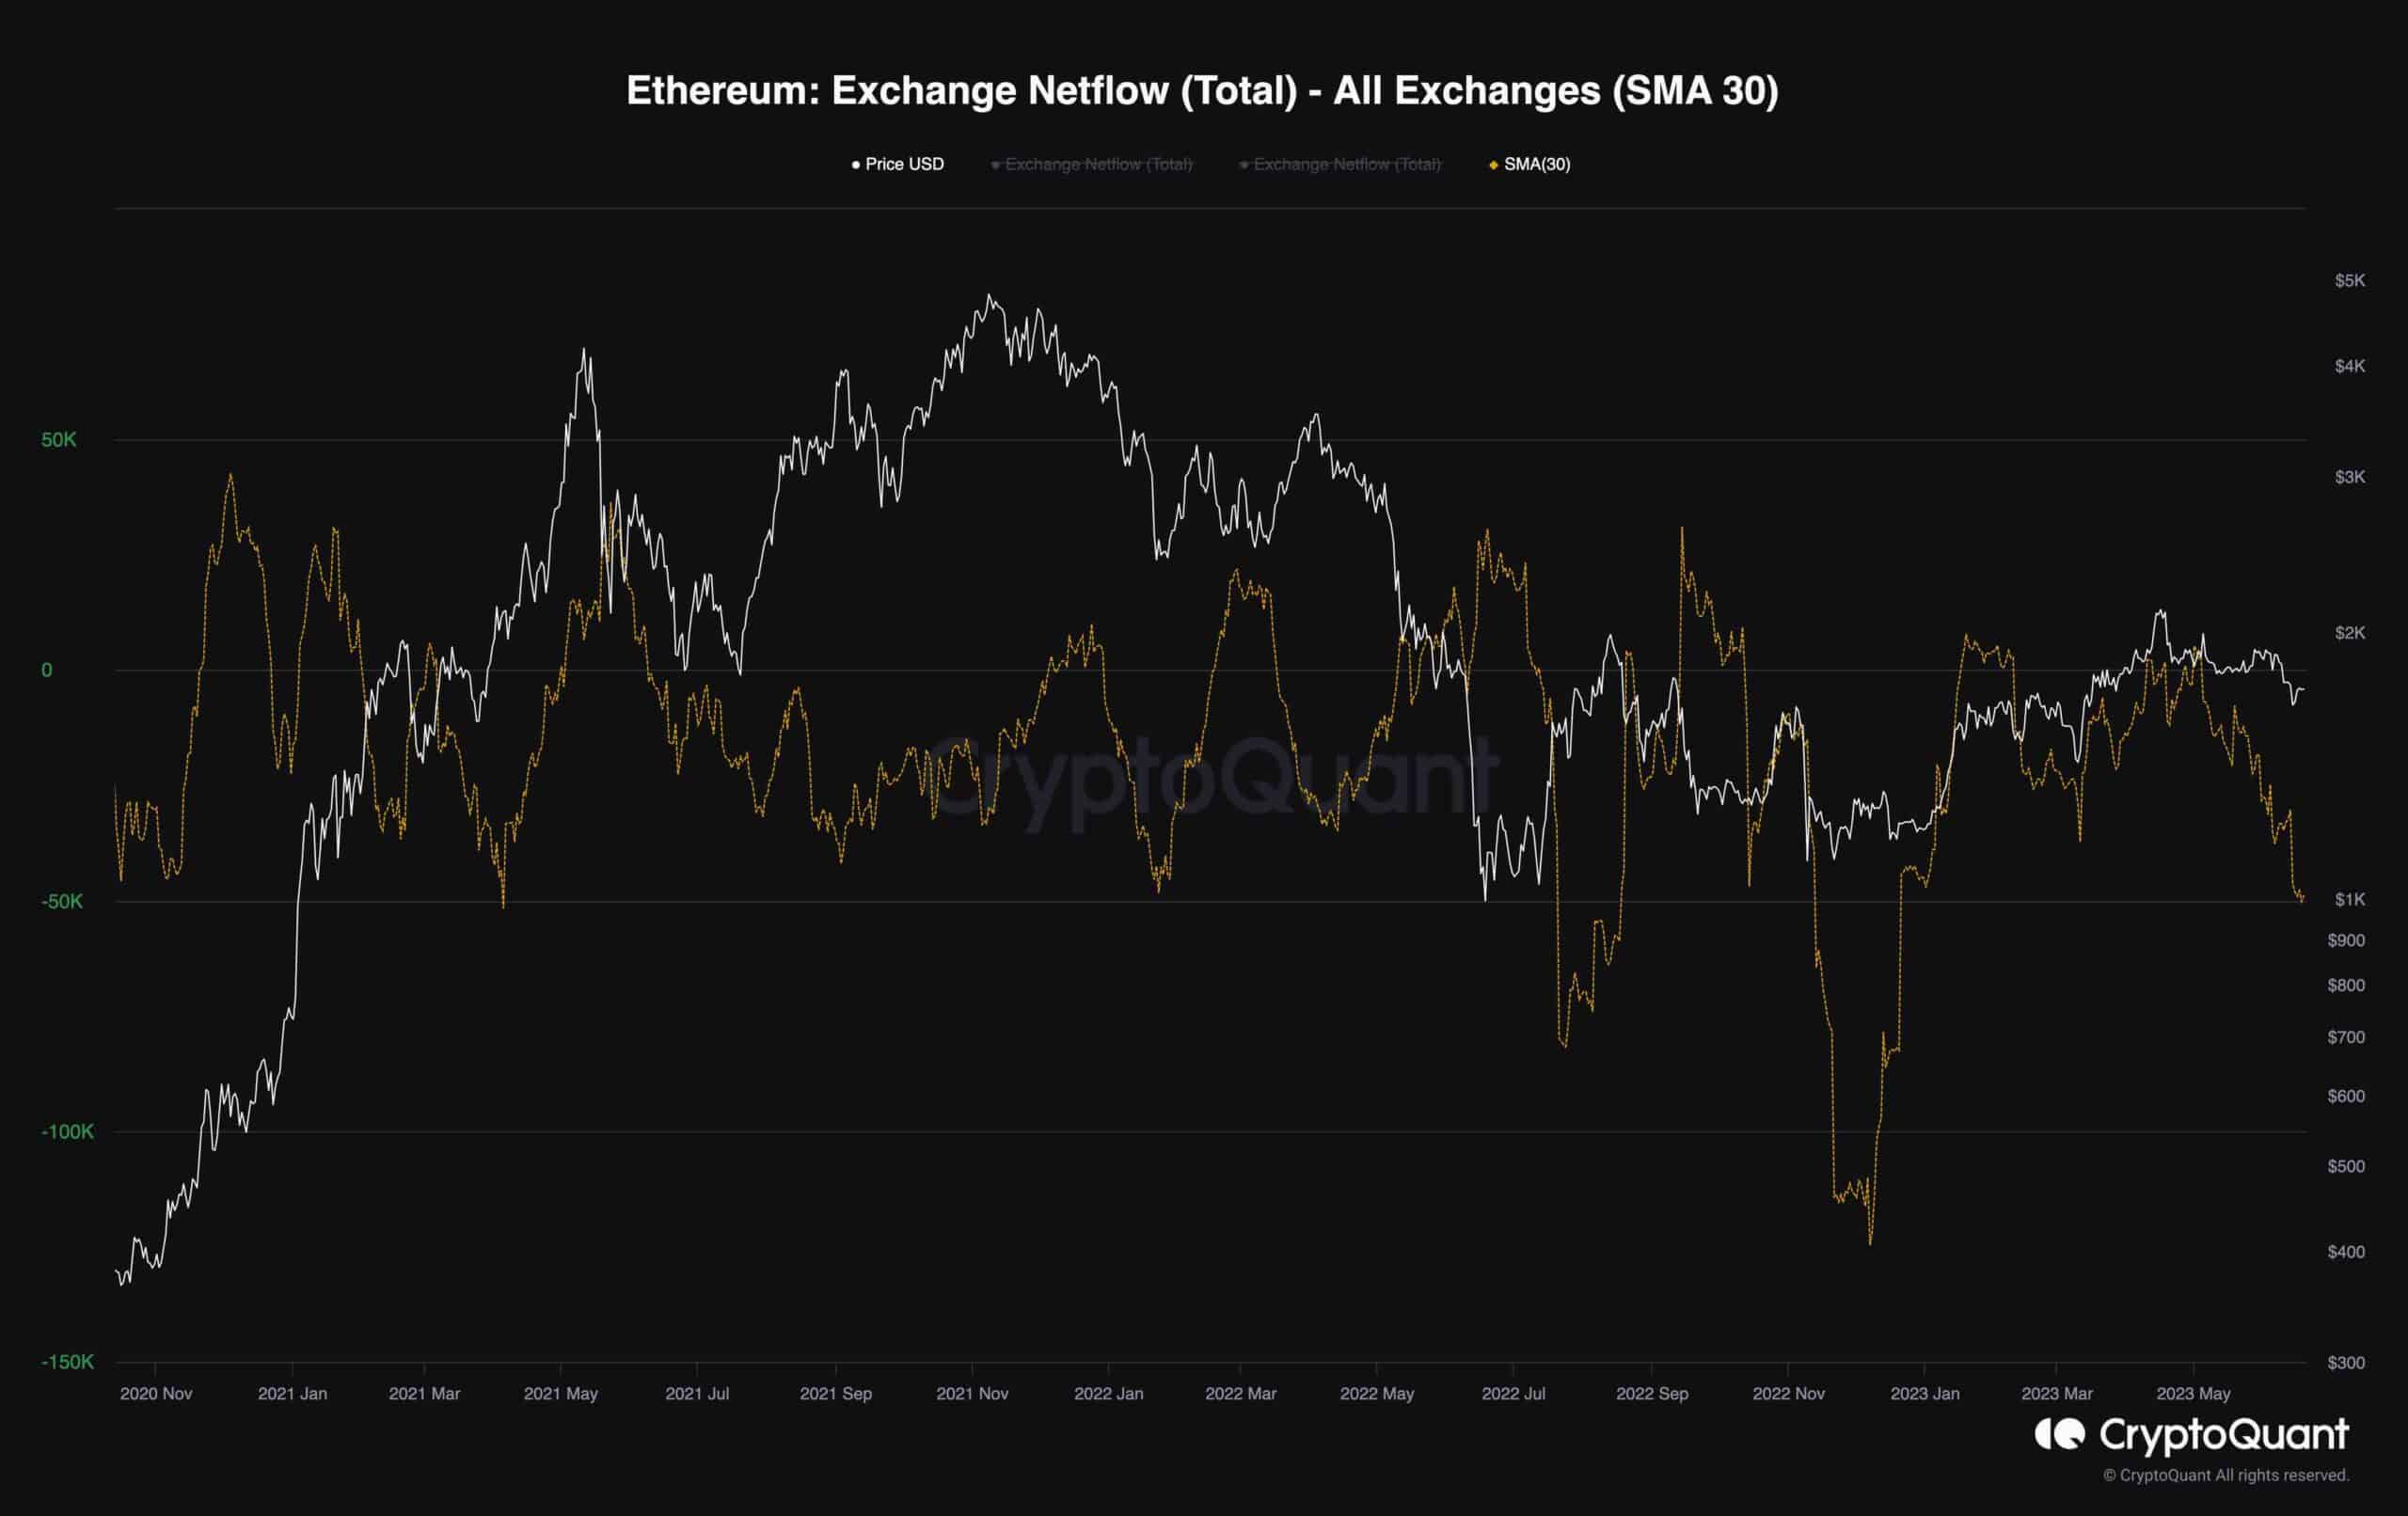 Source: TradingView