Markets are on bull activity today, with the global market cap sitting 0.9% above its previous 24-hour mark, as the total cap stands at $1.65T as of press time. The fear and greed index is 75, as greed dominates markets. The global trading volume is 1.1% up in 24 hours, at $71.9B as of press time
Bitcoin Price Analysis
Bitcoin (BTC) is riding on slight bear activity, as the Bitcoin price stood at $43.7K as of press time after recording a daily decrease of 0.13% and a weekly rise of 2.24%. As a result of the Bitcoin price, the token’s trade volume dropped by 15% during the same period and is presently at $24.2B.
The Bollinger bands are converging, showing low volatility levels on *BTC*. The Relative Strength Index (RSI) is above the average line, showing bull activity on the Bitcoin price.
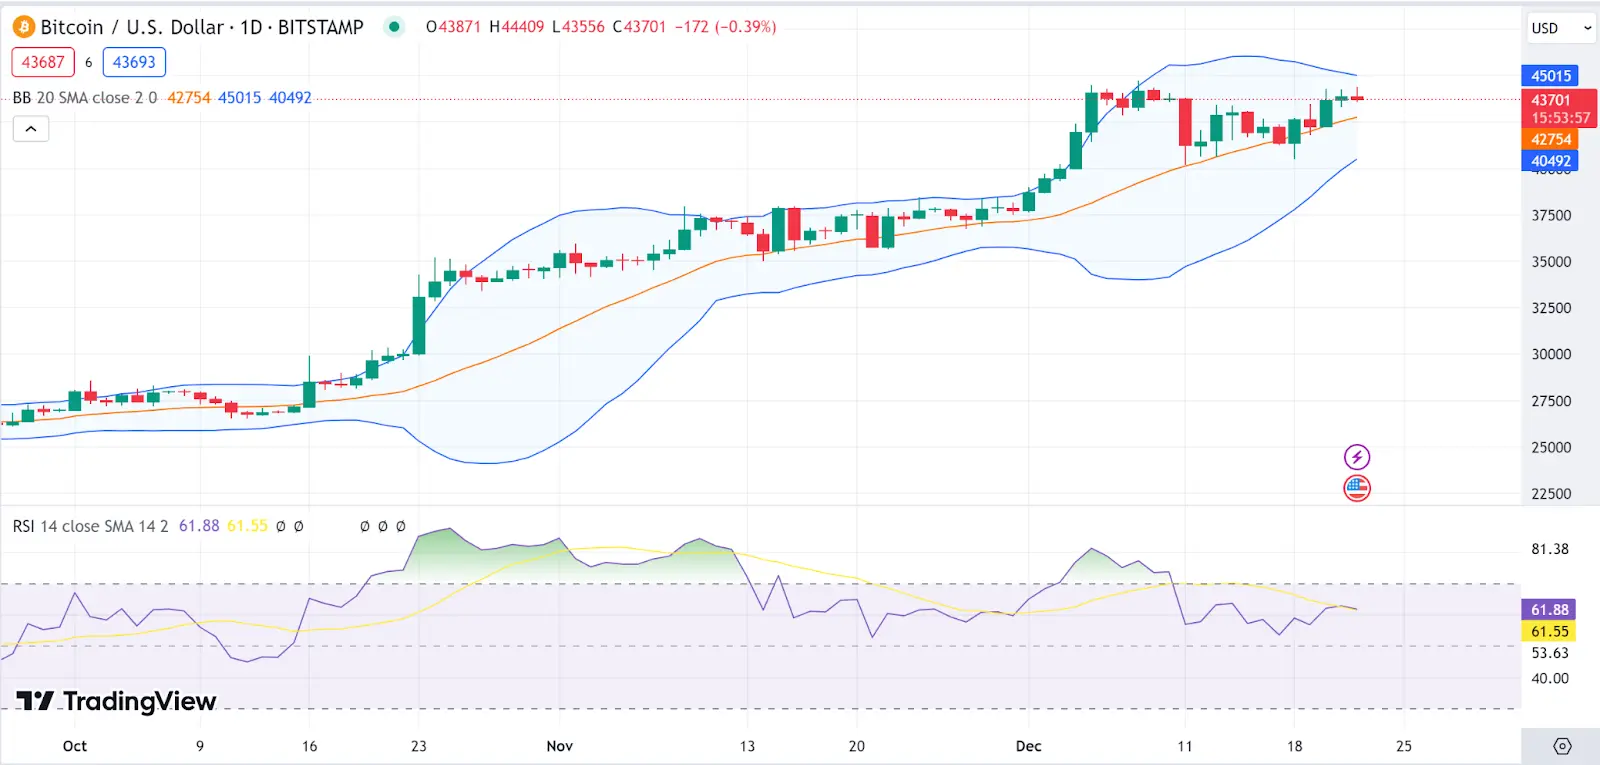 BTC 1-day chart | Source: TradingView## Ethereum Price Analysis
However, Ethereum (ETH) is riding on bull activity, as the Ethereum price stood at $2,286 as of press time after recording a daily increase of 3.3% and a weekly rise of 0.8%. As a result of the Ethereum price, the token’s trade volume jumped by 14.3% during the same period and is presently at $14.8B.
The Bollinger bands are converging, showing low volatility levels on the *ETH*. The Relative Strength Index (RSI) is still above the average line, showing bull dominance on the Ethereum price.
 ETH 1-day chart | Source: TradingView## BakeryToken Price Analysis
BakeryToken (BAKE) is riding on bull activity, as the BAKE price stood at $0.4522 as of press time after recording a daily increase of 26% and a weekly rise of 103%. As a result of the BAKE price, the token’s trade volume dropped by 7.6% during the same period and is presently at $252M.
The Bollinger bands are diverging, showing high volatility levels on the BAKE price. The Relative Strength Index (RSI) is still above the average line in the overbought region, showing bull dominance on the BAKE price.
 BAKE 1-day chart | Source: TradingView## Solana Price Analysis
Solana (SOL) is riding on bull activity, as the Solana price stood at $95 as of press time after recording a daily increase of 9% and a weekly rise of 24%. As a result of the Solana price, the token’s trade volume jumped by 32% during the same period and is presently at $5.8B.
The Bollinger bands are diverging, showing high volatility levels on the *SOL*. The Relative Strength Index (RSI) is still above the average line in the overbought region, showing bull dominance on the Solana price.
 SOL 1-day chart | Source: TradingView## PancakeSwap Price Analysis
PancakeSwap (CAKE) is riding on bull activity, as the CAKE price stood at $2.4 as of press time after recording a daily increase of 9% and a weekly rise of 4.9%. As a result of the PancakeSwap price, the token’s trade volume jumped by 254% during the same period and is presently at $284M.
The Bollinger bands are slightly diverging, showing high volatility levels on the CAKE price. The Relative Strength Index (RSI) is still above the average line, showing bull dominance on the CAKE price.
 CAKE 1-day chart | Source: TradingView
Isenção de responsabilidade: As informações contidas nesta página podem ser provenientes de terceiros e não representam os pontos de vista ou opiniões da Gate. O conteúdo apresentado nesta página é apenas para referência e não constitui qualquer aconselhamento financeiro, de investimento ou jurídico. A Gate não garante a exatidão ou o carácter exaustivo das informações e não poderá ser responsabilizada por quaisquer perdas resultantes da utilização destas informações. Os investimentos em ativos virtuais implicam riscos elevados e estão sujeitos a uma volatilidade de preços significativa. Pode perder todo o seu capital investido. Compreenda plenamente os riscos relevantes e tome decisões prudentes com base na sua própria situação financeira e tolerância ao risco. Para mais informações, consulte a
Isenção de responsabilidade.
