The price of Ethereum (ETH) has struggled for most of October in an effort to maintain strength above the 4,000 USD level. Although it has still held an overall upward trend, ETH is currently trading around 3,881 USD, down 2.4% for the week, indicating hesitation in the context of Bitcoin bouncing back.
On-chain signals and charts clearly indicate one story: Ethereum's bounce back is still awaiting confirmation. Here are three reasons explaining why ETH has not been able to surpass the 4,000 USD threshold recently and why the real challenge lies at higher levels.
Whales are selling and the accumulation process has slowed down
The first sign of pressure comes from whales. Since October 20, whale addresses have reduced their total holdings from 100.60 million ETH to 100.46 million ETH — equivalent to a sale of about 140,000 ETH, worth approximately 550 million USD at current prices. This continuous selling creates a silent resistance level for any short-term recovery efforts and keeps the market in a cautious state.
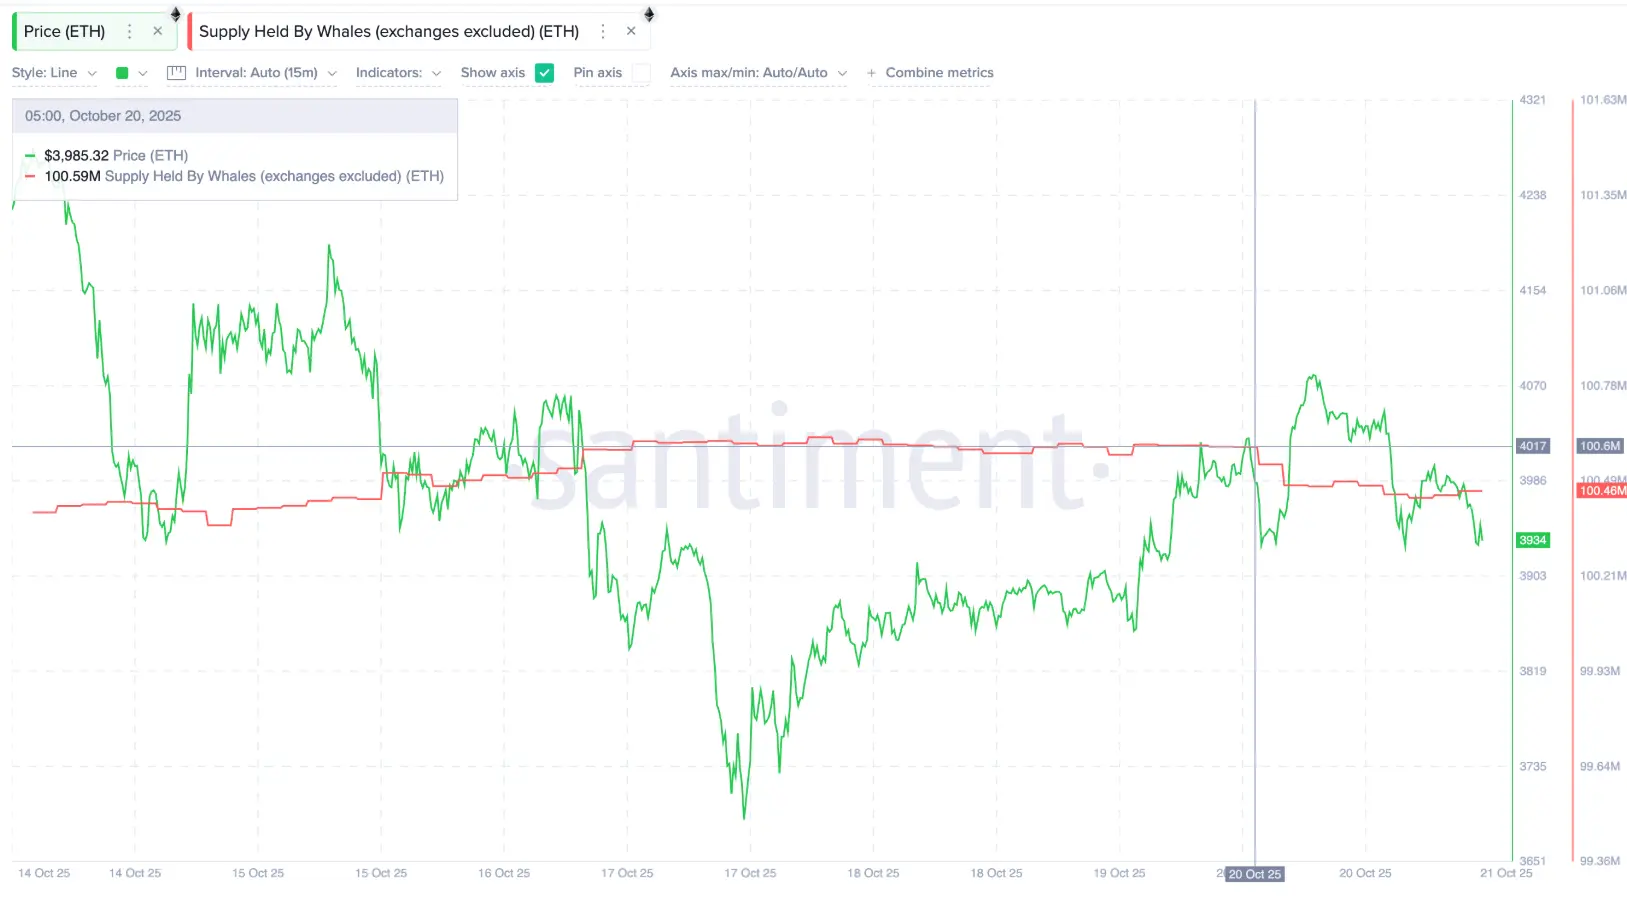 Ethereum whales are active | Source: SantimentAt the same time, the Ethereum holder accumulation ratio (HAR) — tracking the ratio of active holders adding to positions versus cutting positions — has stalled near 30.77%. This ratio had increased at the beginning of October but has plateaued since mid-month, indicating that new accumulation is slowing down. Simply put, current investors are not buying aggressively, and new capital has yet to enter the market.
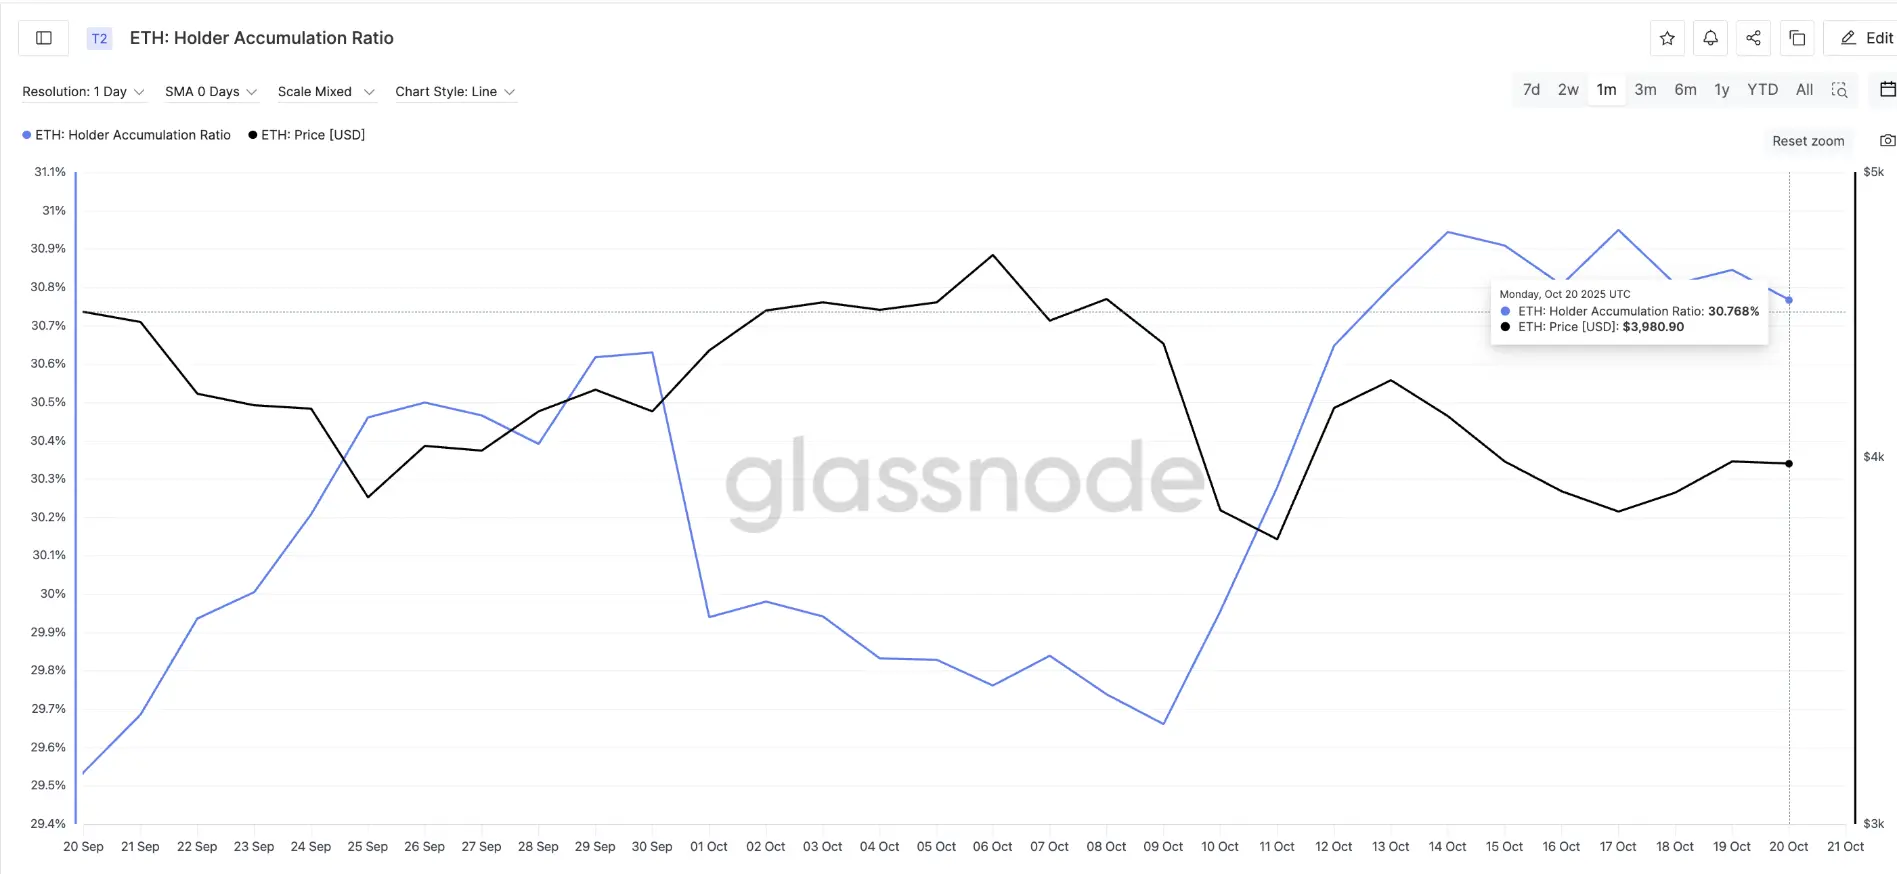 The Ethereum accumulation rate is stagnant | Source: GlassnodeWhen HAR is flat after a stable increase, it often signals that investors are waiting for a clear breakout before deciding to buy back. This cautious stance from both whales and active investors explains Ethereum's recent hesitation around the $4,000 level.
Strong resistance at 3.955 USD
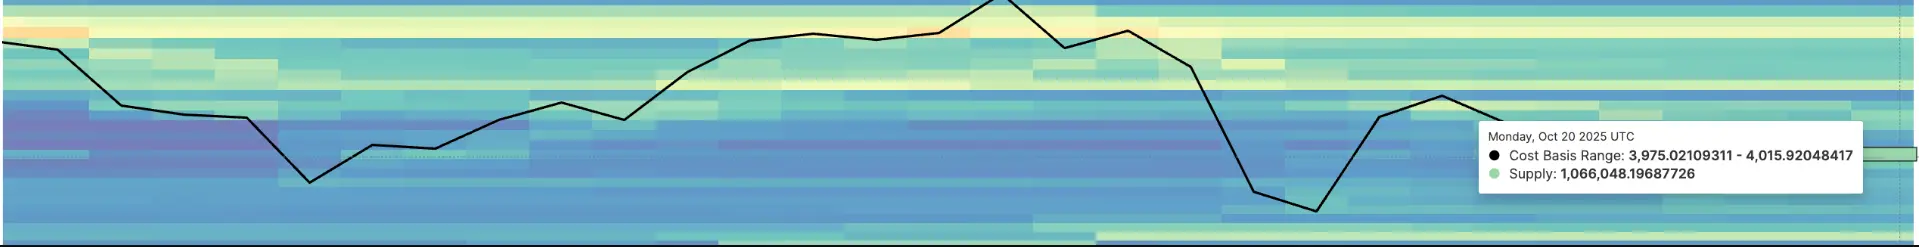
The second reason lies in the distribution cost map (CBD) of Ethereum — a tool that shows where most of the ETH supply last changed hands. This helps to identify the “supply wall,” or price areas where many investors may sell to offset previous losses.
Currently, a dense resistance band exists between 3,955 USD and 4,015 USD, with about 1.06 million ETH bought in this range. This makes the area just above the current ETH price difficult to break through, as each move towards 4,000 USD will create additional selling pressure.
 Main ETH supply area | Source: GlassnodeAdditionally, another large cluster is located between $4,270 and $4,314, where nearly 1.33 million ETH have been purchased. This area is close to the technical resistance at $4,340, meaning Ethereum may face a real breakout challenge there.
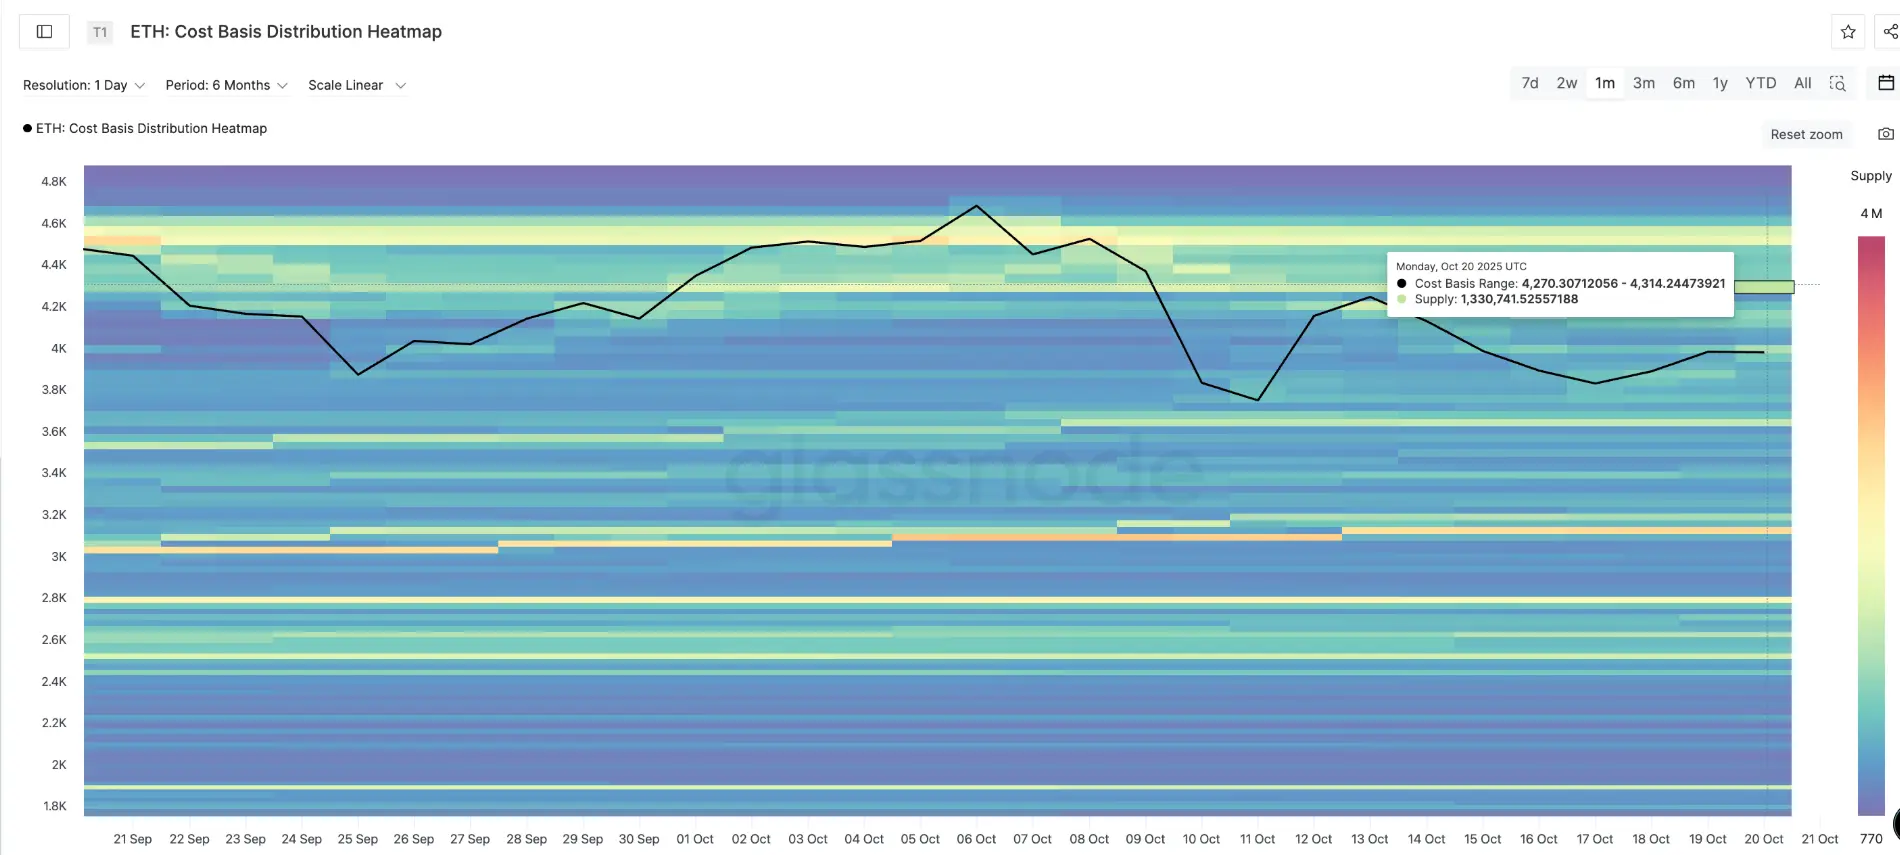 Ethereum price chart | Source: GlassnodeUntil ETH surpasses these levels, investors are likely to continue taking profits near $4,000, preventing any sustainable move higher.
The Ethereum price structure remains positive, but it needs to close above 4,340 USD.
Despite these obstacles, the structure of Ethereum remains positive. The price continues to adhere to an upward trend line that has been maintained since the beginning of August, sustaining the overall upward trend.
The daily chart shows that ETH is reacting to the Fibonacci retracement levels drawn from the previous bounce back. The Fibonacci level of 0.618 is around 4,200 USD, while the level of 0.786 is near 4,340 USD — both coincide with major resistance areas seen on-chain. A daily candle closing above 4,340 USD will confirm a breakout and could pave the way to 4,520 USD and even 4,960 USD, testing the all-time high.
However, the first obstacle to overcome is 4,000 USD, corresponding to the Fibonacci level of 0.382. This is also the area where the price of ETH has been trying to convincingly break through since October 16.
Momentum indicators also support this view. The Relative Strength Index (RSI) — measuring the balance between buying and selling pressure — shows a hidden bullish divergence. This means that while the price has made higher lows since August 2nd, the RSI has made lower lows, often signaling an ongoing uptrend despite short-term weakness.
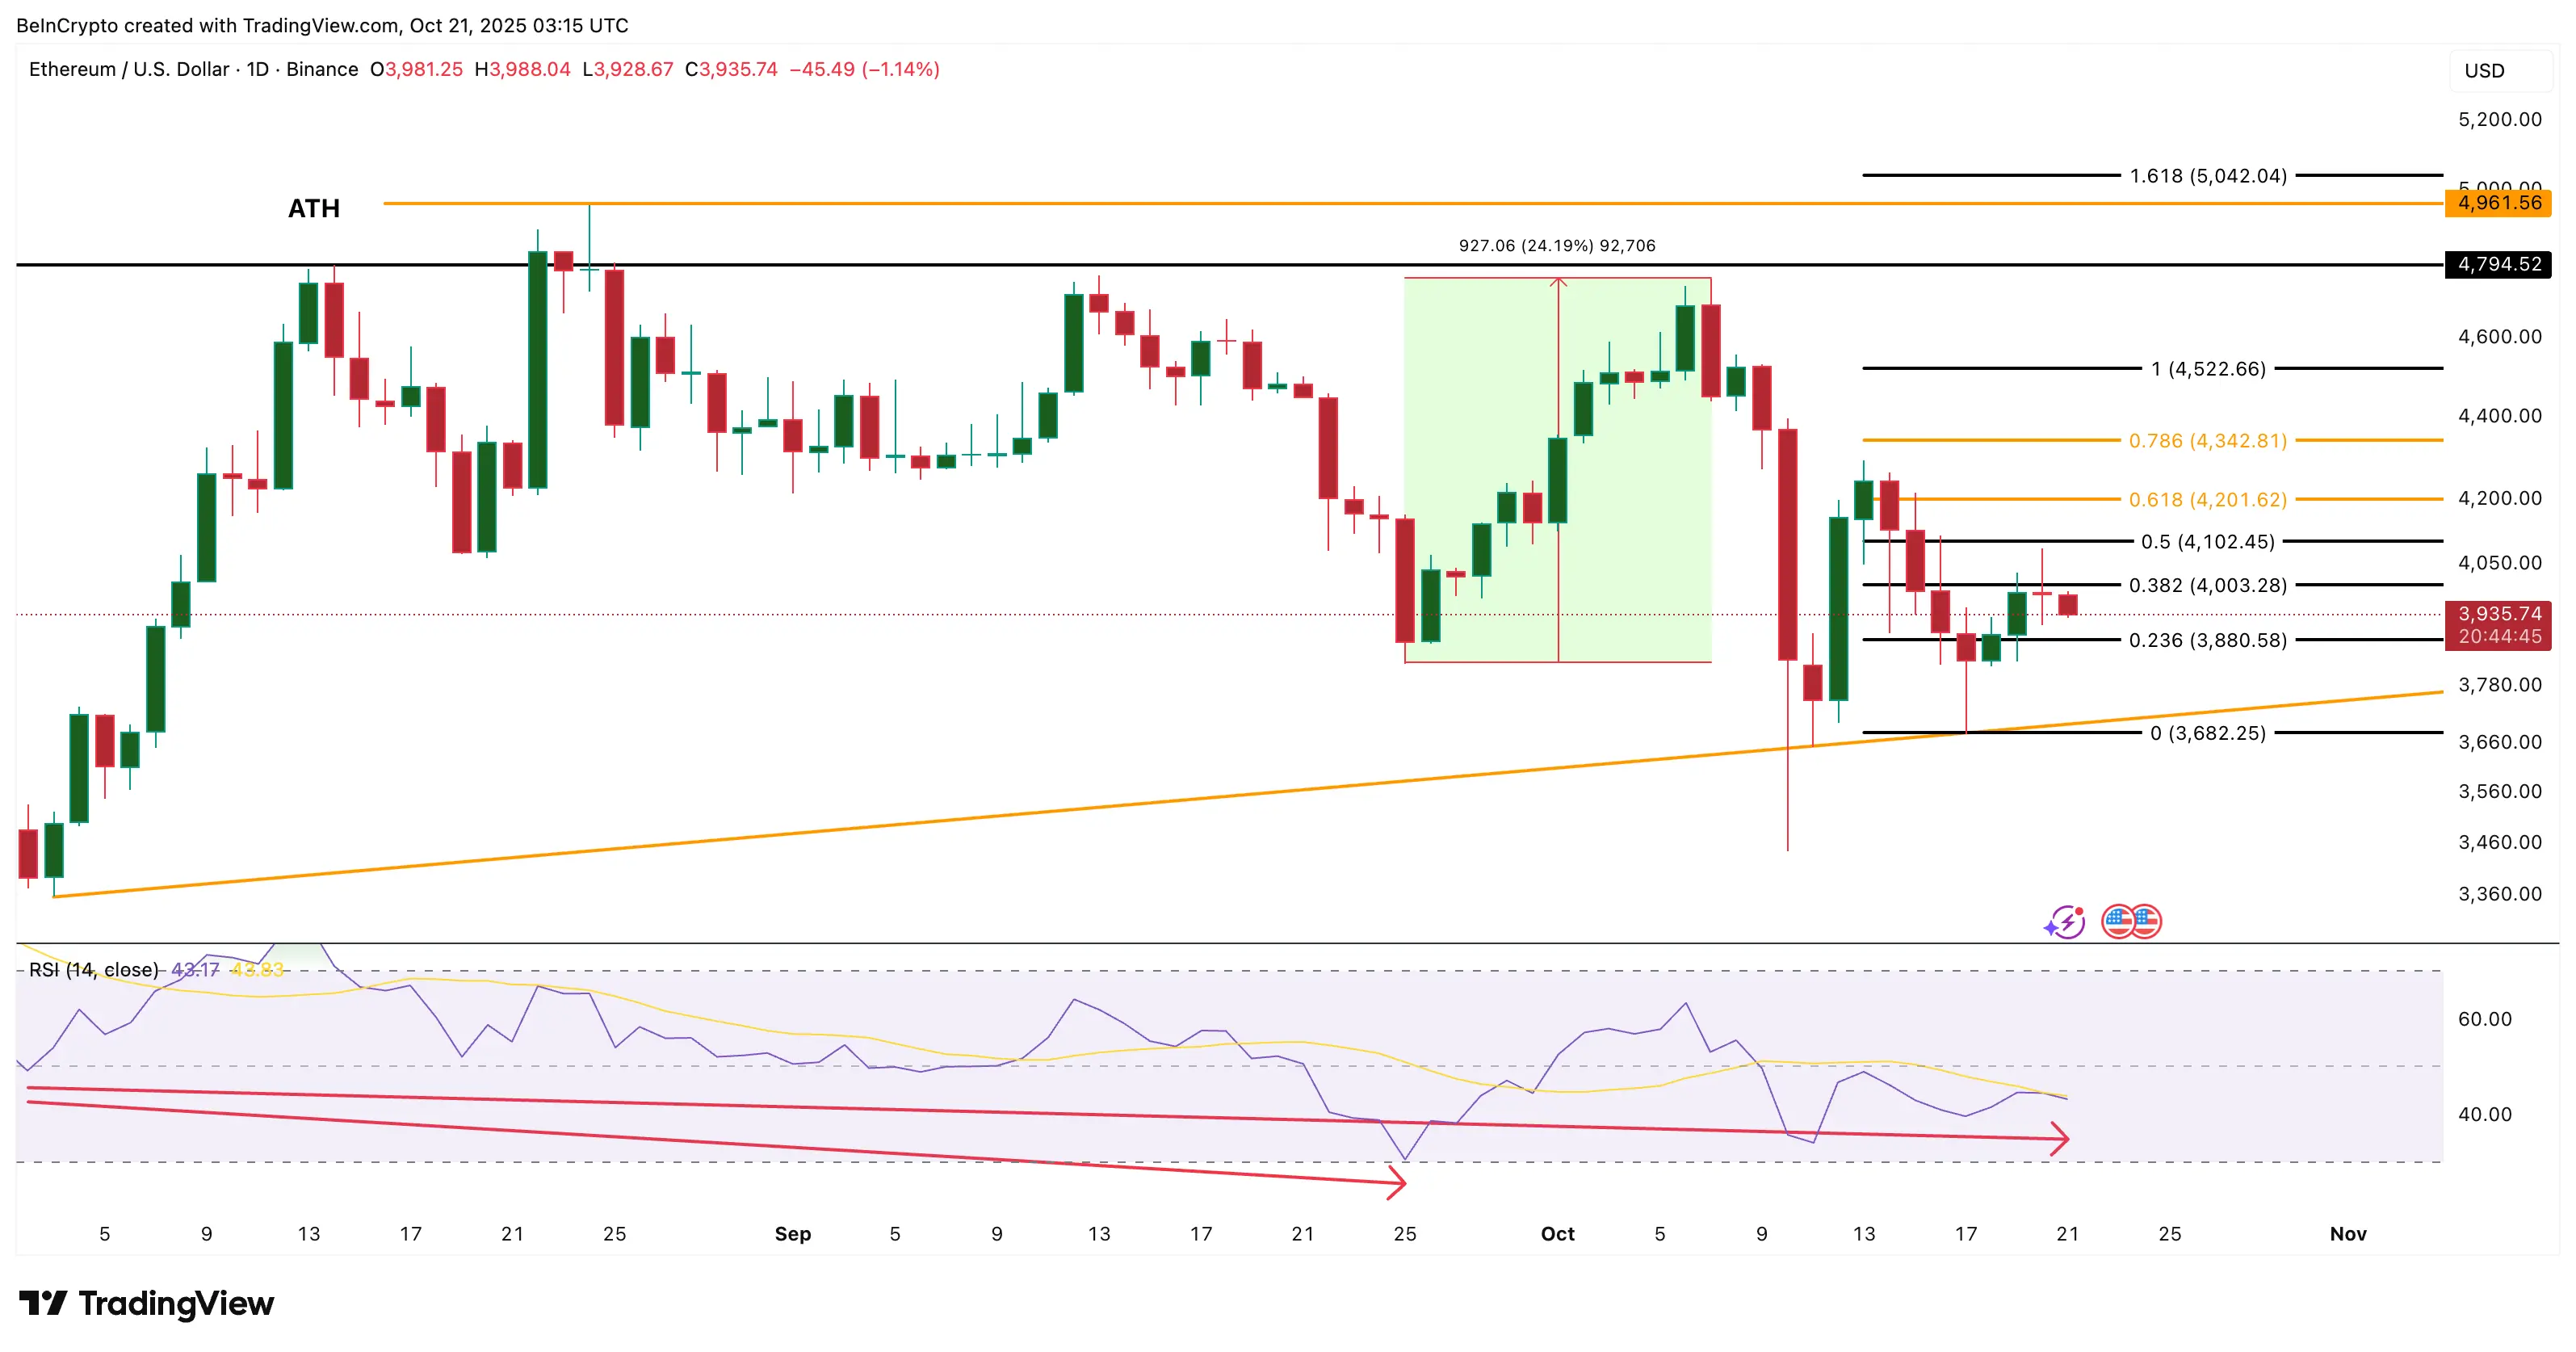 Ethereum price analysis | Source: TradingViewThe last time this divergence occurred, between August 2 and September 25, Ethereum had increased nearly 24%, nearing $4,880. A similar move from the current level could bring ETH to the $4,960 area. However, this can only happen after a confirmed breakout above $4,340.
If ETH cannot hold the level of 3,880 USD, short-term sentiment may turn negative, which will open up support at 3,680 USD — the bottom of its long-term trend line.
Mr. Teacher
Disclaimer: The information on this page may come from third parties and does not represent the views or opinions of Gate. The content displayed on this page is for reference only and does not constitute any financial, investment, or legal advice. Gate does not guarantee the accuracy or completeness of the information and shall not be liable for any losses arising from the use of this information. Virtual asset investments carry high risks and are subject to significant price volatility. You may lose all of your invested principal. Please fully understand the relevant risks and make prudent decisions based on your own financial situation and risk tolerance. For details, please refer to
Disclaimer.