NFT trading activity showed signs of recovery in the third quarter of 2025, breaking the long downward trend following the post-bull market.
After two years of market contraction and narrative shifts, the on-chain market has found a new footing, with its growth drivers no longer stemming from blue-chip collectibles or speculative artworks, but rather from lower-cost infrastructure, loyalty programs, and sports-related assets.
The core of trading these assets lies in their practicality, not in their status symbol.
NFT trading volume rebounds, sales reach an all-time high
With the expansion upgrade of Ethereum driving transaction activities to migrate to L2, Solana has established a foothold with its high throughput and compression technology. Bitcoin inscriptions have developed into a collection culture that is linked to the fee market, alternating between boom and bust. The focus of the NFT market has shifted towards low-cost infrastructure and practical application scenarios.
Today, the key to driving market growth is the level of transaction fees and distribution channels, rather than avatar-type NFTs.
The economic landscape has been reshaped after the Dencun upgrade, Ethereum's EIP-4844 proposal has lowered the data costs for rollups, reducing L2 transaction fees to a few cents, and supports gasless minting or sponsored minting processes aimed at mainstream users.
After the upgrade, the L2 layer transaction fees have decreased by over 90%. This change has been reflected in the minting activities and has also helped Base become a core distribution channel.
In the Solana ecosystem, compression technology enables the large-scale issuance of NFTs for loyalty programs and permissioned access applications.
The deployment cost for 10 million compressed NFTs is approximately 7.7 SOL, even under high load conditions, the median transaction fee is still close to 0.003 USD.
Bitcoin inscriptions have opened up an independent track, and their development is closely related to the memory pool cycle and miner income. As of February 2025, the number of inscriptions has exceeded 80 million, ranking in the top three based on historical NFT sales.
Demand Side Bounces Back but There Are Concerns
DappRadar data shows that in the third quarter of 2025, NFT trading volume nearly doubled year-on-year, reaching $1.58 billion, with sales totaling 18.1 million transactions, setting a historical high for quarterly trading activity.
Sports-related NFTs have performed particularly well, with trading volume surging by 337% month-on-month to $71.1 million. The cyclical practical value, rights and interests, and loyalty benefits of these assets decouple their consumption behavior from the base price.
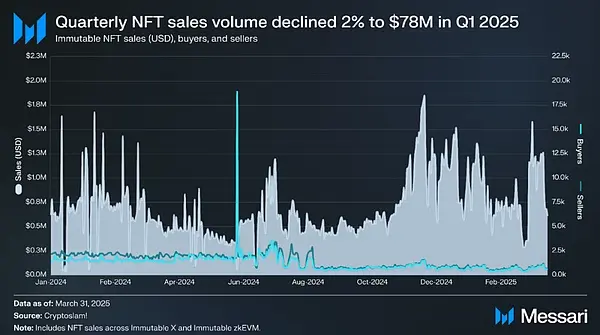
The summer market initially saw a rapid rebound, followed by a cooling off: According to CryptoSlam statistics, sales reached $574 million in July 2025 (the second highest of the year), but in September, influenced by a decline in risk appetite in the overall cryptocurrency market, sales fell by approximately 25% month-on-month.
This trend confirms that the market has entered a new phase of “declining average prices,” while also indicating that even if the number of independent users and the categories of practical applications remain stable, the total trading volume of NFTs will still fluctuate with the overall volatility of the crypto market.
The key role of distribution channels is becoming increasingly prominent. The wallet with built-in key functionality and sponsorship fee mechanism has eliminated the friction costs that hindered user onboarding in the previous cycle.
The Coinbase smart wallet offers key login and gas fee sponsorship services in supported applications; Phantom announced in January 2025 that it reached 15 million monthly active users, which provides traffic support for mobile and social minting channels.
In a blockchain network where culture and social interaction mutually empower each other, the ability to distribute and reach is crucial, and Base is a typical example.
This year, thanks to low-cost minting, Zora's batch minting rhythm, and distribution channels associated with Farcaster, Base's NFT trading volume has surpassed Solana on some metrics.
This trend means that creators are starting to first model distribution data when choosing an issuance platform, and then reverse-match the fee scheme.
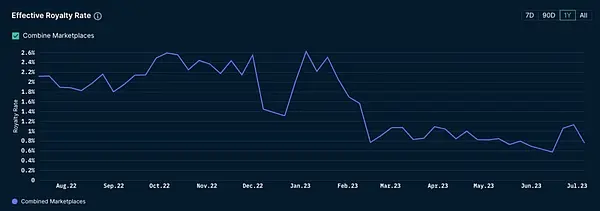
Royalties are no longer the core of the income structure
After the market peak in 2022, the competition between trading platforms led to royalties becoming optional in most markets, resulting in a significant decline in creator royalty income.
According to Nansen data, royalty revenue in 2023 hit a two-year low and failed to recover to previous levels.
In contrast, a trend is emerging where trading platforms that support the mandatory collection of royalties are gradually rising. At the end of 2023, Magic Eden partnered with Yuga Labs to launch an Ethereum trading platform that enforces the collection of creator royalties, opening up protected distribution channels for influential brands.
The current market has formed a dual-track pattern: In the open market, low commission rates, primary market sales, intellectual property (IP) cooperation, and retail linkage constitute the main sources of profit for creators; while the closed ecosystem enforces royalties through contractual agreements, undertaking high-end NFT issuance.
In the field where the incentive mechanism governs the flow of funds, the market share of trading platforms is still in a state of dynamic change.
In the Solana ecosystem, Magic Eden and Tensor form a duopoly competitive landscape, with their market shares fluctuating according to reward plans and program designs, typically ranging between 40% and 60% at different times.
This is not a structural change, but rather a result of the incentive cycle. The market share chart may seem to show a pattern shift, but it will ultimately revert to the mean.
For creators, the key insight is to negotiate a distribution plan during the issuance planning stage, rather than defaulting to a single platform.
User Flow Reveals Short-term Development Route
The reason why sports, ticketing, and loyalty programs can achieve scale expansion is that their benefits are cyclical and repetitive, and the core on-chain functions have been embedded in existing ticketing and e-commerce processes.
DappRadar's Q3 2025 data shows that the trading volume of sports NFTs has outpaced the overall market, and this does not yet account for full-season or league-level partnership projects.
The growth in the gaming sector is even more robust. According to Messari data, Immutable's zkEVM architecture and real-time data show a continuous increase in transactions. Its design of “ensuring security at the Ethereum layer and optimizing user experience at the L2 layer” is highly aligned with the demand for asset custody and ongoing secondary trading fees.
Intellectual property and licensing cooperation is another important bridge for NFTs to transition from digital collectibles (JPEGs) to consumer channels. Pudgy Penguins has entered over 3,000 Walmart stores, establishing a landing channel from NFTs to physical retail and licensing revenue.
For creators, the costs and user experiences of various blockchains are now clearly distinguishable:
Ethereum's L1 layer still dominates the fields of traceability certification and high-value artworks, with most platforms experiencing significant fluctuations in gas fees, and royalty collection being optional.
After the Dencun upgrade, the transaction fees on Ethereum L2 layers (such as Base) have dropped to a few cents, supporting sponsored or gasless transactions, and Base provides a social distribution channel through the Farcaster ecosystem.
Solana's compression technology keeps the issuance cost of millions of NFTs at a dollar level, and relies on a mobile-first wallet ecosystem for widespread reach;
Bitcoin inscriptions focus on the field of scarce collectibles, and the rise in transaction fees is a market characteristic rather than a flaw.
Evolution of the Macroeconomic Environment
The annual transaction volume of the NFT market in 2025 is expected to be between 5 billion and 6.5 billion USD, with an average selling price in the first half of the year maintained at 80 to 100 USD, establishing a benchmark for next year's market scenario.
Based on the monthly sales data from CryptoSlam, combined with the category breakdown analysis from DappRadar:
Bear Market Scenario: If the overall cryptocurrency market stagnates and average prices fall, the total transaction volume of NFTs may drop to between 4 billion and 5 billion USD. Fee-sensitive application scenarios will focus on Solana and Ethereum Layer 2, while the Ethereum Layer 1 art market remains stable, and the inscriptions market fluctuates with Bitcoin transaction fee cycles.
Benchmark Scenario: If embedded wallets and social minting channels continue to expand, and sports and live event projects scale across seasons, brand owners attempt to launch new products on mandatory royalty platforms, the total transaction volume of NFTs is expected to reach between $6 billion and $9 billion.
Bull Market Scenario: If breakthrough growth is achieved in mobile distribution (widespread adoption of Base and key login minting processes, Phantom monthly active users surpassing 20 million, ticketing pilot projects becoming mainstream solutions, and continuous trading of gaming assets), the total trading volume of NFTs may reach 10 billion to 14 billion USD.
In the three scenarios mentioned above, the market shares of Ethereum L2 and Solana will dominate, while Ethereum L1 will focus on niche areas, and Bitcoin inscriptions will remain stable as a scarce collectible track.
Six key variables determine the growth rhythm.
-
Wallet user experience and distribution capability: Key observation metrics include key adoption rate, sponsorship fee usage, and the monthly active user numbers of Phantom and Coinbase smart wallets.
-
The scope of compulsory royalty collection: It affects high-end NFT issuance, including the policy shift of OpenSea, as well as the health of trading platforms supporting creators within the Ethereum ecosystem.
-
Scale cooperation in sports and ticketing: Expand from pilot projects to full season cooperation, turning one-time transaction amounts into recurring revenue.
-
The issuance rhythm of Base and Zora: Assess the sustainability of social distribution channels through monthly minting volume, Base's share of total NFT trading volume, and the interaction effect of Farcaster Frames.
-
Adoption rate of Solana compression technology: Assessing whether loyalty programs and media applications have transitioned from pilot to normalization by analyzing the compressed NFT minting volume and the deployment cost per million assets.
-
Bitcoin transaction fee cycle: Its correlation with inscriptions and runes will vary with the level of congestion in the memory pool, continuously affecting the pricing of collectibles.
But two risks always exist. Wash trading and spam can still distort GMV and sales, so looking at the average sales and a dashboard filtered by natural search is a safer approach.
The incentive mechanism of the trading platform may create the illusion of a “pattern change” in the market share chart (actually influenced by the airdrop cycle), especially in the dual oligopoly pattern of Solana.
Therefore, the issuance plan of creators should take this volatility into account from the very beginning.
Another constraint on the operational level is revenue design: against the backdrop of royalties being largely optional terms in the open market, primary market sales, intellectual property licensing, and retail collaborations have taken on more revenue responsibilities.
However, closed platforms with mandatory royalties can only provide high-end distribution channels for a few brands, making it difficult for most creators to take advantage of.
Industry Transformation from “Endgame” to “Migration”
The JPEG hype has come to an end, the cost of NFT infrastructure has significantly decreased, and application scenarios are shifting towards ticketing, sports, gaming, and intellectual property fields. Wallet and distribution systems are also beginning to penetrate existing user scenarios.
The blue chip NFT flagship project “Bored Ape Yacht Club” remains in a precarious situation for those investors who have previously invested six figures to purchase AWS-hosted JPEGs.
An NFT from this series that was sold for over 74 ETH in 2021 is now worth only 9 ETH, a drop of 87% over three years.
The speculative frenzy in the NFT space may have come to an end, but will this allow the underlying technology to gain recognition in practical real-world scenarios?
The answer remains to be tested by time, but the existing signs are promising, although this hope is unrelated to those who are stuck at high positions.
The NFT market in the third quarter of 2025 closed with a trading volume of $1.58 billion and 18.1 million transactions, while the market structure has continued to evolve towards practicality.