Stellar (XLM) has undergone a month of falling adjustment, losing 14.7% of its value as the overall market sentiment declines. However, in the past week, the price of XLM has mainly moved sideways, indicating that the adjustment process may be gradually coming to an end.
Currently, several technical indicators and important on-chain data are signaling that the balance between buyers and sellers of XLM may soon be disrupted in a positive direction. Let's analyze in detail!
The battle between buyers and sellers is underway.
On the daily chart, XLM is operating in a symmetrical triangle pattern — a structure that often appears when buying and selling forces are balanced, reflecting market hesitation. This pattern is formed by lower highs and higher lows, compressing prices into an increasingly narrow range before a breakout occurs.
It is noteworthy that both the upper and lower trend lines of the triangle only have two touch points, indicating that the current structure is still quite weak on both sides. This means that a small push from either side could quickly cause the price to break out of this accumulation zone.
In a context where neither side has complete control, a short-term increase or decrease can also determine the next trend. The current model accurately reflects the state of indecision, where each small fluctuation tests the confidence of investors but is not enough to establish a clear trend. Therefore, the upcoming breakout will depend on which side acts first, rather than which side is stronger.
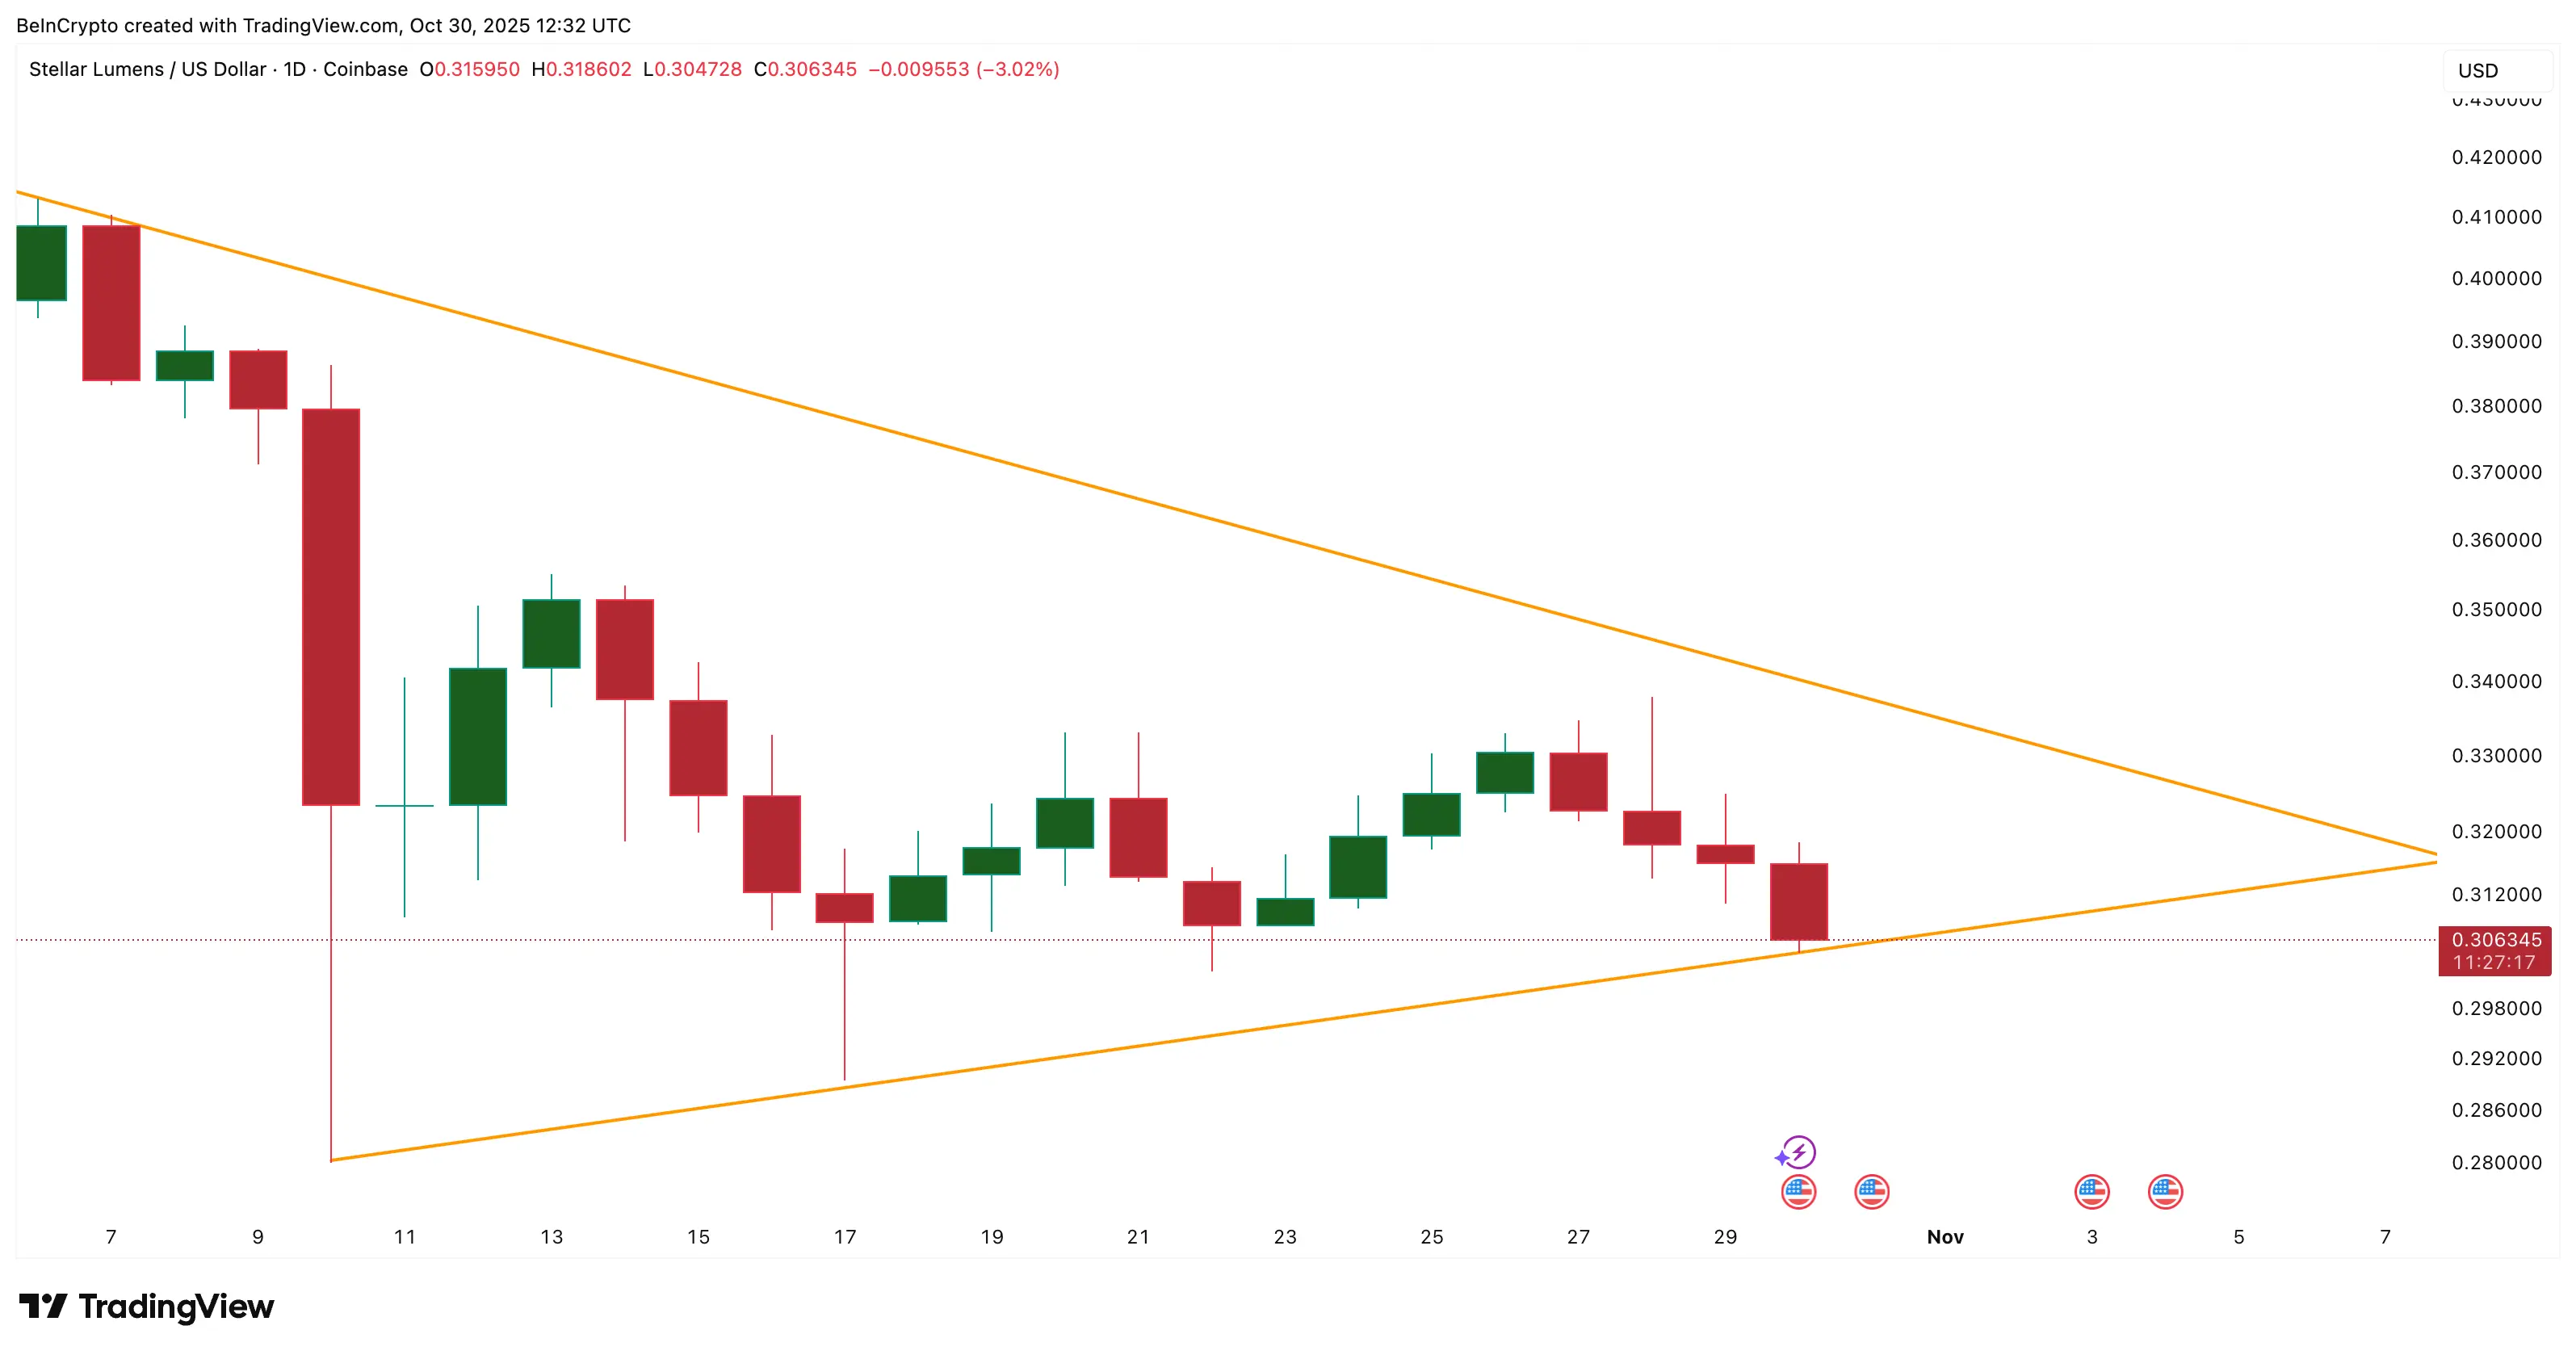 The battle between buyers and sellers of XLM | : TradingViewNotably, this pattern appears after three months of a fall of over 19%, so just a slight recovery could mark the beginning of a larger recovery cycle if the growth momentum is maintained.
Selling pressure is falling rapidly
The Wyckoff volume chart — a tool for tracking buying and selling strength through colored bars — is reinforcing the aforementioned observation. The yellow bars representing selling pressure have continuously narrowed since yesterday, indicating that sellers are gradually retreating while buyers are starting to absorb the existing supply.
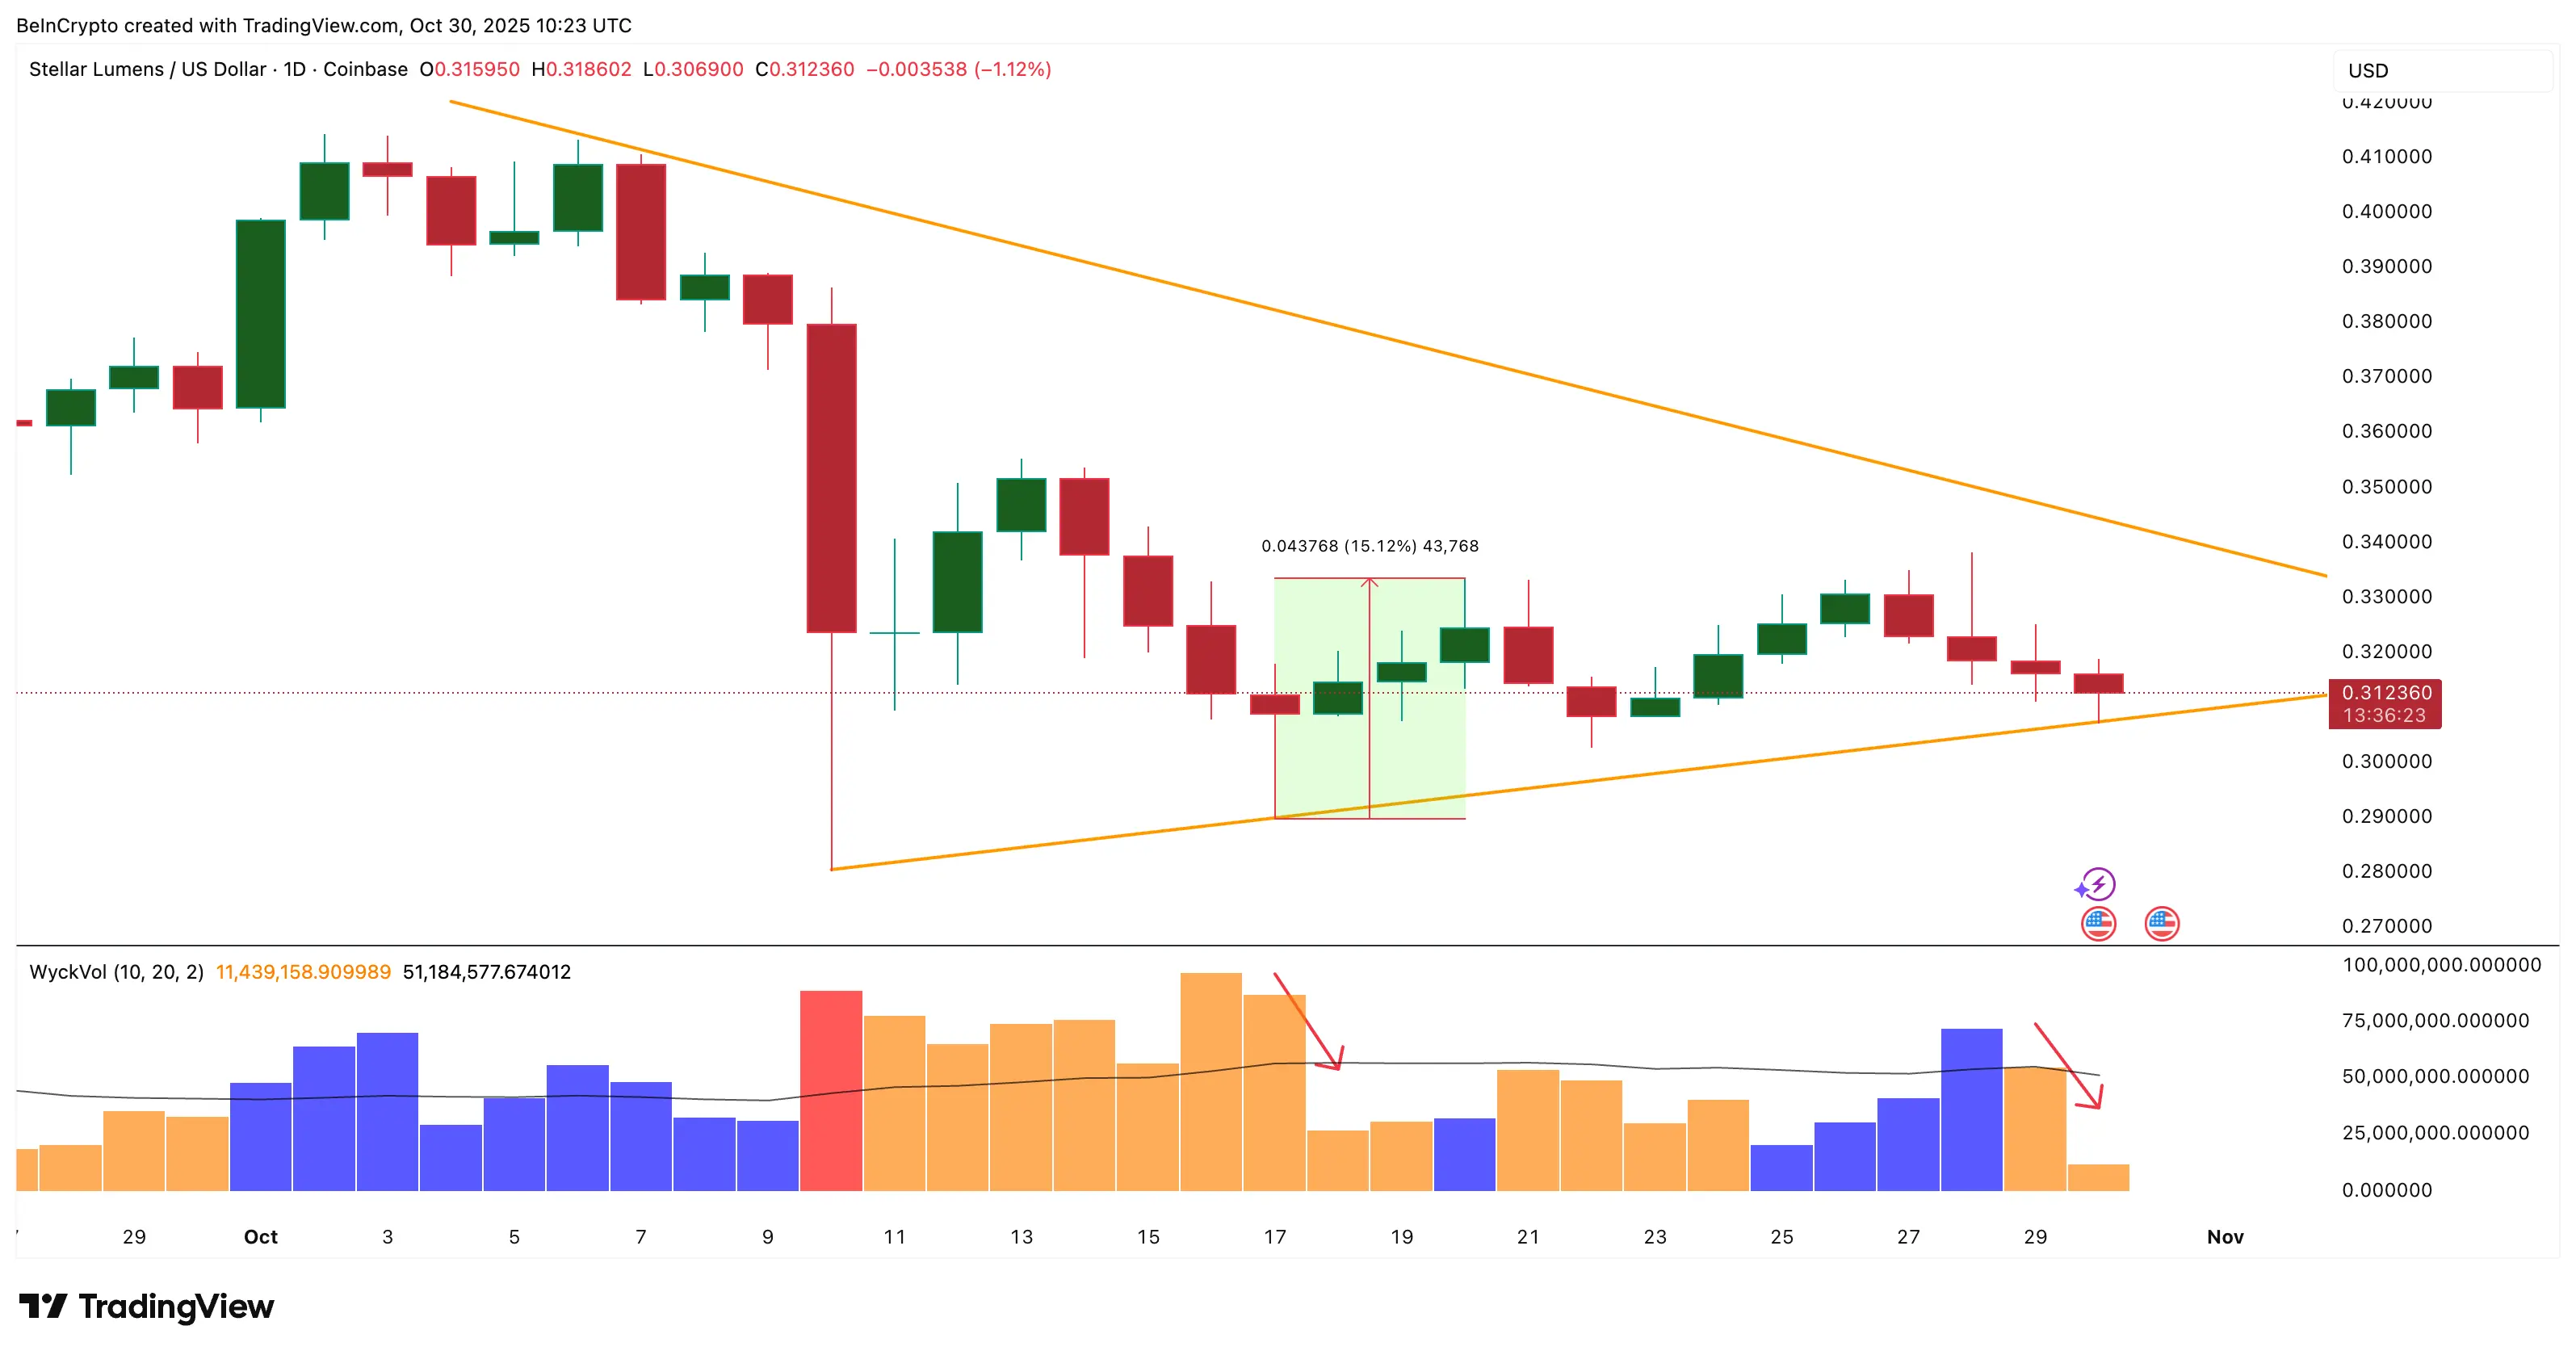 The selling pressure on XLM is falling sharply | Source: TradingViewNotably, a similar pattern emerged on October 17 and 18, when the decrease in selling volume paved the way for XLM's price to surge by 15.1% shortly thereafter. Currently, this structure is showing signs of forming again, reinforcing the possibility that the selling pressure is dwindling. However, to fully confirm the weakness of the sellers, more blue or green bars need to appear on the chart.
Important levels to watch for XLM price recovery
Looking more closely at the chart, the price of XLM is still holding the lower trend line of the triangle, indicating that the $0.30 area is a strong support level. If the price maintains above this level, it is highly likely that XLM will move up to the $0.33 area, corresponding to a recovery of 7.8%.
If it surpasses the threshold of $0.33, XLM could continue to rise to levels of $0.35 and $0.39. Note that breaking above the triangle will be more favorable than breaking below, as the upper trend line only has two touch points and is not truly solid.
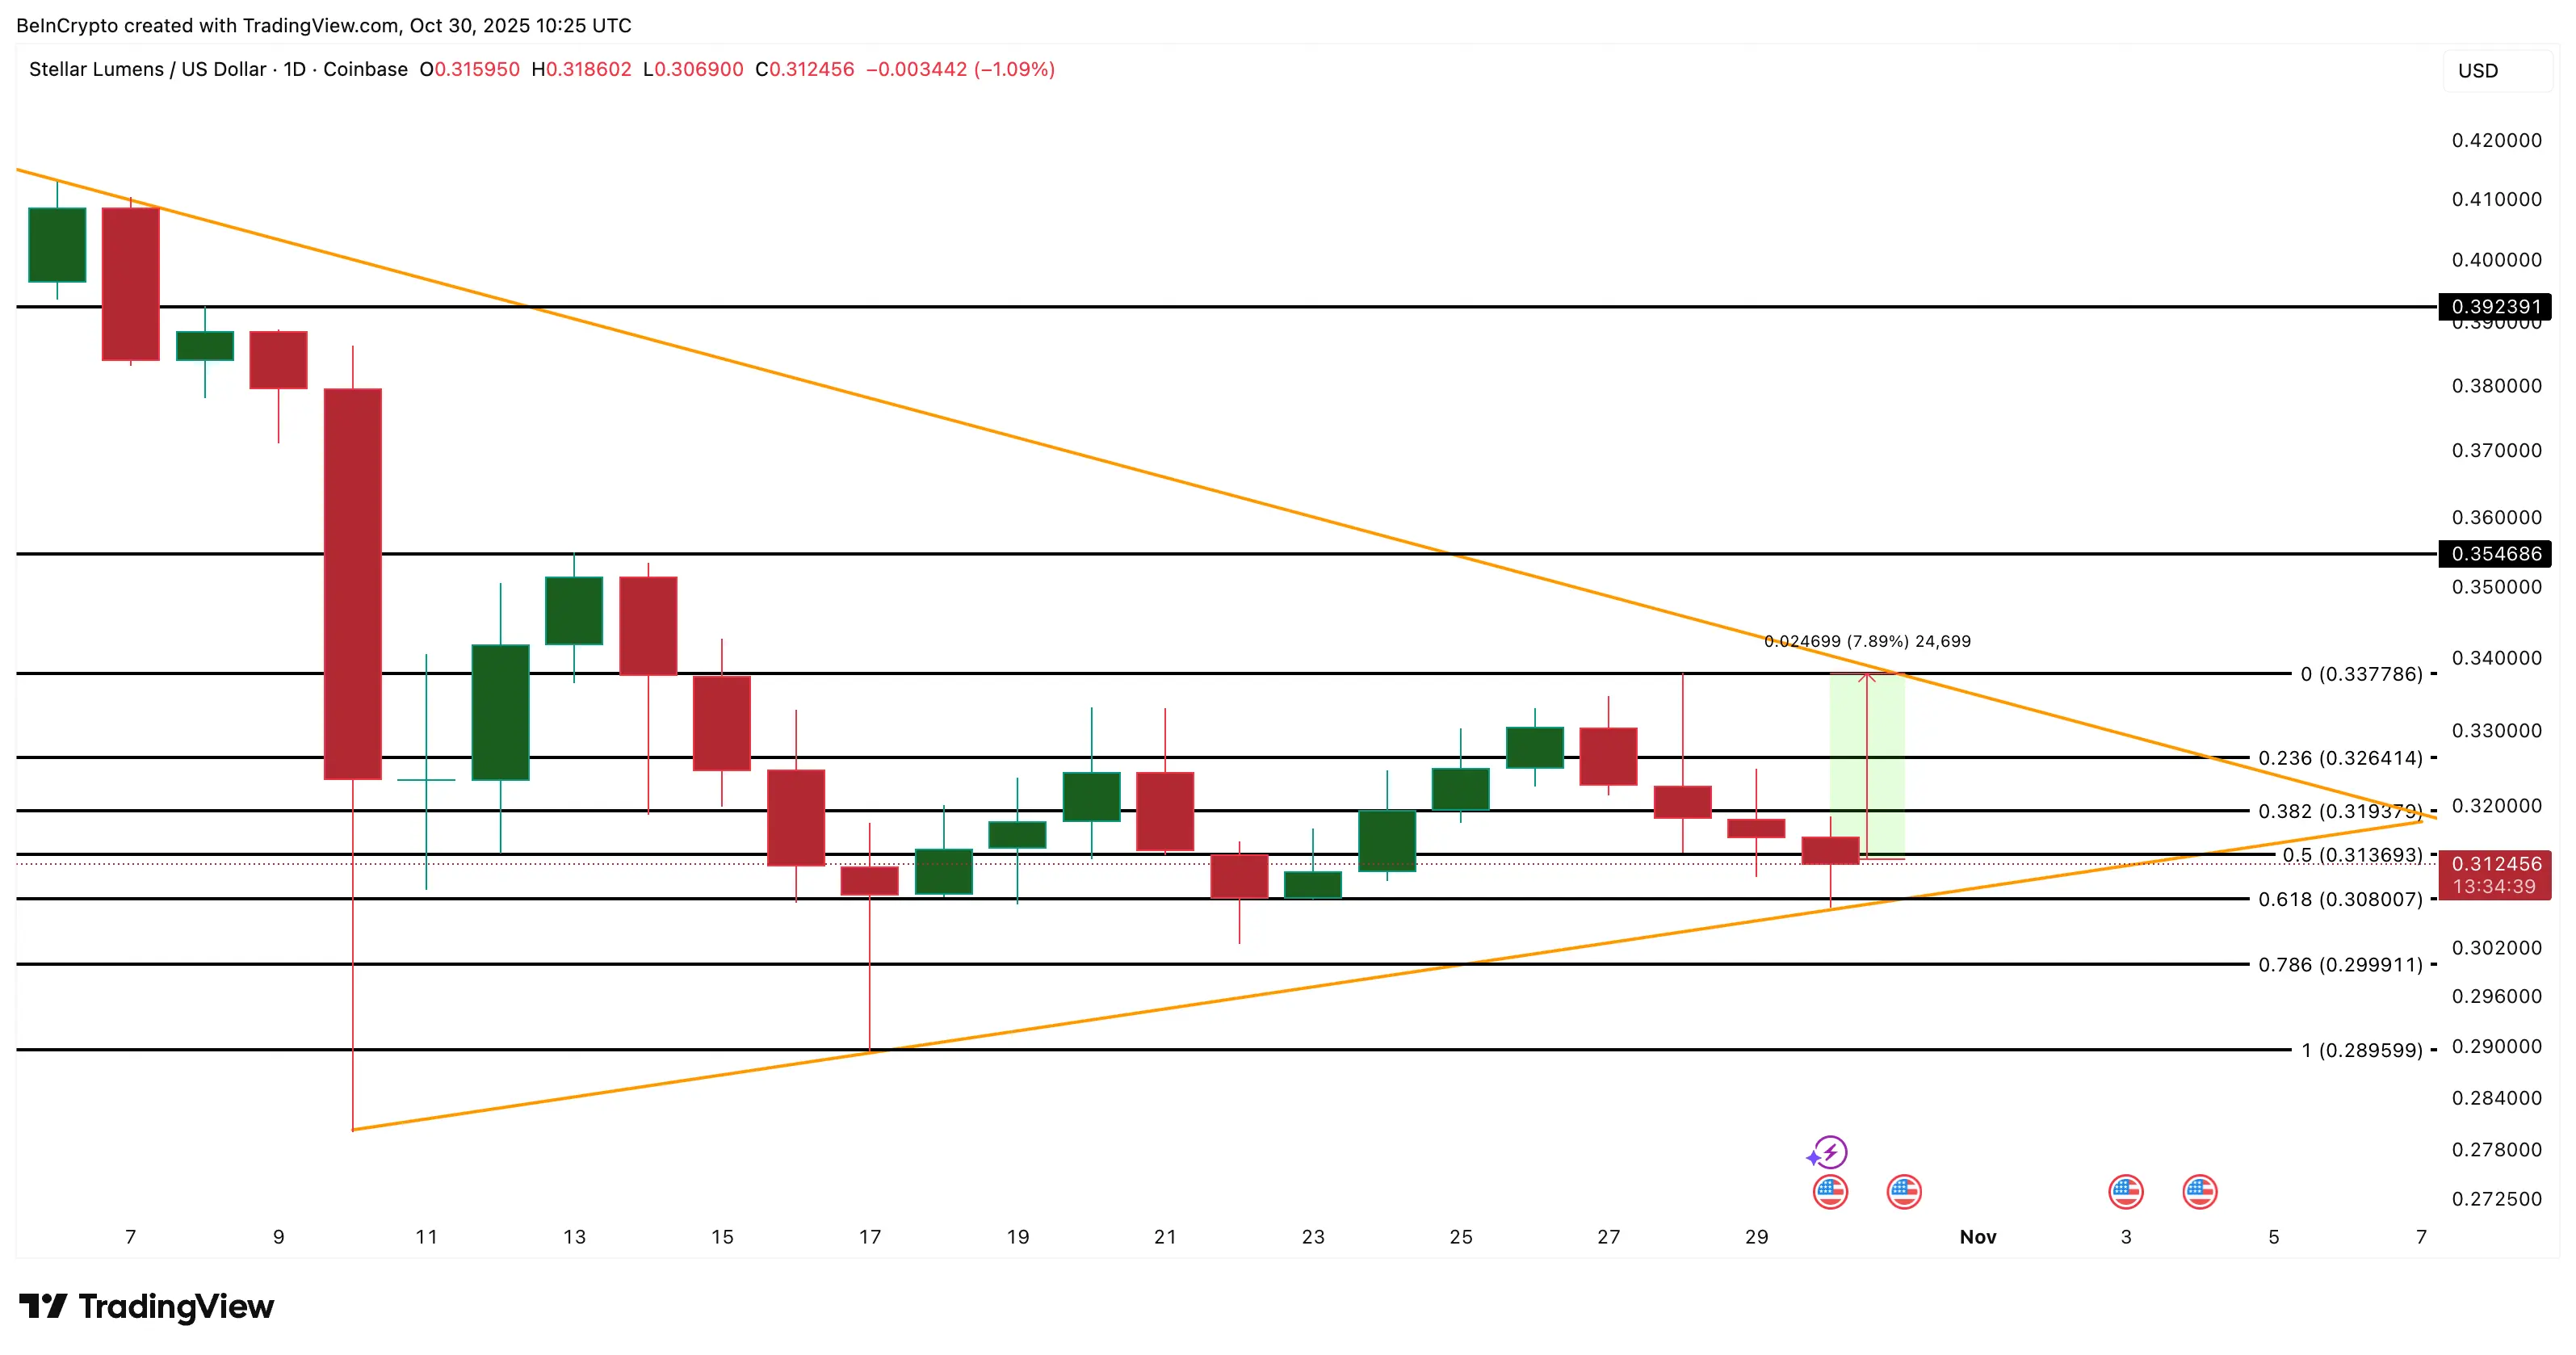 XLM Price Analysis | Source: TradingViewConversely, if XLM loses the support zone of $0.30, the next level to watch will be $0.28. Breaking the $0.30 mark will mean breaking the triangle structure, which may cause the price to continue to fall deeper.
Currently, the sell signal from Wyckoff is weakening, and the price base stabilizing around $0.30 creates a certain level of optimism. This indicates that buyers are gradually regaining control over the price trend of Stellar (XLM), provided that the overall market conditions are more positive.
Mr. Teacher
Disclaimer: The information on this page may come from third parties and does not represent the views or opinions of Gate. The content displayed on this page is for reference only and does not constitute any financial, investment, or legal advice. Gate does not guarantee the accuracy or completeness of the information and shall not be liable for any losses arising from the use of this information. Virtual asset investments carry high risks and are subject to significant price volatility. You may lose all of your invested principal. Please fully understand the relevant risks and make prudent decisions based on your own financial situation and risk tolerance. For details, please refer to
Disclaimer.

