Official Trump (TRUMP) records short term bounce back signals after a prolonged fall, but this upward momentum may not be as solid as hoped. It is currently trading cautiously, as the rise of Bitcoin along with investor indifference has significantly limited the potential for a breakout.
Current market trends indicate that the year-end bounce back may only be a stepping stone for a deeper adjustment in Q4.
Official Trump and the influence from Bitcoin along with the broader market
Currently, the correlation between Official Trump and Bitcoin is quite weak, at -0.44. This means that the price of TRUMP often moves in the opposite direction to Bitcoin. This inverse relationship can be a significant challenge, especially in the context that Bitcoin often rises sharply in Q4.
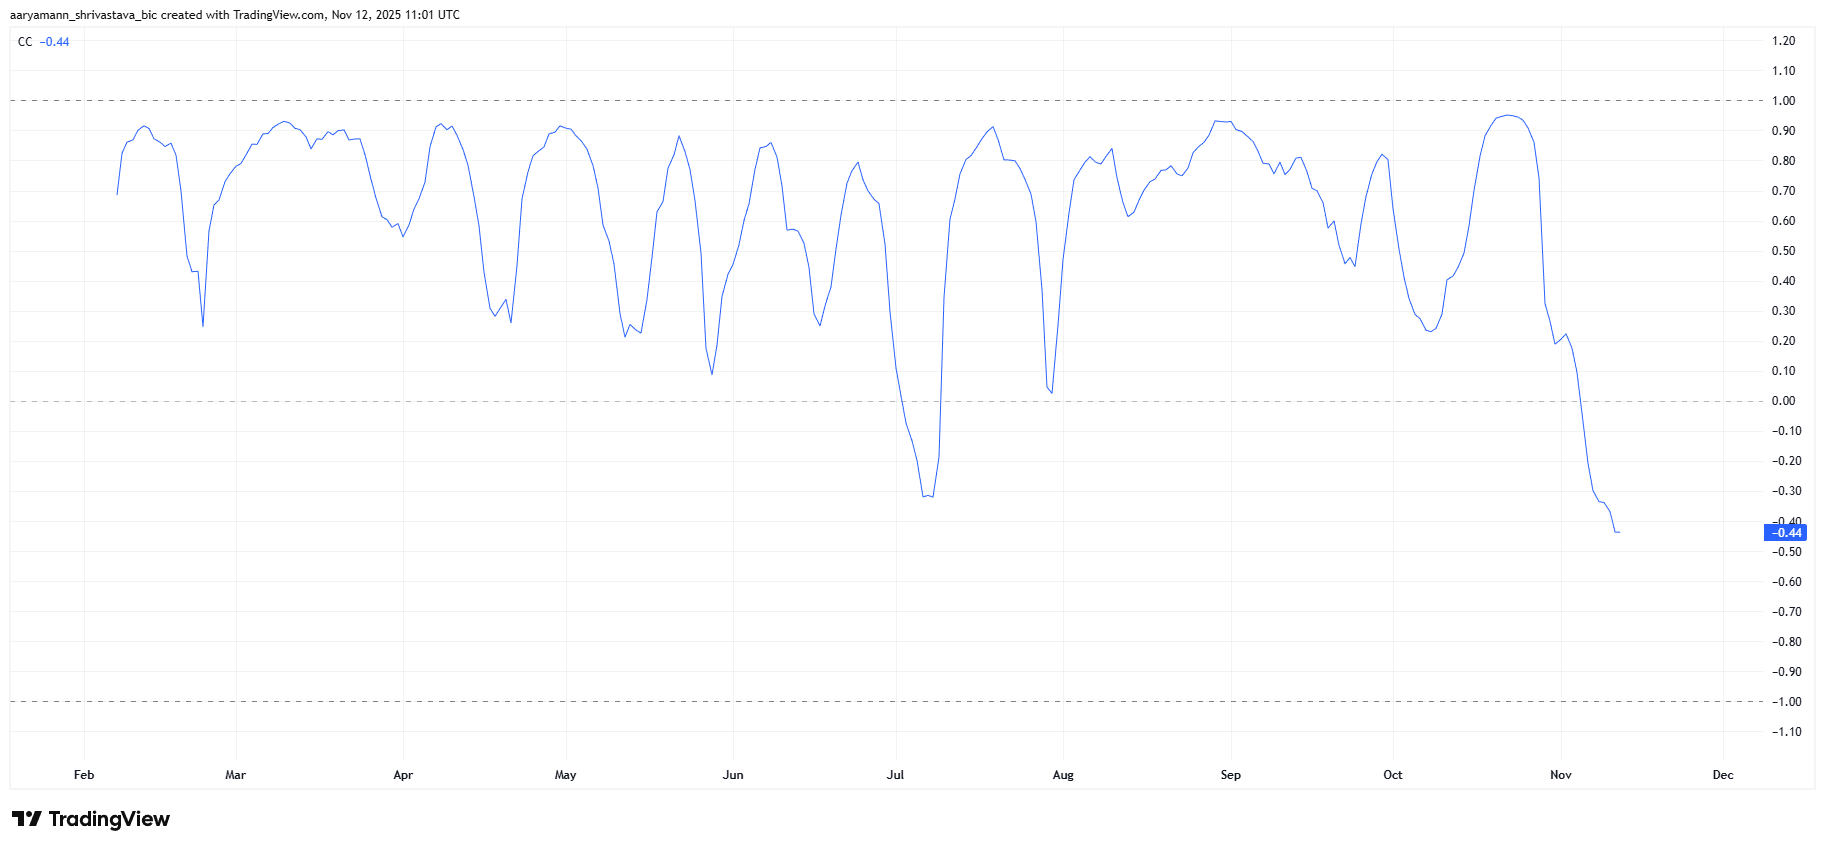 The correlation between TRUMP and Bitcoin | Source: TradingViewIf Bitcoin maintains an upward trend in the last months of 2025, TRUMP may face selling pressure. This separation has previously helped TRUMP avoid deep falls of Bitcoin, but now it makes it vulnerable when the overall market rises while it does not keep up.
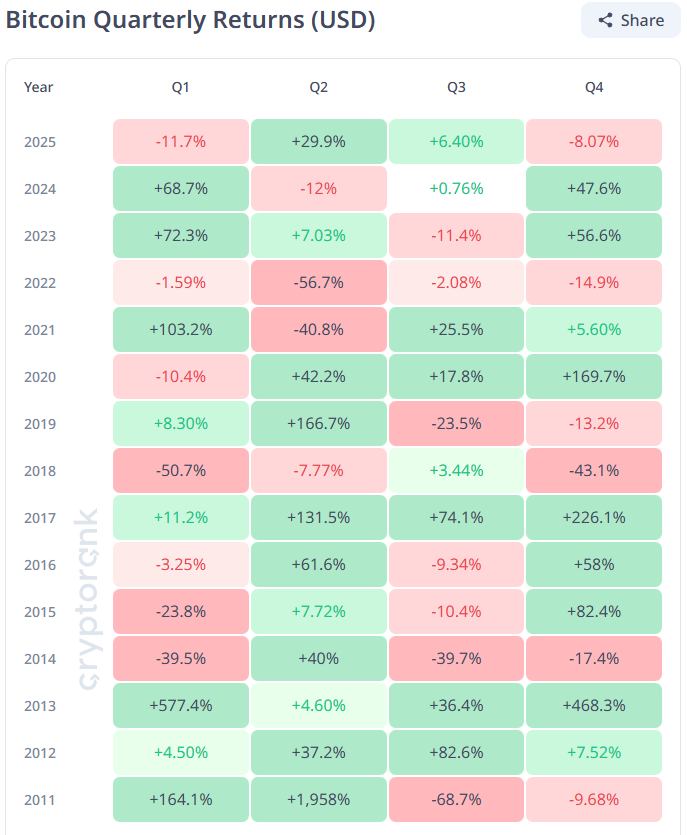 Quarterly Bitcoin performance | Source: CryptoRank## Outlook for TRUMP
The funding rate ( is reflecting a less optimistic macro outlook for TRUMP. Short positions dominate longer than buy contracts, indicating that skepticism is spreading among investors. This imbalance signals that investor confidence is waning and lacks clear direction – two key factors for the recovery process.
![OFFICIAL TRUMP )TRUMP( faces selling pressure despite signs of short term bounce back])https://img-cdn.gateio.im/webp-social/moments-85c72fa0c4d3779cd05bb755b614ce58.webp(Funding rate of TRUMP | Source: CoinglassIf there is no new commitment from long-term investors, any recovery efforts will lack sustainability. The lack of positive funding momentum indicates market caution and the risk of subsequent liquidations could increase downward volatility in the near future.
Opportunity for a reversal from TRUMP investors
Despite the weak macro outlook, the Chaikin Money Flow )CMF( indicator brings a glimmer of hope. Currently, this index is fluctuating near the -10.0 level, and history shows that this is often an accumulation zone, signaling the potential for a short term bounce back for TRUMP. At this level, buying pressure typically emerges before the market continues deeper corrections.
![OFFICIAL TRUMP )TRUMP( faces price fall pressure despite short-term bounce back signs])https://img-cdn.gateio.im/webp-social/moments-f7c191a4930656bb027d00b877e50979.webp(TRUMP's CMF index | Source: TradingViewWith a rising wedge pattern forming on the chart, TRUMP may record a short-term increase before facing new selling pressure. Although this pattern implies a brief bounce back, the overall bearish structure still prevails as the year 2025 gradually comes to an end.
Risk of price fall of TRUMP
Official Trump has been trading in a rising wedge pattern for the past two and a half weeks, hovering around the $7.86 mark. This chart pattern often warns of a bearish trend, indicating the possibility of a deeper correction.
If TRUMP is affected by negative factors, whether from investors or the reasons mentioned, the price may break the current support level. Weak buying power may prolong the downtrend, pushing the price down to the support area of $6.24, equivalent to a 19% fall.
![OFFICIAL TRUMP )TRUMP( faces pressure to fall despite short term bounce back signs])https://img-cdn.gateio.im/webp-social/moments-a68e9768c96e99c2c13341a71556192b.webp(TRUMP price analysis | Source: TradingViewConversely, if the CMF model proves effective, TRUMP could bounce up from the lower trend line, surpassing the $8.36 mark and testing the $9.00 resistance area. Although this move would negate the short term bearish outlook, the overall downward trend has not yet been reversed.
Mr. Giáo
Disclaimer: The information on this page may come from third parties and does not represent the views or opinions of Gate. The content displayed on this page is for reference only and does not constitute any financial, investment, or legal advice. Gate does not guarantee the accuracy or completeness of the information and shall not be liable for any losses arising from the use of this information. Virtual asset investments carry high risks and are subject to significant price volatility. You may lose all of your invested principal. Please fully understand the relevant risks and make prudent decisions based on your own financial situation and risk tolerance. For details, please refer to
Disclaimer.
Related Articles
BTC surged to $74,000 before falling back below $69,000, with the total market capitalization evaporating approximately $110 billion.
This week, the cryptocurrency industry received positive news from Wall Street, but Bitcoin's price fell from $74,000 to $69,000, with a market cap evaporating approximately $110 billion. The strength of the US dollar and macroeconomic factors are putting pressure on risk assets. Short-term holders are taking profits, increasing selling pressure, but the US spot Bitcoin ETF recorded net inflows, indicating an improvement in the funding environment.
GateNews6m ago
Today, the cryptocurrency Fear & Greed Index dropped to 12, indicating the market is in extreme fear.
Gate News Report, March 7th, according to Alternative.me data, today the cryptocurrency fear and greed index dropped to 12, indicating the market is in a state of "extreme fear." Yesterday, the index was 18, also in the "extreme fear" zone.
GateNews21m ago
Kaspa Tops CoinMarketCap Community Sentiment With 90% Bullish Votes – Here’s Why
Kaspa’s price hasn’t had the best year. The coin is currently trading around $0.03, and on the yearly chart it’s still down roughly 60%. That kind of drop usually hurts sentiment in most crypto
CaptainAltcoin1h ago
Will XRP Hold $1.33 or Extend Toward $1.30 Before Rebound?
XRP is currently trading at $1.35, experiencing a 1.3% decline. Key support is at $1.34, while resistance is at $1.40. The price is testing around the Fibonacci levels of $1.33 and $1.30, crucial for potential upward movement or deeper decline.
CryptoNewsLand5h ago
Dogecoin Monthly Breakdown Pattern Reappears as Price Tests $0.0918
Dogecoin is currently trading at $0.09205 at a gain of 2.3, with support of above $0.08878.
As can be seen in the monthly chart, there are recurring breakdown areas that have been followed by significant expansions in price.
The short-term trading range is narrow and the immediate point o
CryptoNewsLand5h ago
Solana Nears $95 Resistance With $17B Volume Surge
Solana approaches a key resistance level near $95, with increased trading volume and open interest signaling active trader interest. The token is currently at $90.20, facing potential upward movement if it surpasses $95, but may test $85 if rejected.
CryptoFrontNews5h ago