The price of Cardano (ADA) continues to be in the red, fluctuating around the 0.52 USD level in Friday's trading session, after losing more than 10% since the beginning of the week. The bearish pressure is increasingly heavy as the funding rate of ADA turns negative, while the Total Value Locked (TVL) also weakens significantly. In terms of technical analysis, the current indicators continue to lean towards a deeper correction scenario, with the bears' target aimed at the zone below 0.50 USD.
The derivative and on-chain data of Cardano shows a bearish trend
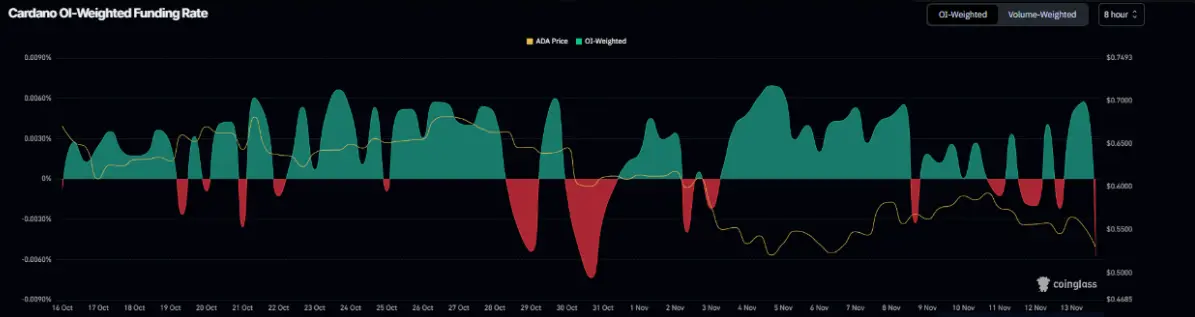
Data from the derivatives market continues to reinforce the view that the bearish trend is dominating Cardano. Coinglass's funding rate indicates that the momentum is clearly leaning towards traders betting on the scenario of ADA continuing to fall, while the bullish side appears to be at a disadvantage.
Notably, this index has fallen into negative territory and recorded a level of -0.057% on Friday, equivalent to a sharp decline at the end of October. A negative funding rate means that shorts have to pay fees to longs — a signal reflecting the increasingly pessimistic sentiment surrounding ADA.
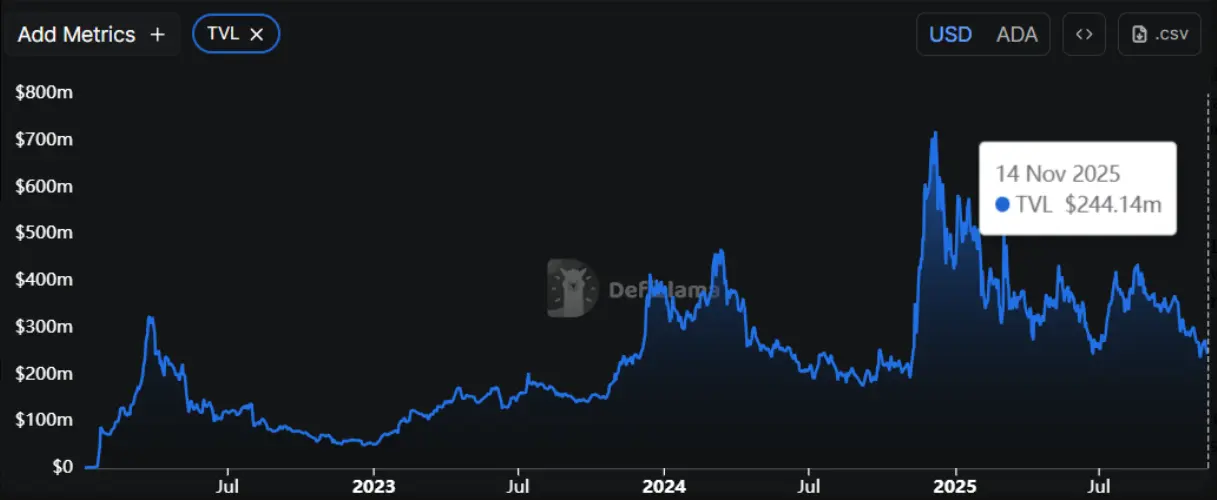
 Funding rate of ADA | Source: CoinglassThe picture gets even gloomier as data from DefiLlama shows that the TVL of Cardano has fallen to $244.14 million on Friday, extending a steady decline since mid-August. The weakening TVL indicates stagnant network activity, declining user interaction, and a shrinking amount of assets being deposited or utilized in protocols built on ADA — all of which are unfavorable signals for the price outlook of this coin.
 TVL of Cardano | Source: DefiLlama ## Cardano price forecast: ADA faces the risk of falling below 0.50 USD
The price of Cardano was strongly rejected at the 50% Fibonacci retracement level at 0.61 USD on Tuesday and has fallen over 10% as of Thursday. As of the time of writing on Friday, ADA is trading around 0.52 USD.
If the adjustment pressure continues to extend, ADA risks falling back to the important support zone around 0.49 USD on the daily chart.
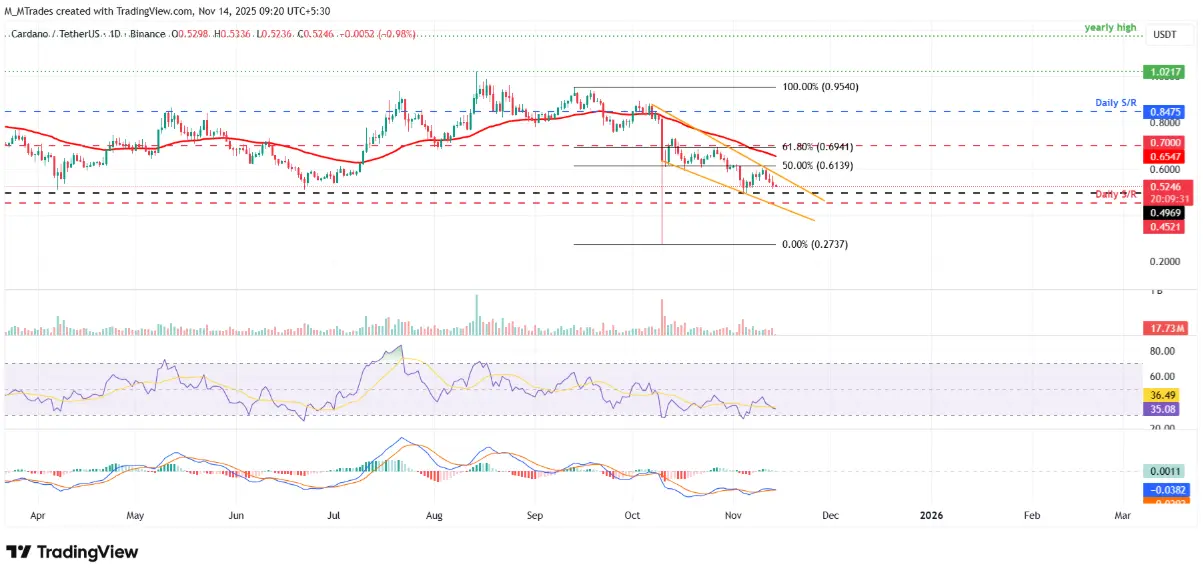 Daily ADA/USDT Chart | Source: TradingViewThe RSI indicator is currently at 35, below the neutral threshold of 50, indicating that bearish momentum is prevailing. At the same time, the MACD lines are narrowing the gap, with the green histograms weakening just above the neutral zone — a warning signal for a potential bearish crossover in the near future.
On the contrary, if buying pressure appears and ADA recovers, this coin may head back to the key resistance zone at 0.61 USD.
SN_Nour
Disclaimer: The information on this page may come from third parties and does not represent the views or opinions of Gate. The content displayed on this page is for reference only and does not constitute any financial, investment, or legal advice. Gate does not guarantee the accuracy or completeness of the information and shall not be liable for any losses arising from the use of this information. Virtual asset investments carry high risks and are subject to significant price volatility. You may lose all of your invested principal. Please fully understand the relevant risks and make prudent decisions based on your own financial situation and risk tolerance. For details, please refer to
Disclaimer.
Related Articles
Here’s HBAR Price if Hedera’s AI Integration With Claude Drives Enterprise Adoption
Hedera (HBAR) latest developments suggest steady institutional interest beneath a consolidating price. The network has continued to attract capital and enterprise partners even as the broader crypto market remains volatile.
ETF inflows are one sign of that trend. On 4 March 2026, Canary’s
CaptainAltcoin10m ago
"Smart money" goes against the panic: Why did Chainlink become a safe haven in the March market?
Chainlink experiences a capital outflow in the crypto market, with active development activity indicating potential resilience and long-term value. Although current market sentiment is fragile, LINK needs to break through the $9.17 resistance level to confirm an upward trend. Overall, investors should stay attentive and wait for market stabilization or positive signals from LINK itself before making decisions.
PANews31m ago
Stellar (XLM) recovers, the bulls approach the breakout point of the trendline
Stellar (XLM) is trading around $0.155, showing a slight recovery, but trader sentiment remains cautious amid mixed on-chain and derivatives data. A successful breakout above the current downtrend could support short-term gains.
TapChiBitcoin42m ago
PI (Pi) increased by 7.62% over the past 24 hours
Gate News Report, March 11 — According to Gate Market Data, as of press time, PI (Pi) is trading at $0.23, up 7.62% in the past 24 hours, with a high of $0.24 and a low of $0.17. The current market capitalization is approximately $2.248 billion, an increase of $159 million from yesterday.
Pi Network is a blockchain community and developer platform dedicated to enabling users to mine Pi tokens easily on their phones through innovative technology. Centered around its groundbreaking technology, the network allows mining via mobile apps without consuming大量电力, making it the first digital currency that can be mined on a mobile device. Pi Network emphasizes decentralization, mobile-first design, and environmental friendliness, aiming to involve more users in the cryptocurrency ecosystem.
##
GateNews55m ago
TRUMP Meme Coin Plummets 96% from Peak, Trump Polls Worsen, Accelerating Collapse
TRUMP Token recently dropped to $2.87, with a total decline of over 96%, hitting a record low. Its decline is related to the sharp drop in President Trump's approval ratings, indicating that waning political enthusiasm has a significant impact on token valuation. The market is sensitive to geopolitical volatility, and with WLFI tokens also under pressure, it demonstrates the high-risk nature of political-themed meme coins.
MarketWhisper57m ago