Fartcoin (FARTCOIN) is regaining its upward momentum, adding 12% during Thursday's session and approaching the upper resistance zone of the descending channel pattern on the daily chart. Data from both the derivatives market and on-chain indicate that the comeback of this meme coin is being supported by large investors – the “whales” that dominate the cash flow. Technically, Fartcoin is assessed to be in a state ready for a breakout, as initial signals indicate that bullish momentum is gradually returning.
Whales increase their buying position in Fartcoin
Retail investor interest in Fartcoin is rising again, coinciding with a short-term recovery and reinforcing expectations that the upward trend of this meme coin could be sustained. According to data from CoinGlass, open contract (OI) for FARTCOIN futures surged 30% to $220.69 million in just the past 24 hours — a sign that a large volume of new Long positions is being opened by traders expecting prices to continue rising.
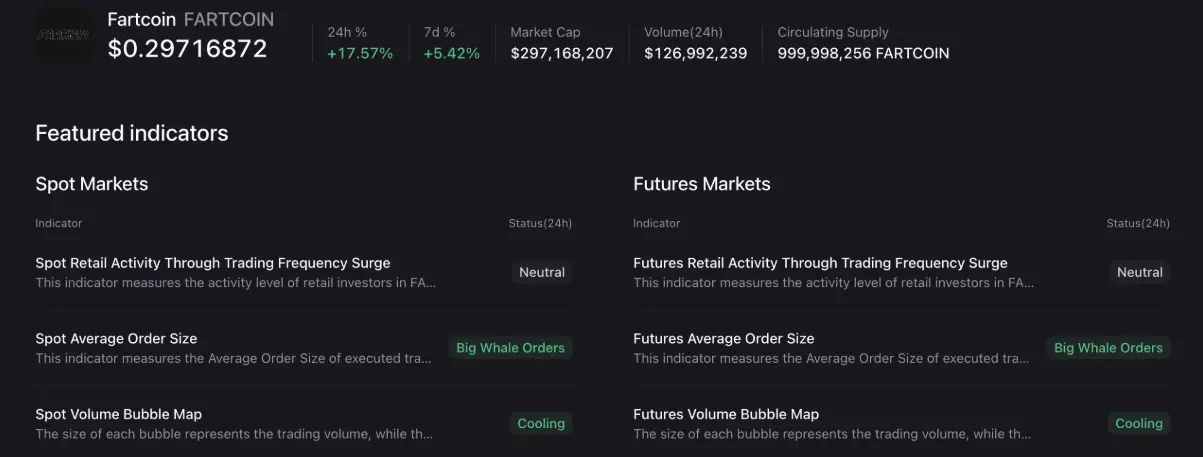
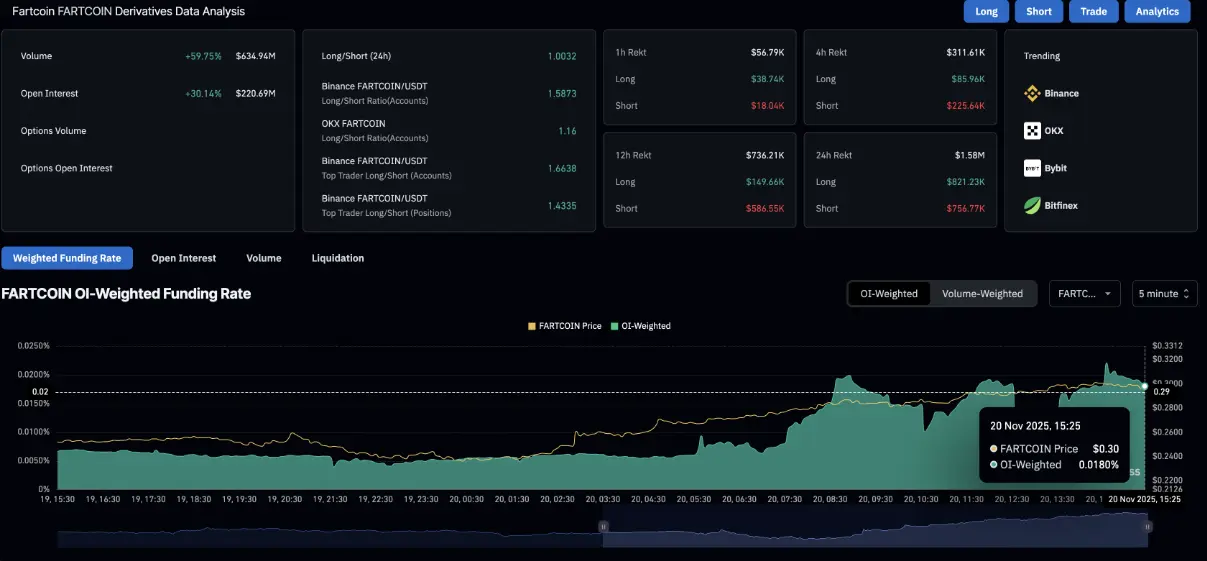 Fartcoin derivative data | Source: CoinGlassData from CryptoQuant shows that the main driving force behind the strong increase in OI comes from “whales”, as evidenced by the superior average order size. Not only in the derivatives market, large wallets are also actively accumulating in the spot market, signaling high confidence levels among experienced investors.
 Fartcoin Derivative Index | Source: CryptoQuantData from Santiment indicates that the wallet group holding between 10 million and 1 billion tokens has increased its ownership ratio to 47.70% of the total on-chain supply, up from 45.87% recorded on Sunday. As large wallets continue to expand their positions, FARTCOIN may face a stronger breakout opportunity, amid a tightening supply and a markedly improved market sentiment — with “smart money” betting heavily on the growth prospects of this meme coin.
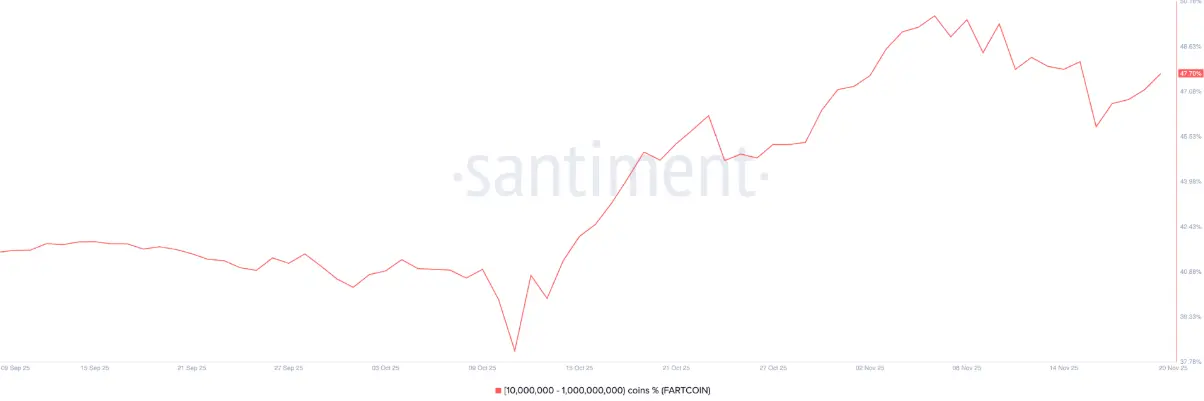 FARTCOIN supply distribution | Source: Santiment## Fartcoin strengthens the ability to break through
The recovery of Fartcoin is nearing the important resistance zone of the descending channel pattern on the daily timeframe, around the psychological level of 0.30 USD. If this meme coin built on Solana closes a daily candle above this threshold, the breakout signal will be confirmed, opening up the opportunity for a new uptrend to form.
In a breakout scenario, FARTCOIN could target the 50-day EMA that is sloping down at 0.39 USD, before challenging the 50% Fibonacci retracement level at 0.54 USD — measured from the peak of 1.69 USD on July 22 to the bottom of 0.17 USD on October 10.
 FARTCOIN/USDT daily chart | Source: TradingViewTechnical signals are also supporting the possibility of acceleration. The RSI at 48 is gradually moving up to neutral levels, reflecting weakening selling pressure. The MACD line and the signal line of the MACD indicator have formed a bullish crossover, indicating that buying momentum is returning.
Additionally, the ROC has risen above the 0 line and reached a level of 3.54, confirming a positive shift in trend momentum. The ROC's maintenance above the positive zone often indicates that buying pressure is strengthening.
However, risks still exist. If FARTCOIN loses its current momentum, the price could fall back inside the down zone, leading to the risk of revisiting the bottom of 0.22 USD established on Friday.
SN_Nour
Disclaimer: The information on this page may come from third parties and does not represent the views or opinions of Gate. The content displayed on this page is for reference only and does not constitute any financial, investment, or legal advice. Gate does not guarantee the accuracy or completeness of the information and shall not be liable for any losses arising from the use of this information. Virtual asset investments carry high risks and are subject to significant price volatility. You may lose all of your invested principal. Please fully understand the relevant risks and make prudent decisions based on your own financial situation and risk tolerance. For details, please refer to
Disclaimer.
Related Articles
Will XRP Hold $1.33 or Extend Toward $1.30 Before Rebound?
XRP is currently trading at $1.35, experiencing a 1.3% decline. Key support is at $1.34, while resistance is at $1.40. The price is testing around the Fibonacci levels of $1.33 and $1.30, crucial for potential upward movement or deeper decline.
CryptoNewsLand53m ago
Dogecoin Monthly Breakdown Pattern Reappears as Price Tests $0.0918
Dogecoin is currently trading at $0.09205 at a gain of 2.3, with support of above $0.08878.
As can be seen in the monthly chart, there are recurring breakdown areas that have been followed by significant expansions in price.
The short-term trading range is narrow and the immediate point o
CryptoNewsLand56m ago
Solana Nears $95 Resistance With $17B Volume Surge
Solana approaches a key resistance level near $95, with increased trading volume and open interest signaling active trader interest. The token is currently at $90.20, facing potential upward movement if it surpasses $95, but may test $85 if rejected.
CryptoFrontNews1h ago
Bitcoin Slips to $68,000 as Middle East Conflict and US Jobs Data Trigger Sell-Off
Bitcoin surrendered its $70,000 support level, triggering a broader crypto market retreat that wiped out $329 million in leveraged positions. This downturn was fueled by a perfect storm of geopolitical and macroeconomic pressures.
Wiping out the ‘War Gains’
Bitcoin’s midweek resilience
Coinpedia1h ago
PEPE Hovers at Critical $0.053414 Support as $432M Volume Surge Tightens Breakout Watch
PEPE is trading at $0.053416, just above support at $0.053414, with significant trading volume up 22.14%. Resistance is at $0.053676. Despite a slight decrease in price, there’s increased market activity, suggesting potential volatility.
CryptoNewsLand1h ago
DXY Retest at 99.183: Will 100–101 Break as US Degen Index Stabilizes?
DXY trades at 99.183 while retesting the 100–101 monthly resistance zone.
US Degen Index 6900 sits at $0.0001197 with support at $0.0001175 and resistance at $0.0001214.
A break above 101 on DXY would shift structure higher, while rejection keeps price below key resistance.
The U.
CryptoNewsLand1h ago