Meme coins continue to sink under heavy selling pressure at the time of writing on Friday, as Dogecoin (DOGE), Shiba Inu (SHIB), and Pepe (PEPE) extend their correction streak, losing nearly 8% over the past week. Weakness signals from momentum indicators suggest market sentiment is becoming fragile, raising concerns about the potential for a deeper correction in the near future.
Dogecoin Closes Below Key Support Zone
Dogecoin’s price was rejected at the key resistance area of $0.181 on 11/11, leading to a drop of over 17% in the following 10 days and breaking the daily support zone at $0.149. As of Friday’s writing, DOGE is hovering around $0.146.
If selling pressure persists, DOGE could extend its correction and retreat to the low set on 4/7 at $0.129.
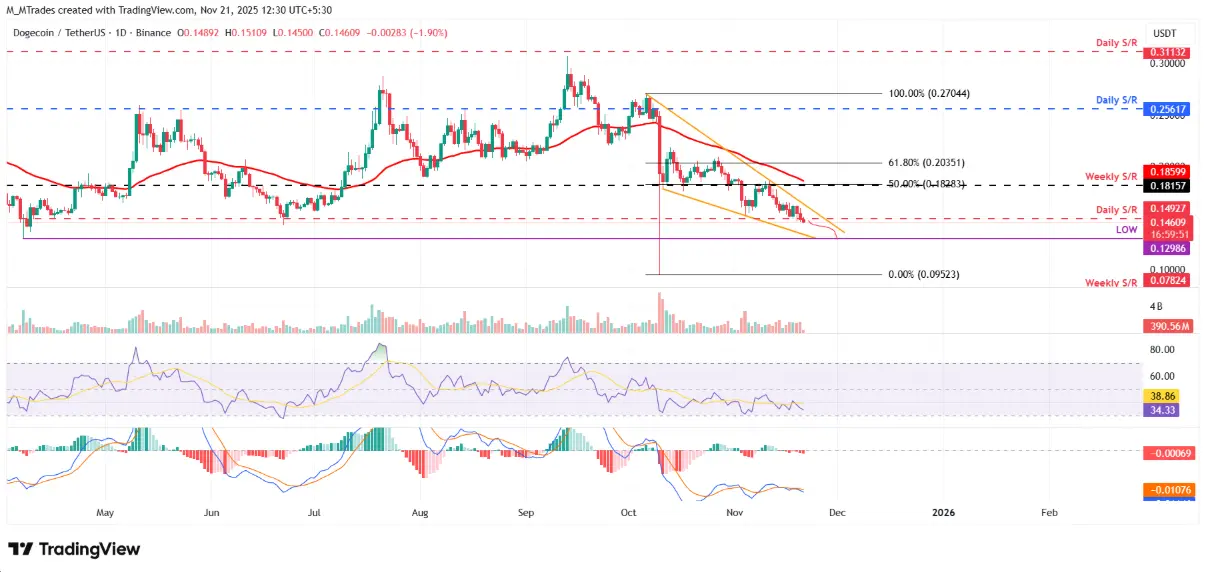 BiDOGE/USDT daily chart | Source: TradingView On the daily timeframe, the RSI indicator is at 34—significantly lower than the neutral 50—indicating that bearish momentum is dominant. Additionally, the MACD formed a bearish crossover last week and continues to hold, reinforcing the downtrend signal.
Conversely, in a recovery scenario, DOGE could retest the weekly resistance zone at $0.181.
Shiba Inu Price Shows Bearish Signals via Momentum Indicators
Shiba Inu’s price was rejected at the 50% Fib retracement level around $0.0000099 on 11/13, before dropping nearly 13% as of Thursday. By the time of writing on Friday, SHIB is trading around $0.0000081.
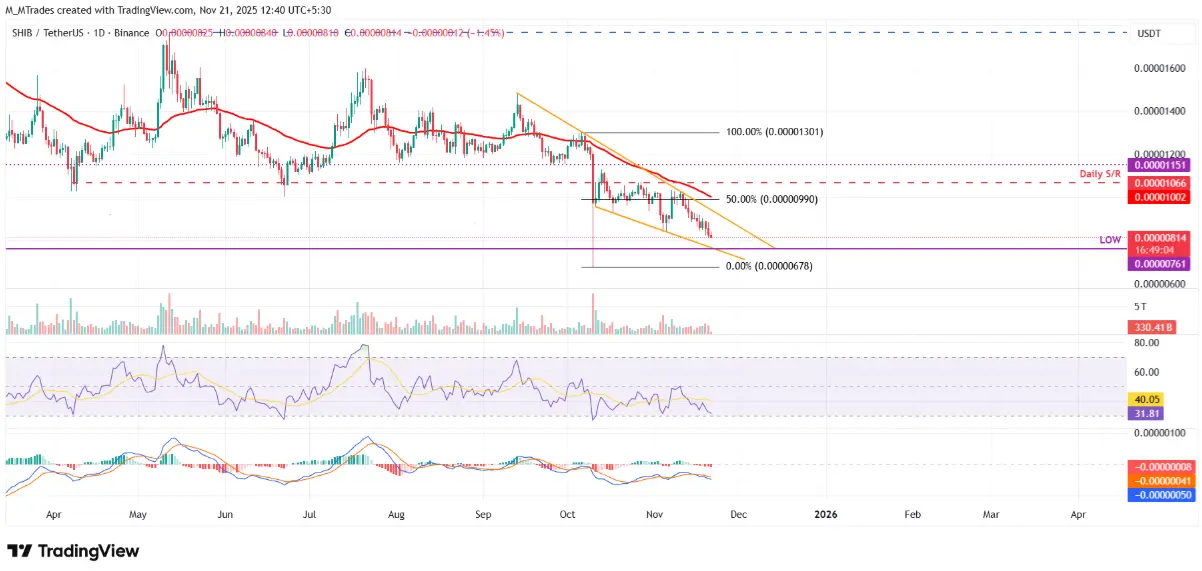 BiSHIB/USDT daily chart | Source: TradingView If the downtrend continues, SHIB could slip to the low set on 11/21/2023 at $0.0000076. Similar to Dogecoin, technical indicators such as RSI and MACD are both pointing toward a bearish trend.
Conversely, if the bulls regain control, SHIB could recover and move up to retest the key resistance area at $0.0000099.
Pepe May Extend Deep Correction If It Closes Below Lower Trendline
Pepe’s price was rejected at the upper trendline on 11/11, leading to a decline of over 31% in the next 10 days. As of Friday’s writing, PEPE is still hovering near the lower trendline, indicating that selling pressure remains high.
If PEPE closes below the lower trendline around $0.0000041 on the daily chart, the downtrend could continue, sending the price back to the 10/10 low at $0.0000027.
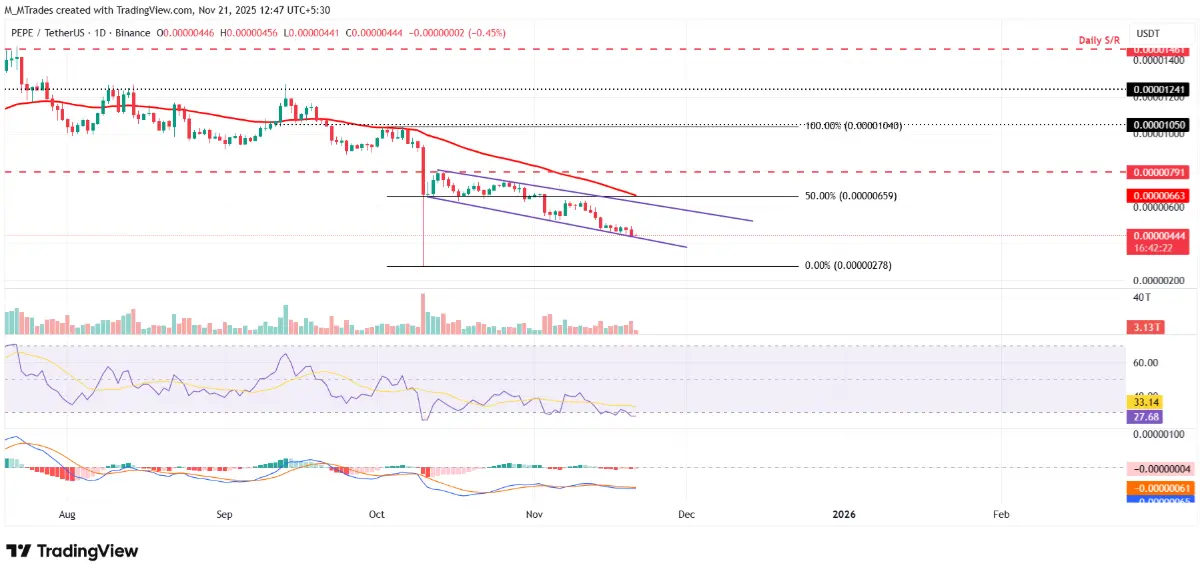 BiPEPE/USDT daily chart | Source: TradingView Similar to Dogecoin and Shiba Inu, Pepe’s technical indicators such as RSI and MACD are showing weakness, reinforcing the bearish outlook.
On the other hand, if the bulls regain control, PEPE could recover and target the next resistance zone at $0.0000065.
SN_Nour
Disclaimer: The information on this page may come from third parties and does not represent the views or opinions of Gate. The content displayed on this page is for reference only and does not constitute any financial, investment, or legal advice. Gate does not guarantee the accuracy or completeness of the information and shall not be liable for any losses arising from the use of this information. Virtual asset investments carry high risks and are subject to significant price volatility. You may lose all of your invested principal. Please fully understand the relevant risks and make prudent decisions based on your own financial situation and risk tolerance. For details, please refer to
Disclaimer.
Related Articles
Dogecoin Monthly Breakdown Pattern Reappears as Price Tests $0.0918
Dogecoin is currently trading at $0.09205 at a gain of 2.3, with support of above $0.08878.
As can be seen in the monthly chart, there are recurring breakdown areas that have been followed by significant expansions in price.
The short-term trading range is narrow and the immediate point o
CryptoNewsLand4h ago
Dogecoin Jumps 6% to $0.095 — Triangle Breakout Puts $0.1038 Resistance in Focus
Dogecoin is trading at $0.095599 with a daily profit of 6.0% and its level of support and resistance is at $0.09001 and $0.1038 respectively.
The third retest of the historical bottom channel of Dogecoin occurs in the monthly chart, which has already rebounded around $0.0002 and around the
CryptoNewsLand4h ago
Dogecoin Prints Monthly Morning Doji Star — Will $0.097 Break Next?
Dogecoin is forming a "Morning Doji Star" pattern on the monthly chart around $0.09, indicating a potential bullish reversal despite a recent 1.9% daily decline. Key support is at $0.09036 and resistance at $0.09707, with current trading at $0.09010.
CryptoNewsLand6h ago
Grok AI Predicts the Price of XRP, Cardano and Dogecoin if NATO Enters the War
Rising geopolitical tension in the Middle East has started to influence financial markets far beyond the region. The conflict between the U.S.–Israel coalition and Iran has already triggered uncertainty across commodities, equities, and crypto markets.
A new debate has emerged around what
CaptainAltcoin8h ago