HBAR is trading around $0.134, down nearly 8% today, underperforming the overall cryptocurrency market, which has dropped about 6%. The overall picture remains bleak, as HBAR’s price has lost nearly half its value over the past three months.
Currently, this coin is sitting at a crucial support level that we have recently emphasized. If this level is breached, the downtrend is likely to continue. Conversely, if it holds, the next move could surprise traders who are overwhelmingly positioned in one direction.
Weakening trading strength after a fresh breakdown
The biggest concern right now stems from trading volume. The On Balance Volume (OBV) indicator clearly reflects the coin’s buying and selling trends: a rising OBV indicates strong demand, while a falling OBV signals increasing selling pressure.
Recently, HBAR broke below its descending OBV trendline, connecting lower short-term lows. This move confirms a new wave of weakness, while the longer-term picture looks even more gloomy.
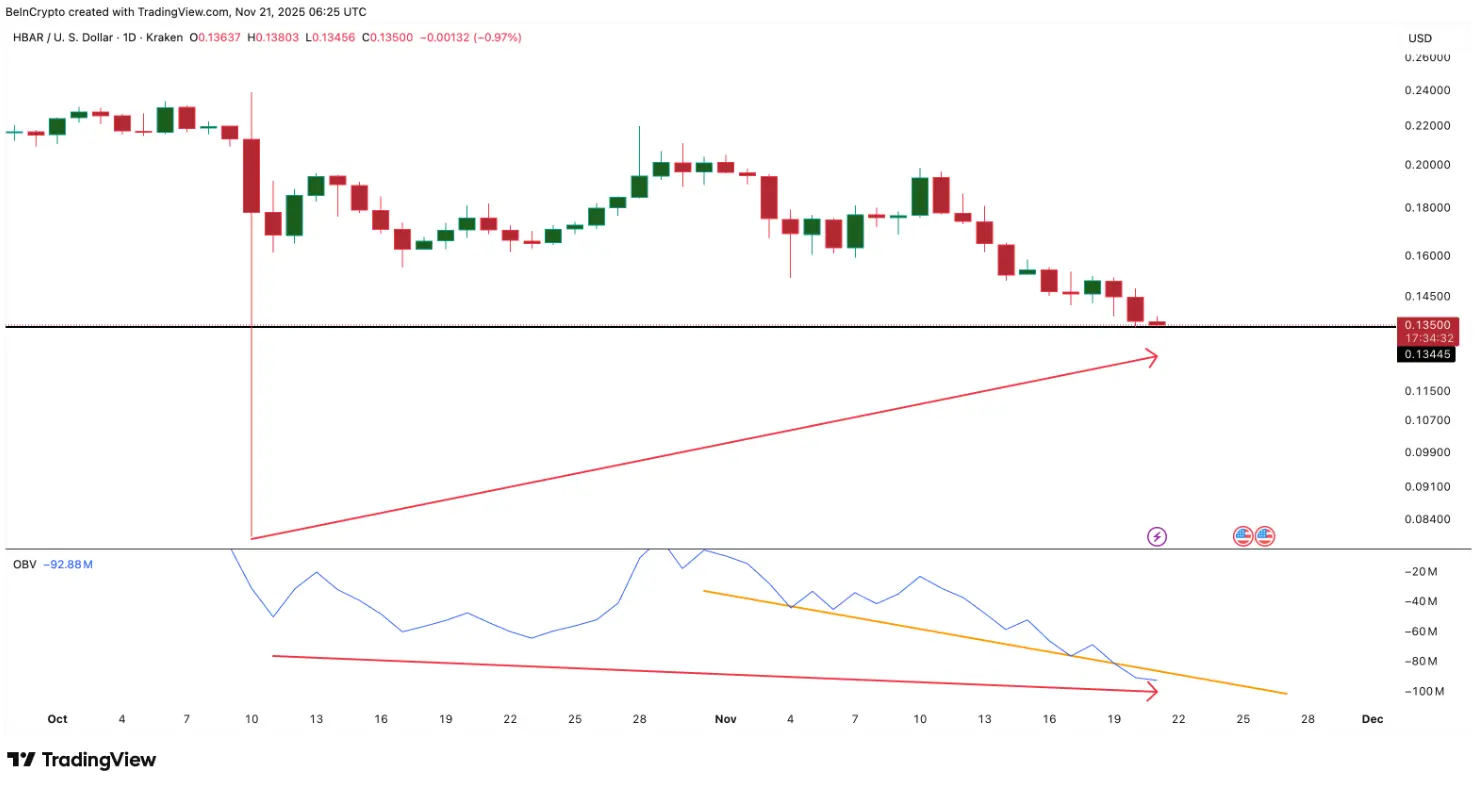 BiHBAR/USDT daily chart | Source: TradingViewFrom October 10 to November 21, HBAR’s price consistently formed higher lows, but OBV registered lower lows. When price rises while volume declines, this signals that the market’s real strength is weakening beneath the surface.
Until OBV recovers above the broken trendline, the market is unlikely to have enough volume for a sustainable recovery. Even if OBV breaks above this line, momentum remains weak, only temporarily reducing the risk of a collapse without confirming a new uptrend.
Overwhelming short pressure signals further weakness
Derivatives products are issuing a second warning. The 30-day liquidation map recorded about $15.32 million in short positions, while only $2.66 million in long positions. This means shorts outnumber longs by 475%—a clear imbalance, reflecting an important reality: the market currently does not expect HBAR to bounce back.
The liquidation map also highlights points where leveraged traders could be forced to close positions if HBAR’s price moves to certain levels.
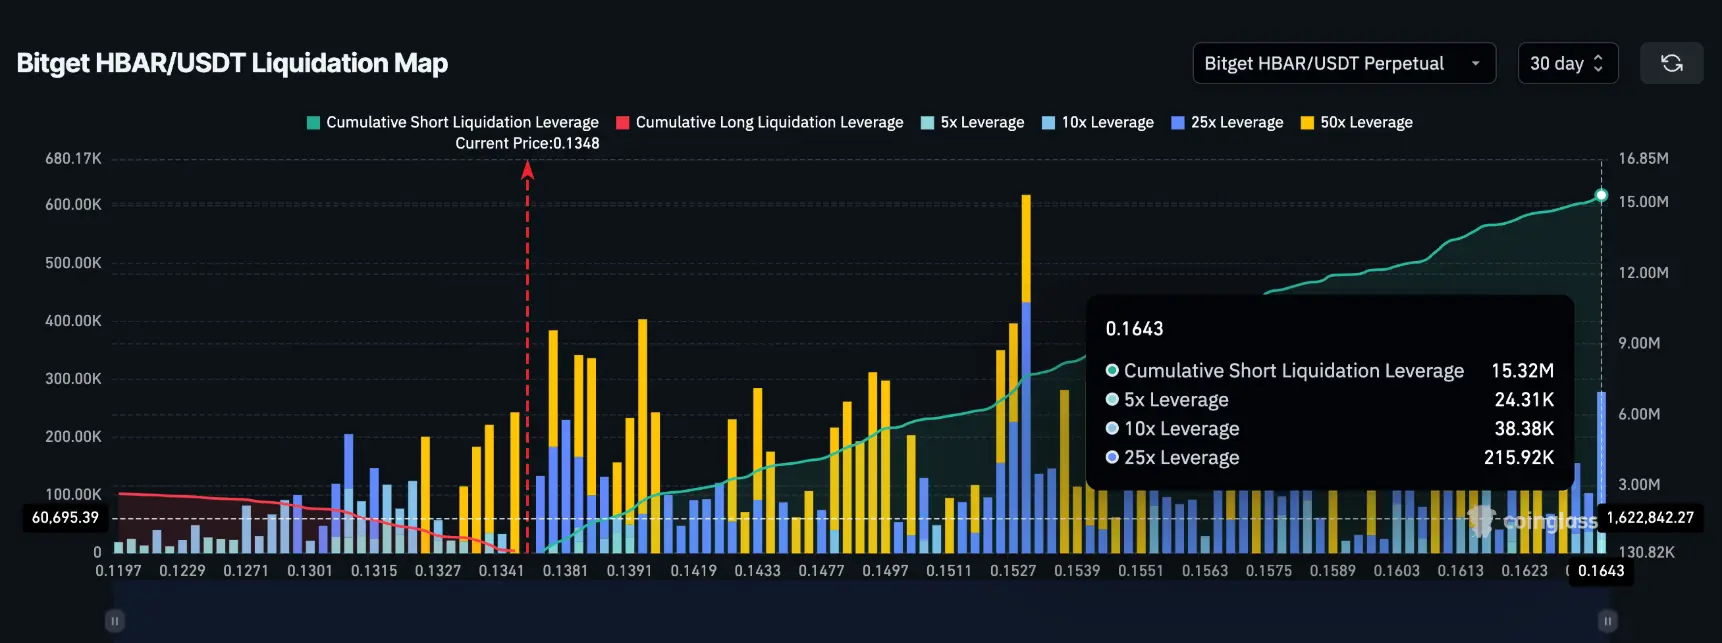 NguSource: CoinglassThis imbalance creates two notable effects:
In summary, even though the derivatives market is skewed bearish, the current setup still leaves a small window for HBAR to stage a surprise breakout.
HBAR price shows a clear crossroads
HBAR is trading around $0.134, right at the support zone we previously warned about. If this area does not hold, the next drop could test $0.129. Losing this level would pave the way down to $0.087, reflecting an overall downtrend as sellers remain in control.
Conversely, the first resistance lies at $0.144. A daily candle close above this level would show buyers gradually absorbing the sell pressure, presenting a chance to reverse the trend and weaken the current bearish scenario.
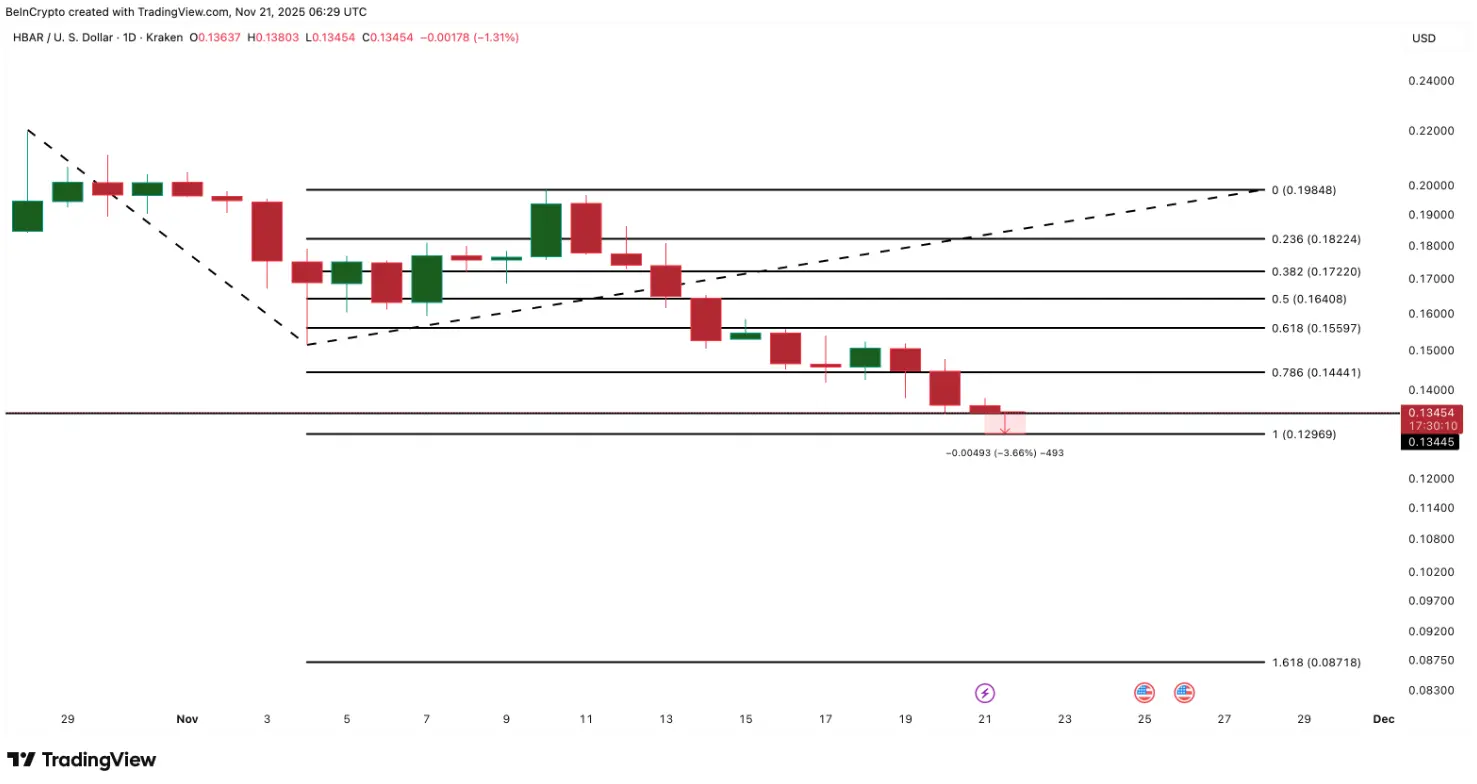 BiHBAR/USDT daily chart | Source: TradingViewIf the rally continues, the next barrier is identified around $0.164. However, conquering this level requires two key factors: increasing trading volume as indicated by OBV, and reduced short pressure in the derivatives market. Lacking either, breakout attempts are likely to fail. Additionally, breaking above $0.164 would trigger the liquidation of all short positions, as the earlier liquidation map showed.
SN_Nour
Disclaimer: The information on this page may come from third parties and does not represent the views or opinions of Gate. The content displayed on this page is for reference only and does not constitute any financial, investment, or legal advice. Gate does not guarantee the accuracy or completeness of the information and shall not be liable for any losses arising from the use of this information. Virtual asset investments carry high risks and are subject to significant price volatility. You may lose all of your invested principal. Please fully understand the relevant risks and make prudent decisions based on your own financial situation and risk tolerance. For details, please refer to
Disclaimer.
Related Articles
1.7 Billion Cardano in 24 Hours, ADA Bulls React to Market Sentiment Shift - U.Today
Cardano (ADA) has seen significant trading activity recently, with a drop in price from $0.2682 to $0.2590 amid rising selling pressure and global tensions. Increased selling and market sentiment could challenge ADA's stability, but recent adoption efforts may support recovery if trading volumes rise.
UToday1h ago
Geopolitical Turmoil! Dalio Declares "Gold is the Only True God," but Its Safe-Haven Performance Trails Bitcoin
As geopolitical tensions in the Middle East escalate, Bridgewater founder Ray Dalio questions Bitcoin and reaffirms gold as the preferred safe haven. Nevertheless, gold prices fell accordingly, while Bitcoin only experienced a slight correction, indicating that the correlation between the two is weakening. Dalio doubts Bitcoin's transparency and future risks, but he still maintains a small allocation of Bitcoin for diversification.
区块客2h ago
Interest in altcoins cools down: Can Ethereum trigger a new altcoin season?
The market is forcing investors to bring risk management back to the center.
From a technical perspective, the inflow of funds over the past week has driven
TapChiBitcoin2h ago
Aster Price Nears $0.79 Breakout as Reversal Pattern Strengthens
Key Insights
Aster price structure shows an inverse head and shoulders pattern forming beneath $0.79 resistance, signaling growing buying pressure and possible trend reversal ahead.
Repeated tests of the $0.79 neckline suggest weakening selling pressure as buyers steadily absorb supply
CryptoFrontNews4h ago
The HYPE price could surge despite the upcoming $2.8 million short squeeze.
The recent price movements of Hyperliquid (HYPE) are characterized by stagnation around 30 USD. A symmetrical triangle pattern indicates potential for a breakout in either direction, but market sentiment is cautious. Short squeeze risks may boost prices, while weak market flow and deteriorating demand pose challenges. The token could face significant support levels if it dips below 30 USD. An improved market sentiment could lead to a breakout above 33 USD, sparking recovery momentum.
TapChiBitcoin5h ago
Ethereum Price Holds Key Support: Is $2,200 the Next Test for ETH?
March 6, 2026 7:15 pm EST
TheCoinRepublic7h ago