Solana is facing increasing downward pressure as its relentless decline is pushing the token closer to a critical support area — a price level that hasn’t been touched in more than seven months.
The prolonged weakening trend reflects widespread pessimism in the market, while technical indicators continue to warn of deeper losses if the current situation doesn’t show signs of reversal soon.
Solana investors are suffering heavy losses
Solana’s exponential moving averages ((EMA)) are signaling a warning about the potential formation of a death cross. This phenomenon occurs when the short-term EMA crosses below the long-term EMA, typically signaling the beginning of a strong and prolonged downtrend.
Solana’s price history shows that the coin may be repeating cycles that occurred in Q1 and Q2 of this year. During those periods, SOL dropped as much as 59% from its local peak before the death cross pattern officially appeared. If a similar scenario unfolds, Solana could fall to the $98 range, extending the current decline to 47% from the recent peak, reflecting weakening market sentiment and a still-high risk of further downside.
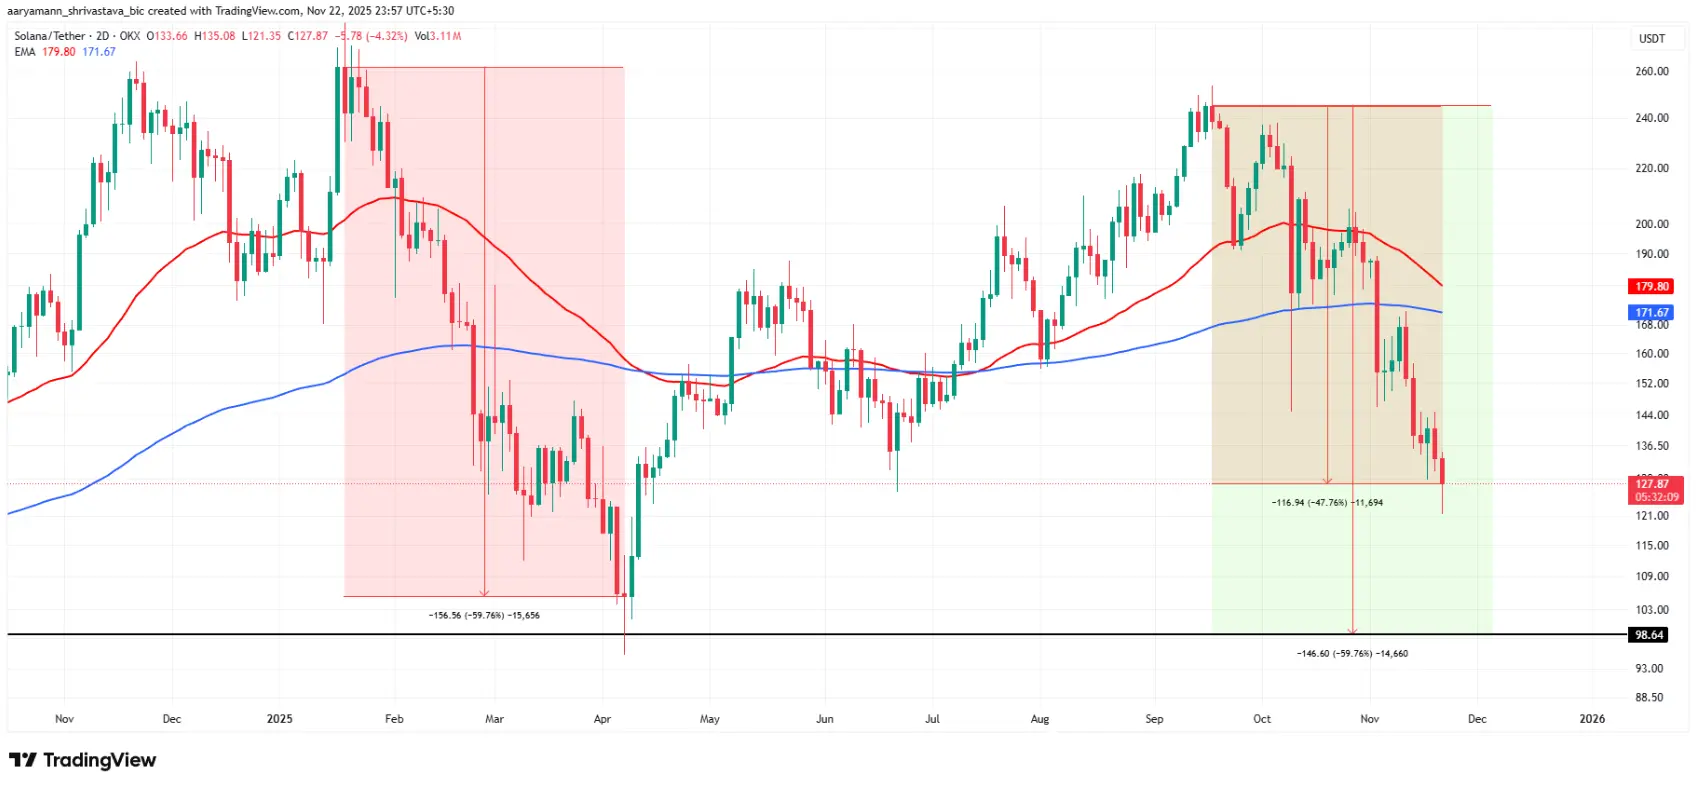 BiSOL/USDT 2-day chart | Source: TradingView
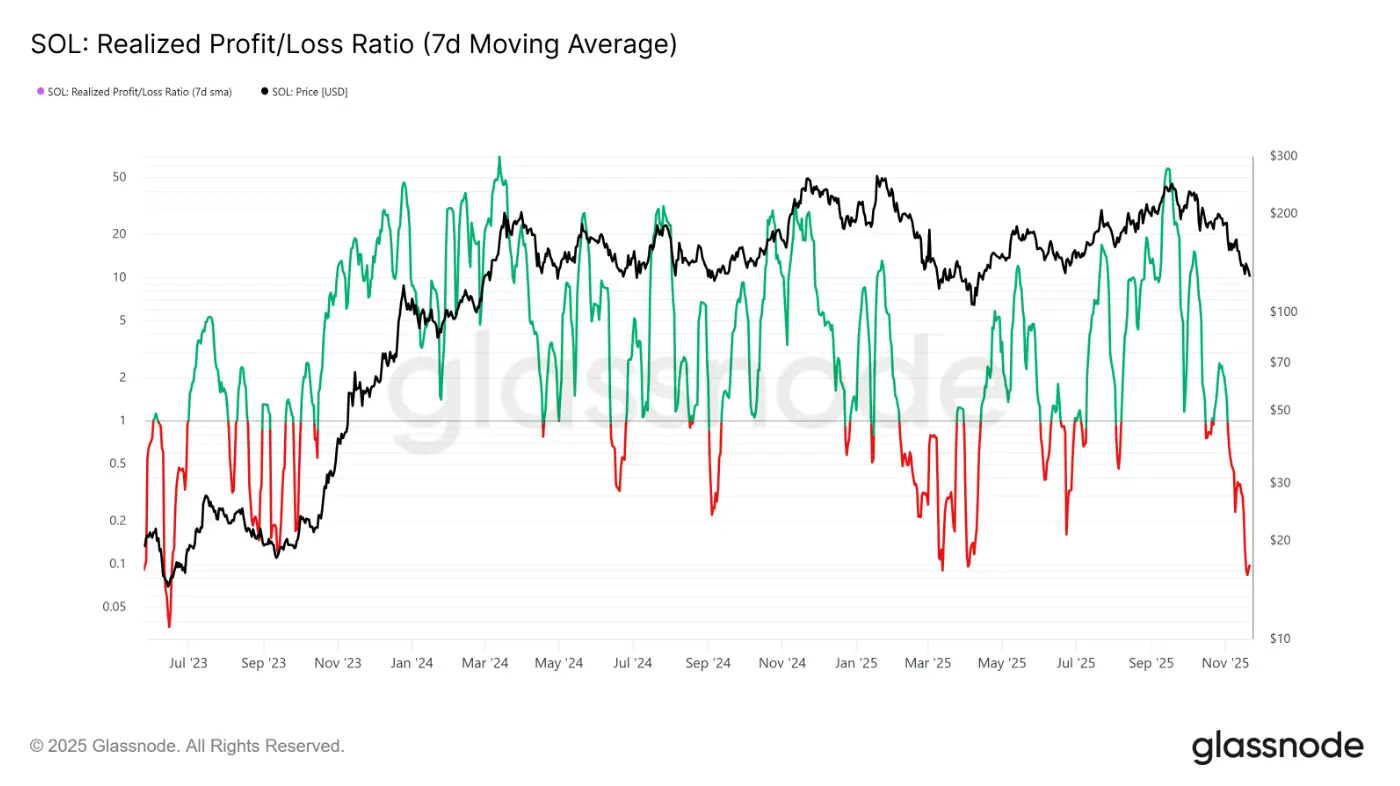
The macro picture is also not very bright. Solana’s net realized profit/loss ratio has fallen to its lowest level since June 2023, indicating that investors are taking significant actual losses after the recent drop. This indicator often reflects broader shifts in sentiment, as investors reassess risks during rapid market downturns.
However, there is still a glimmer of hope. History shows that when the net realized profit/loss ratio drops below 0.1, strong reversals often follow. This occurred in March, April, and September 2023, each time signaling the start of an impressive recovery. If this scenario repeats, Solana could see a sharp rebound as actual losses reach a saturation point and selling pressure eases.
SOL price remains vulnerable
SOL is currently trading around $127, holding above the key $123 support level. This altcoin is in a waiting phase for overall market stability and the return of investor confidence to kick off a recovery phase.
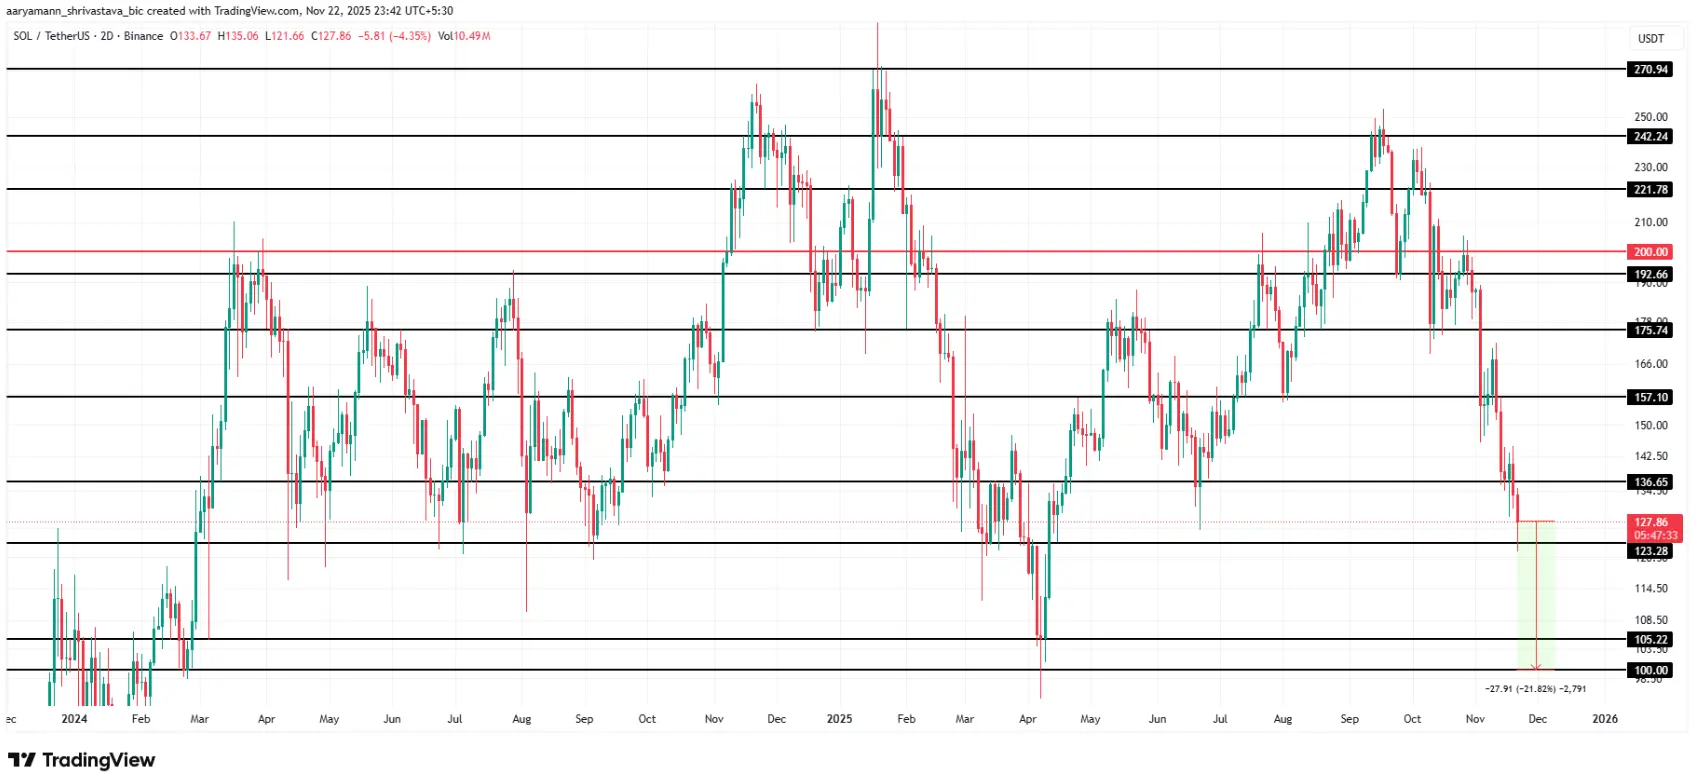 BiSOL/USDT 2-day chart | Source: TradingView
However, technical indicators still warn that the risk is tilted to the downside. If Solana moves closer to forming a death cross, the price could continue to plunge, break below $123, and fall toward the $105 region, or even possibly hit $100. This correction would represent a drop of about 21.8% from current levels, returning the price to areas last seen in March.
Conversely, if selling pressure eases and investor sentiment improves, Solana could bounce from $123 and aim to challenge the $136 region. Breaking this level would open the way to $157, invalidating the bearish scenario and restoring the coin’s growth structure.
SN_Nour
Disclaimer: The information on this page may come from third parties and does not represent the views or opinions of Gate. The content displayed on this page is for reference only and does not constitute any financial, investment, or legal advice. Gate does not guarantee the accuracy or completeness of the information and shall not be liable for any losses arising from the use of this information. Virtual asset investments carry high risks and are subject to significant price volatility. You may lose all of your invested principal. Please fully understand the relevant risks and make prudent decisions based on your own financial situation and risk tolerance. For details, please refer to
Disclaimer.
Related Articles
Solana surpasses Ethereum in the number of RWA asset holders
Gate News Announcement, March 9 — On-chain analysis data shows that the Solana blockchain has surpassed Ethereum in the number of wallets holding tokenized real-world assets (RWA). Currently, Solana leads in the number of wallets holding RWA. Although Solana is ahead in the number of holders, Ethereum still maintains a dominant position in the total value of tokenized assets deployed on-chain. Most major tokenized government bond products and private credit platforms are still based on the Ethereum ecosystem.
GateNews1h ago
Solana partners with Alibaba Shanghai Hongqiao Alibaba Center to establish Solana Shanghai Builder Station, officially opening on March 20.
Solana and Alibaba Shanghai Hongqiao Center collaborate to establish the "Solana Shanghai Builder Station," which will officially open on March 20th. The initiative aims to provide a platform for blockchain developers to communicate and incubate, promote technological co-creation and industry connection, with support from the Shanghai government.
GateNews1h ago
Solana price drops below $85, approaching a critical support level. Will SOL fall to $72? The $80 support becomes the battleground between bulls and bears.
Solana (SOL) has recently continued to weaken, breaking through the $85 and $82 support levels, with market sentiment cautious. Traders are watching the key support level at $80; if it breaks, the price could continue to decline to $72. Technical indicators show a bearish trend, but there is still hope for a short-term rebound, which requires breaking through the $85.50 resistance to improve the market condition.
GateNews2h ago
Solana stablecoin settlement surpasses $650 billion: Funds flow out of Ethereum, on-chain USD payment landscape is changing
Stablecoins have seen a significant increase in blockchain settlement volume, with the Solana network performing outstandingly, reaching $650 billion in transfers by 2026. Their applications have expanded to cross-chain settlements, DeFi collateral, and other areas, with market attention on stablecoins becoming increasingly focused on their role as an important payment layer. User engagement has increased, and stablecoins are transforming into the foundational infrastructure for blockchain payments.
GateNews2h ago
Tokenized gold trading explodes: XAUT's weekly trading volume on Solana surpasses $280 million, reigniting interest in the RWA sector
The blockchain real-world asset market is heating up, with tokenized gold Tether Gold (XAUT) experiencing a significant increase in trading volume on the Solana network, with weekly trading exceeding $280 million. As institutional investors participate more, the market demand for tokenized assets is rapidly expanding, indicating that the RWA market may continue to grow in the future.
GateNews2h ago
Last week, SOL spot ETF had a net inflow of $24.05 million, while XRP spot ETF experienced a net outflow of $4.0855 million.
According to Gate News, on March 9th, last week, SOL spot ETF had a net inflow of $24.05 million, mainly contributed by Bitwise ETF BSOL with $33.94 million; XRP spot ETF experienced a net outflow of $4.0855 million. The total assets under management reached $807 million.
GateNews4h ago