The price of PEPE has not yet shown signs of recovery this year. In the last three months, the price has fallen by more than 55% and nearly 75% compared to the same period last year, indicating a prolonged downward trend. The slight increase after November 21 only brought temporary improvement, but it is unlikely to be sustained for long.
Technical charts continue to show that the selling force is dominating, while buyers need to make an effort to push prices above important resistance levels for the market to have a positive shift.
The Recovery of PEPE Coin: Is it Strong Enough?
PEPE has increased from around $0.00000389 to $0.00000457, which has eased some investors' short-term worries. However, upon closer inspection of the chart, this increase is still not truly convincing.
The RSI indicator (Relative Strength Index) is a popular tool that helps evaluate the speed of increase/fall of a coin. When the RSI is below 30, this indicates that the price has fallen too quickly and a short-term recovery is normal – just as PEPE coin has recently experienced.
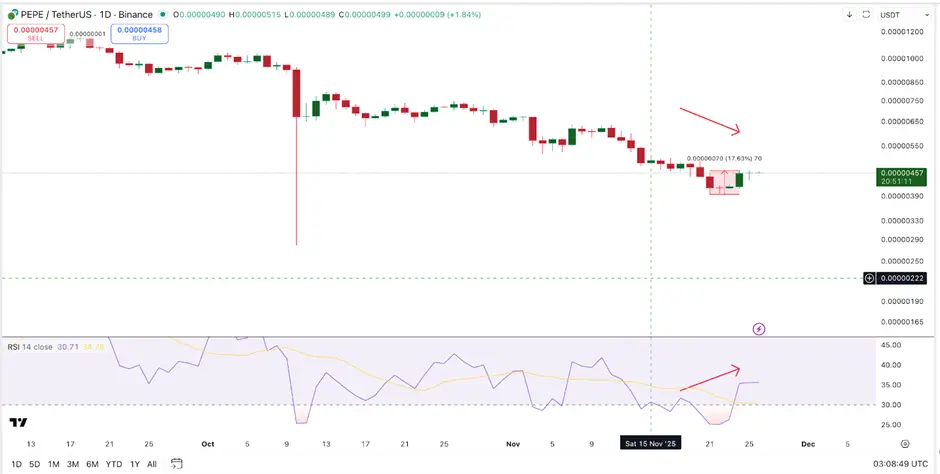 RSI divergence of Pepe Coin price | Source: TradingViewHowever, the RSI also sends a warning signal. Specifically, the RSI is making higher peaks, while the price of PEPE is forming lower lows at the same time. This indicates potential strength from the RSI, but the price does not reflect that.
This model is called “hidden bearish divergence,” which often predicts that the downtrend will continue. Many traders see this as a sign that buying pressure is emerging, but the coin is still weak. In other words, this small recovery is unlikely to last.
If this pattern continues, PEPE coin could fall to the $0.00000375 range – the next strong support level, where buyers may attempt to defend the price. Compared to the current price, this move would represent a decrease of about 18%. If PEPE breaks below the $0.00000375 mark, there is no clear support level below, and the risk of a deeper price drop is very high.
The price levels PEPE needs to surpass to reverse the trend
The price of PEPE needs to surpass the threshold of $0.00000466 for the chart to record any improvement, however small. This is a resistance zone that has repeatedly hindered the coin's upward momentum in the past. Only when PEPE exceeds $0.00000636 can the actual trend change. If the price remains below this level, selling pressure will continue to dominate the market.
The activities of the “whales” provide another perspective. Over the past 30 days, the top 100 wallets have increased their holdings of PEPE by about 3.92%, and the larger whales have accumulated an additional approximately 12.97%. This indicates that large investors are quietly gathering assets.
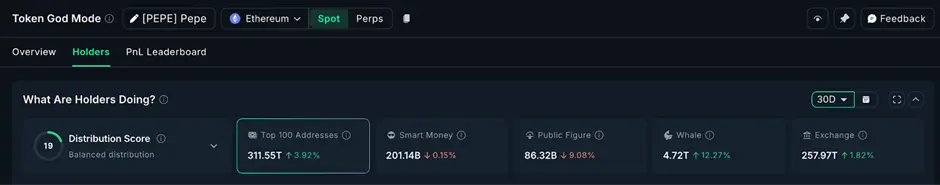 Whales buy PEPE | Source: NansenHowever, this does not mean that the price will rise immediately. Whales often buy when the market is weak, then wait several weeks or months before a significant movement occurs. In contrast, retail investors are transferring more PEPE coins to exchanges – a sign that they tend to sell.
This reflects the anxious mentality of the majority of small investors, while whales are actively accumulating. Typically, this is the time when whales buy from weak-handed investors, but it does not guarantee that prices will rise sharply immediately.
It should also be noted that smart money ( “smart money” ) is still selling off, albeit at a slow pace. This indicates that they do not yet expect a recovery of PEPE coin in the short term.
Conditions for PEPE to stop falling
The “bull-bear power” indicator is sending an early signal that selling pressure may be weakening. This indicator measures the difference between buying and selling strength in the market. The green bar indicates stronger buying power, while the red bar shows that selling power is dominant.
Since October 10, the red columns have gradually shrunk, reflecting that the selling pressure of the frog-themed meme coin is no longer as strong as before - a small positive signal for future prospects.
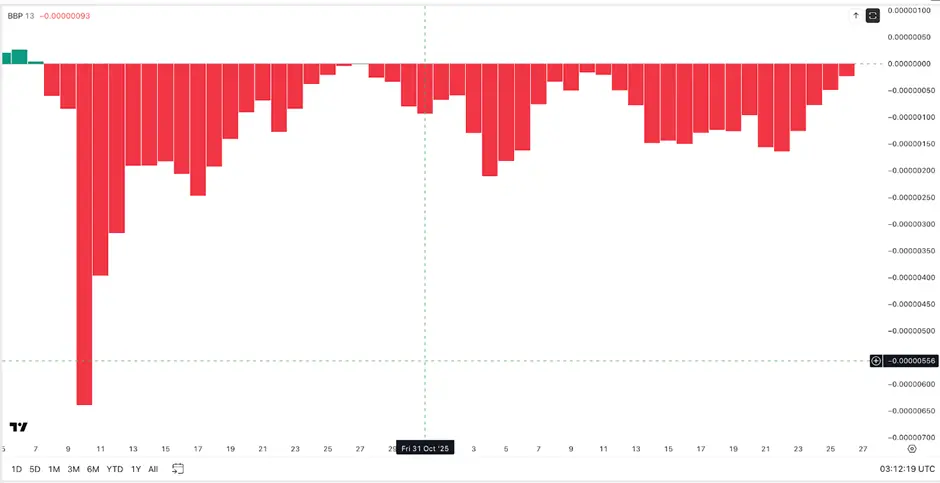 Pepe sellers decrease | Source: TradingViewHowever, the green columns have yet to dominate. Only when the buying force is strong and stable can the chart confirm a trend reversal.
Some analysts believe that PEPE coin may form a double bottom pattern in mid-December. This is a pattern when the price hits the bottom twice and begins to recover, which could create upward momentum if it receives strong enough support.
Currently, the frog-themed meme coin could still fall another 18% to the area of $0.00000375 if buying power does not defend the current price level. The price will only improve if it surpasses $0.00000466, and the downtrend will only truly end if the PEPE coin rises above $0.00000636.
The active accumulation of assets by whales will bring long-term benefits, but it is not enough to change the short-term trend at the present time.
Mr. Teacher
Disclaimer: The information on this page may come from third parties and does not represent the views or opinions of Gate. The content displayed on this page is for reference only and does not constitute any financial, investment, or legal advice. Gate does not guarantee the accuracy or completeness of the information and shall not be liable for any losses arising from the use of this information. Virtual asset investments carry high risks and are subject to significant price volatility. You may lose all of your invested principal. Please fully understand the relevant risks and make prudent decisions based on your own financial situation and risk tolerance. For details, please refer to
Disclaimer.
Related Articles
PEPE faces volatility risk as the threat of a "short squeeze" increases
The memecoin market is experiencing a significant downturn as the total industry capitalization has dropped by 48% over the past year and declined another 6.9% in the most recent month, according to data from CoinMarketCap. Meanwhile, a report from Glassnode indicates that this sector has only grown modestly by 2.2% in the past t
TapChiBitcoin1h ago
PEPE Hovers at Critical $0.053414 Support as $432M Volume Surge Tightens Breakout Watch
PEPE is trading at $0.053416, just above support at $0.053414, with significant trading volume up 22.14%. Resistance is at $0.053676. Despite a slight decrease in price, there’s increased market activity, suggesting potential volatility.
CryptoNewsLand9h ago
PEPE Price Coils Within $0.053385–$0.053517 Band as Momentum Stays Balanced
PEPE is trading within a tight range, with support at $0.053385 and resistance at $0.053517. The token shows minimal daily gains and balanced momentum indicators, indicating potential for volatility. Despite limited movement against USDT, PEPE appreciates against BTC and ETH.
CryptoNewsLand11h ago
PEPE Hovers at Critical $0.053414 Support as $432M Volume Surge Tightens Breakout Watch
PEPE is trading at $0.053416, just above support at $0.053414, with significant trading volume up 22.14%. Resistance is at $0.053676. Despite a slight decrease in price, there’s increased market activity, suggesting potential volatility.
CryptoNewsLand03-06 18:35
PEPE Price Coils Within $0.053385–$0.053517 Band as Momentum Stays Balanced
PEPE is trading within a tight range, with support at $0.053385 and resistance at $0.053517. The token shows minimal daily gains and balanced momentum indicators, indicating potential for volatility. Despite limited movement against USDT, PEPE appreciates against BTC and ETH.
CryptoNewsLand03-06 16:31