Chainlink (LINK) recorded an increase of 2.74% in the past 24 hours, following the news that the prestigious asset manager Franklin Templeton is considering adding major altcoins, including Chainlink, to its cryptocurrency index ETF. This move quickly became a positive catalyst for market sentiment.
In addition, optimistic news such as DTCC adding Bitwise's Chainlink ETF to its list of upcoming launches also sparks hope for investors amid the ongoing pressure from the bearish market trend. Although it is not enough to create a clear reversal in the short-term outlook, these signals are helping to strengthen long-term confidence in LINK.
Notably, the 15.25% increase over the past week has triggered a positive short-term sentiment. Although the on-chain indicators at the time of writing still show mixed results, the data indicates that buying pressure in the spot market is gradually gaining dominance.
The dominance of the bulls in the spot market and the profit-taking activities of Hodlers
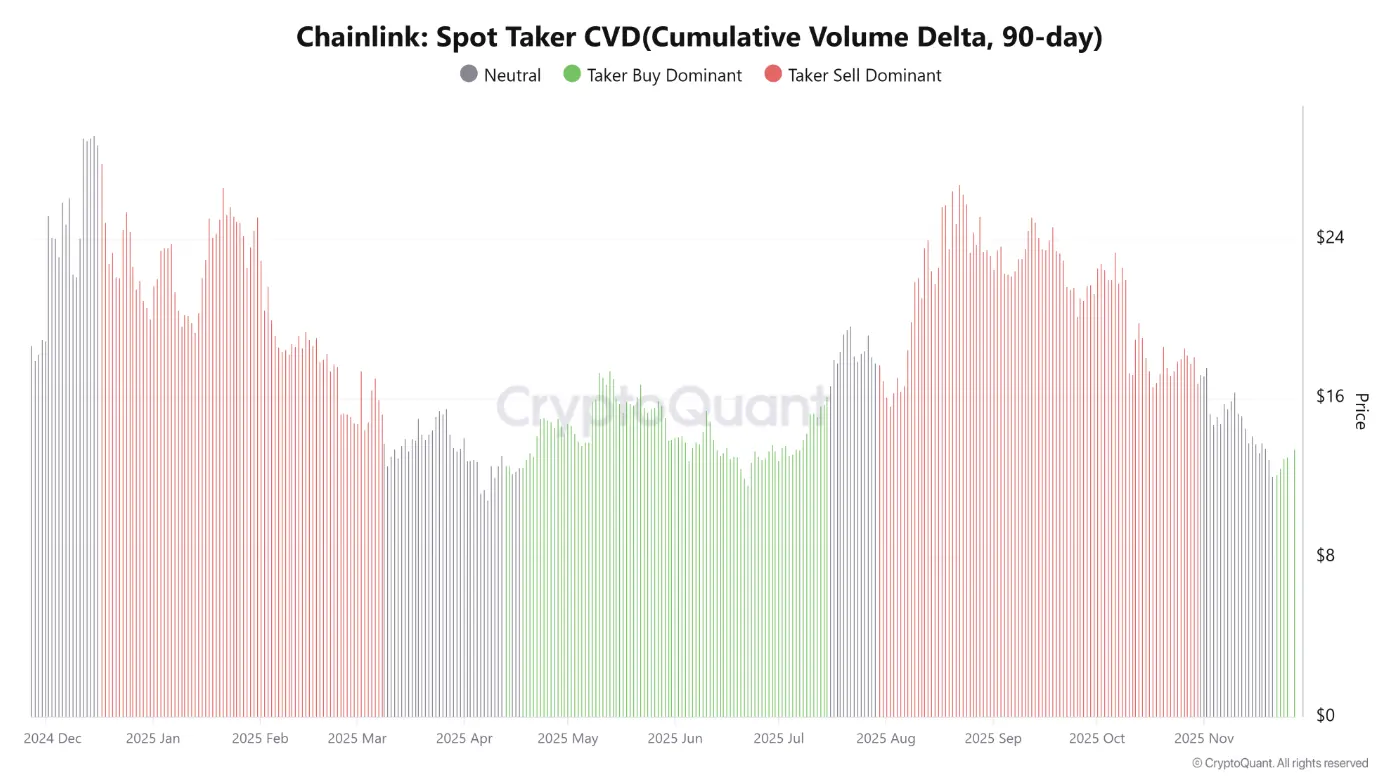 Source: CryptoQuantSince November 22, the spot taker index has shown that the bulls are gradually gaining the upper hand. This is an indicator that measures the accumulated difference between the buying and selling volumes of taker orders in the spot market over a period of 3 months.
When the CVD index of the spot taker remains in the positive zone and continues to increase, it clearly reflects the dominance of the buying force. Since taker orders are the direct driving force behind price fluctuations, this trend is seen as a notable bullish signal for Chainlink investors.
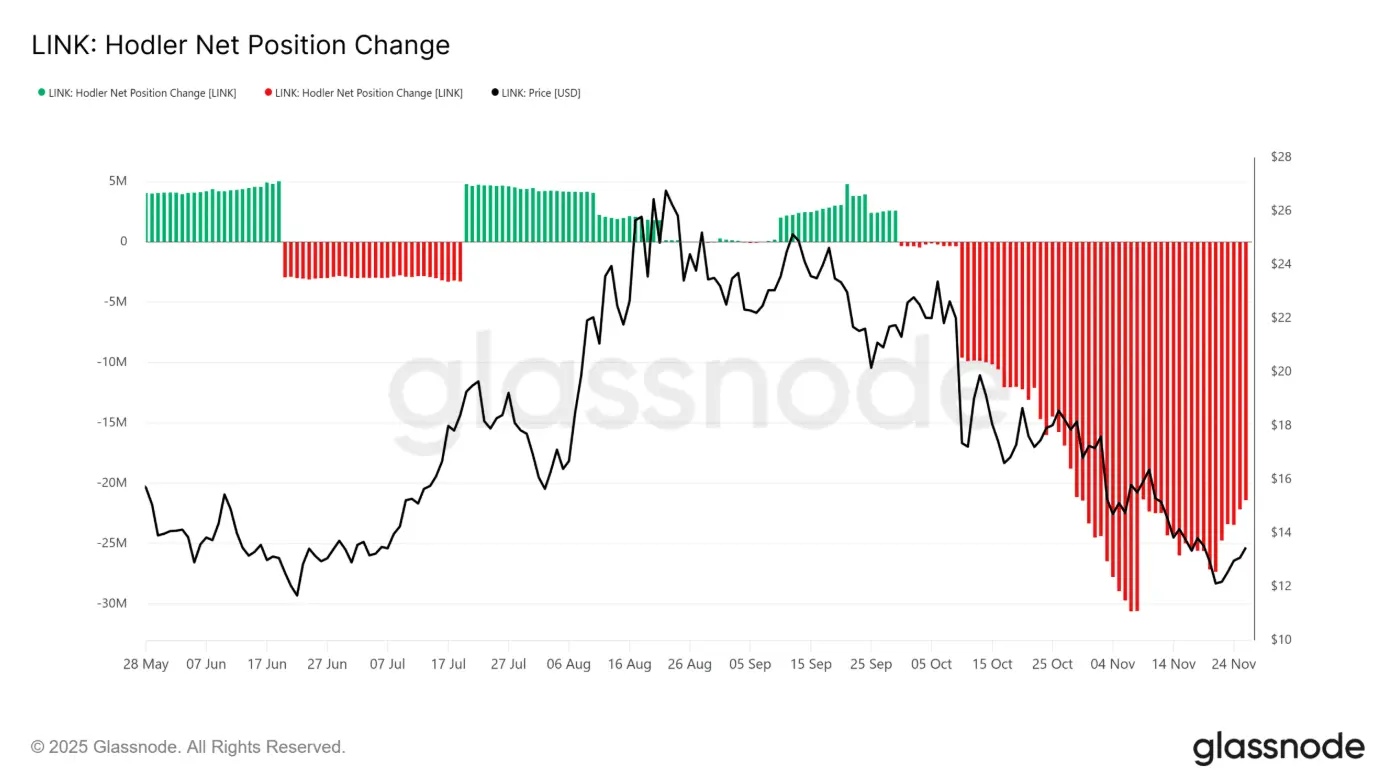 Source: GlassnodeHowever, on the contrary, the net position change index of LINK holders is still deeply in the negative zone. This indicator reflects the monthly fluctuations of long-term investors. Negative values indicate that holders are still taking profits. This trend has appeared since the first week of October, coinciding with the time LINK entered the correction phase. Although the selling pressure has somewhat weakened, data still shows significant capital outflows from the market.
The contrast between the short-term recovery trend of the price and the persistent selling pressure from the long-term holders is creating a rather tug-of-war situation for LINK.
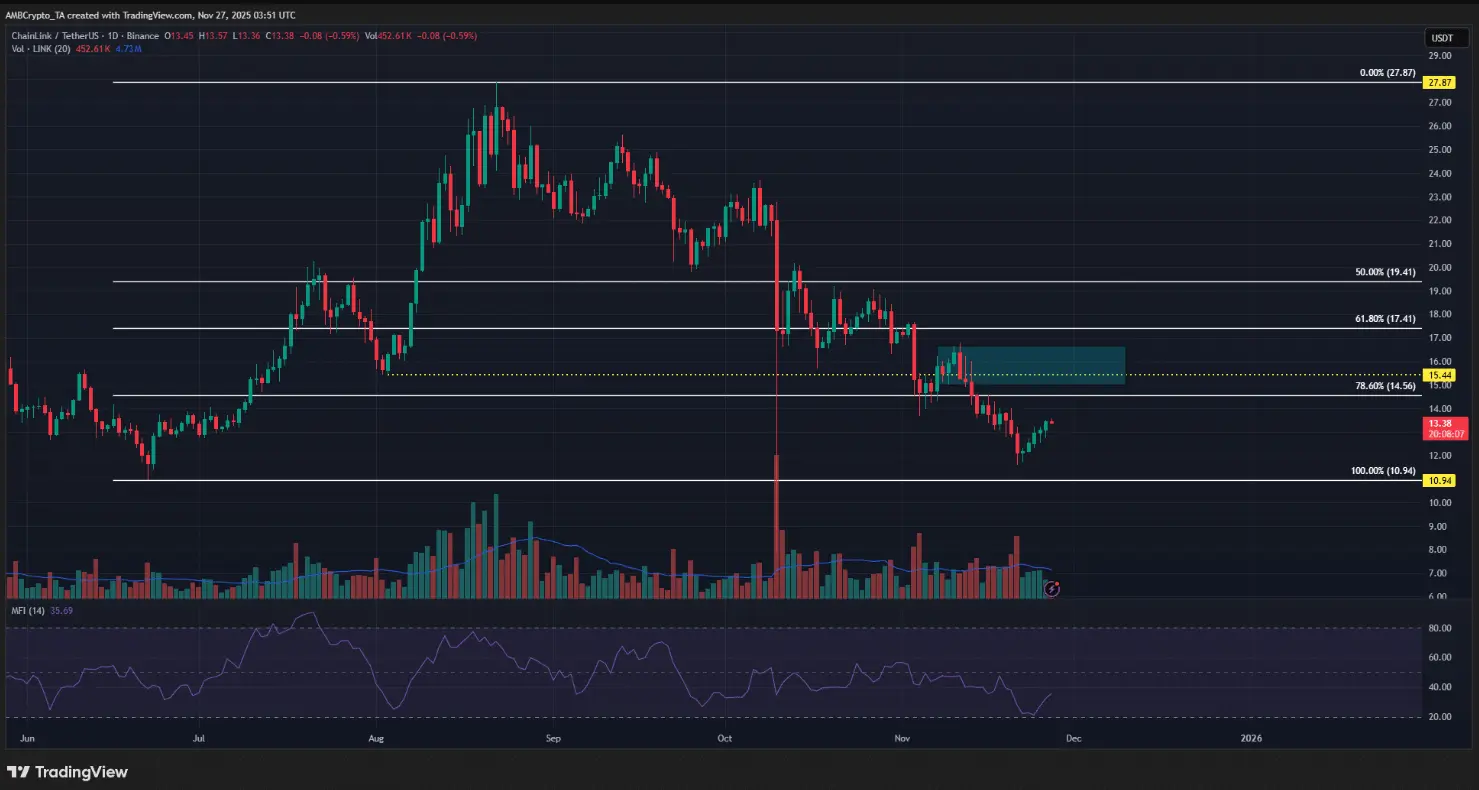 Source: TradingViewObserving the price chart on the 1-day frame, selling pressure remains evident. Despite the recent recovery, the MFI indicator still struggles to break into the high zone, currently fluctuating around the 35 mark at the time of recording. Although it hasn't fallen into the oversold area, this level still reflects the dominance of the sellers and indicates a prolonged downward momentum from October to now.
The aggregation of technical signals and on-chain data indicates that, although the market is showing some rays of hope for short-term price increases, the supply zone of 16 USD remains a key barrier. Only when this area is conquered and transformed into a support zone can LINK investors have a basis for expecting a more sustainable upward trend in the near future.
SN_Nour
Disclaimer: The information on this page may come from third parties and does not represent the views or opinions of Gate. The content displayed on this page is for reference only and does not constitute any financial, investment, or legal advice. Gate does not guarantee the accuracy or completeness of the information and shall not be liable for any losses arising from the use of this information. Virtual asset investments carry high risks and are subject to significant price volatility. You may lose all of your invested principal. Please fully understand the relevant risks and make prudent decisions based on your own financial situation and risk tolerance. For details, please refer to
Disclaimer.
Related Articles
ETH drops 1.07% in 15 minutes: whale fund concentration triggers short-term pullback
March 10, 2026, 18:00 to 18:15 (UTC), ETH's return within the 15-minute candlestick was -1.07%, with price fluctuations ranging from 2049.1 to 2073.15 USDT, an amplitude of 1.16%. During the same period, market trading volume significantly increased by over 32%, large on-chain fund flows occurred frequently, triggering short-term market sentiment fluctuations, rapidly increasing attention, and intensifying volatility risks.
The main driver of this abnormal movement is the concentrated sell-off by whale funds. On-chain data shows that within this time window, there were four large transfers exceeding 5000 ETH, all flowing to a major...
GateNews4m ago
BTC 15-minute decline of 0.70%: On-chain large transfers and macro bearish signals resonate, triggering short-term selling pressure
From 18:00 to 18:15 (UTC) on March 10, 2026, BTC experienced a significant price fluctuation, with a 15-minute return of -0.70%. The price range was 70366.3-70915.0 USDT, with an amplitude of 0.77%. During the same period, trading volume increased by 18% compared to the previous hour's average, and the order book depth temporarily narrowed, indicating increased market volatility and heightened attention.
The main drivers of this fluctuation were multiple large on-chain fund transfers and macro news resonance. Between 18:03 and 18:12, there were several on-chain transactions exceeding 500
GateNews4m ago
XRP Slides to $1.42 After Losing $1.80–$2 Neckline as $1.39 Support Faces Immediate Test
XRP dropped to less than the $1.80-2 neckline and a key support area became an overhead and the overall trend was altered.
The current short-term trading corridor is between the support and resistance of the asset which is between $1.39 and $1.47 respectively.
A price above $1.39 will
CryptoNewsLand35m ago
Solana Approaches Key Sell Wall at $84.78 — Will Momentum Hold for a Move Toward $89?
Solana is trading at an approximate price of $83.18, although a solid sell wall is at an approximate price of $84.78, which prevents upward movement.
The price is trapped between the support at $81.99 and the resistance at $84.78 which is short term consolidation.
Once buyers hit the
CryptoNewsLand46m ago
Polkadot Holds $1.46 Support as Descending Channel Caps Upside Near $1.53
The heaviest resistance is at the 4-hour chart where DOT trades within a downward channel and resistance levels are formed near the levels of $1.50-$1.53.
The nearest support is at $1.46 and a more profound zone of demand is at the range of $1.38 to $1.40.
Even with a 1.5 price drop, DOT
CryptoNewsLand50m ago
DOGE Price Prediction: Elon Musk Drops X Money News and Dogecoin Immediately Pumps
The Dogecoin price shot up 10% today after Elon Musk announced that X Money early public access starts in April.
DOGE is now trading near $0.0985, just below the key $0.10 level that traders are watching closely.
Musk’s X Money News Sparks Immediate Rally
Where Is the D
CaptainAltcoin1h ago