The surge of Quant (QNT) in the past 24 hours continues to draw attention from the market, as the investor sentiment index on the chart soared to an impressive level of 88%.
At the time of recording, QNT surged by 14% — the strongest increase among cryptocurrency assets for the day, while most of the market struggled to achieve double-digit gains.
The key issue at this moment is whether the new influx of capital is strong enough to help QNT maintain the psychological level of 100 USD, as is being reflected on the chart.
Why is QNT increasing in price?
The most convincing evidence for the recent rise of QNT comes from the strong consensus between two groups of investors in the spot and derivatives markets.
In the spot market, the bottom-fishing cash flow has clearly returned as investors have accumulated approximately $248,000 worth of QNT, right after two days of sell-offs that created downward pressure. This net buying move — a quick reversal from the previous trend — reflects the increasingly reinforced confidence in the current price range.
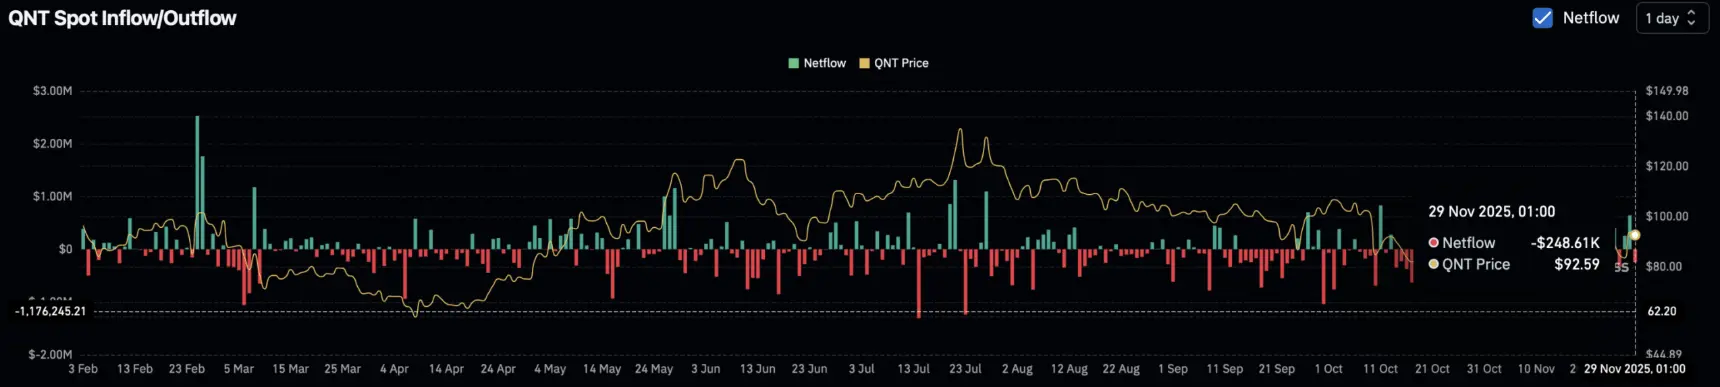 Source: CoinGlassEqually vibrant, the derivatives market also records active participation from traders. Open contracts (OI) soared to nearly 18 million USD, with an additional 1.5 million USD added in the last 24 hours alone. In the context of the Funding rate maintaining in the positive zone, this development indicates that most investors are betting on the scenario where QNT continues to expand its upward momentum.
At the time of recording, QNT was trading around the 93 USD mark, approaching the psychological threshold of 100 USD. However, some other psychological indicators are still signaling caution, indicating that the ability to conquer this price level may not be easy.
QNT hits a large supply zone
The supply zone in front is still the biggest barrier holding back the rise of QNT.
Essentially, the supply zone is an area where a dense concentration of unfilled sell orders exists. When the price enters here, the profit-taking pressure often increases significantly, triggering a wave of selling and pushing the price to reverse and correct.
On the chart, the supply zone of 93.32–99.13 USD has rejected QNT's breakout attempts twice: the first time causing a price drop of 27.73%, while the second time also triggered a decline of 27.06%. If this scenario repeats, QNT risks continuing to lose an average of about 27.3%, retreating to the support area around the 70 USD mark.
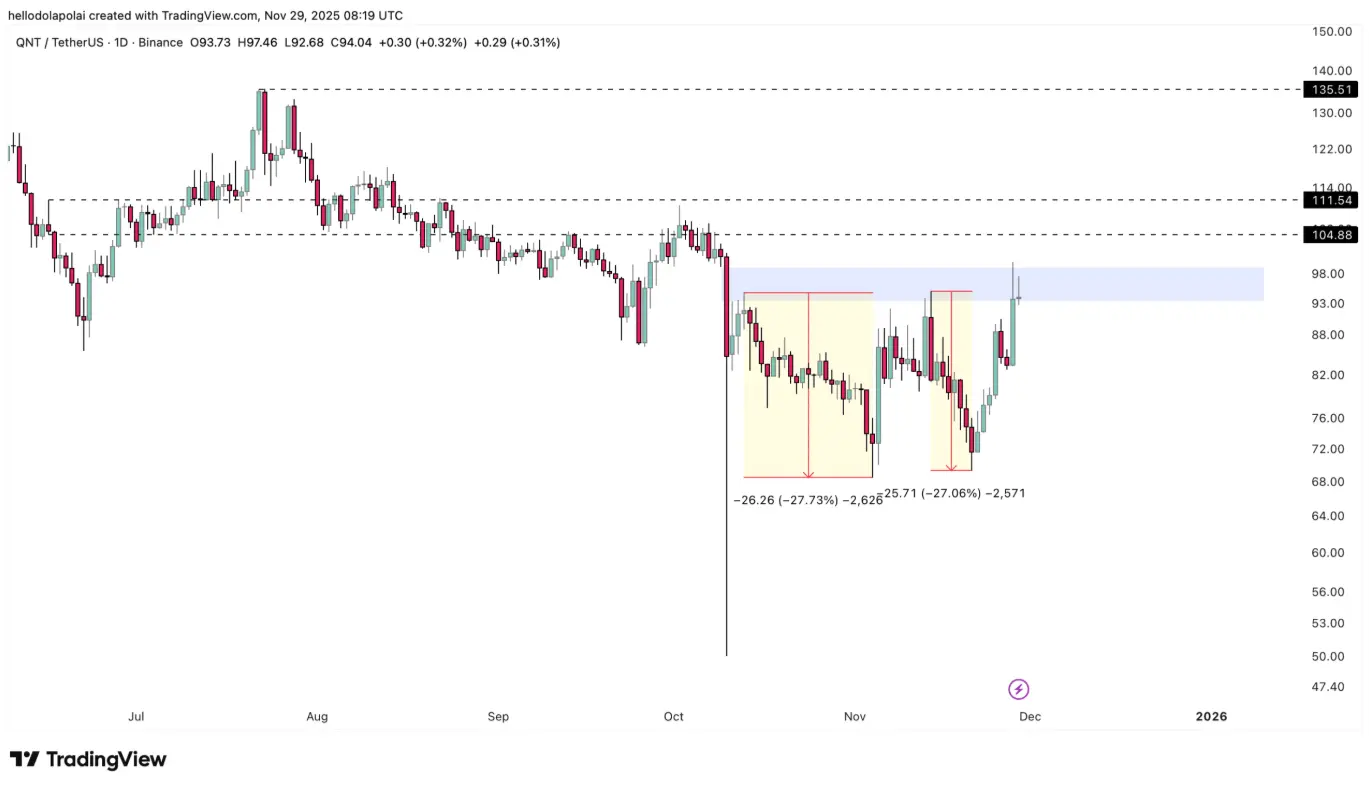 Source: TradingViewHowever, the door to the bull market has not closed. A decisive breakout above the supply zone will open up three important targets of 104 USD, 113 USD, and the highest peak near 121 USD on the chart.
At the current time, the market is converging with mixed signals: it has both ignited hope for a new growth cycle and issued a warning that investors need to maintain caution.
Capital inflows are increasing, but caution is still present.
The capital flowing into the market has increased significantly in the past 24 hours, as the Money Flow Index (MFI) continues to maintain its upward trend. The MFI surpassing the 50 threshold and trending upwards indicates that new capital is flowing strongly into the market, while also confirming that buying power is quite active.
However, the picture is not entirely optimistic as conflicting signals emerge from the Accumulation/Distribution indicator (A/D). Data shows that investors are tending to distribute tokens, with the volume decreasing to 970,000.
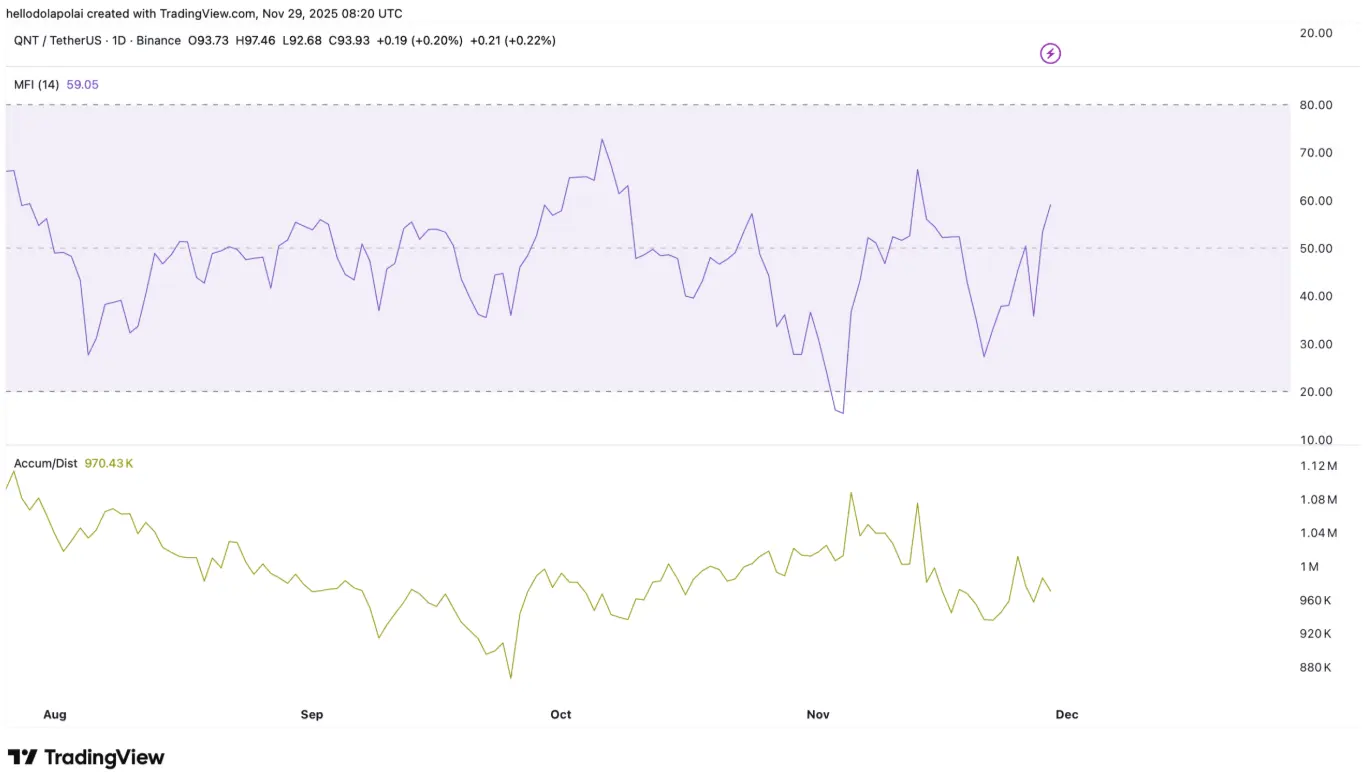 Source: TradingViewAlthough the technical signals are showing contradictions, the current distribution pressure is likely reflecting profit-taking activity rather than triggering a strong sell-off wave. Nevertheless, in the scenario where both the Distribution index and MFI weaken simultaneously, QNT may face the risk of a deep decline, putting many investors in a losing position.
SN_Nour
Disclaimer: The information on this page may come from third parties and does not represent the views or opinions of Gate. The content displayed on this page is for reference only and does not constitute any financial, investment, or legal advice. Gate does not guarantee the accuracy or completeness of the information and shall not be liable for any losses arising from the use of this information. Virtual asset investments carry high risks and are subject to significant price volatility. You may lose all of your invested principal. Please fully understand the relevant risks and make prudent decisions based on your own financial situation and risk tolerance. For details, please refer to
Disclaimer.
Related Articles
Dogecoin faces a risk of sharp decline as selling pressure increases
Dogecoin (DOGE) records its second consecutive decline, trading around $0.090 as of Saturday. Previously, this meme coin reached its weekly high of $0.104 on Wednesday. However, the rapid rally was halted as the market entered a period of volatility.
TapChiBitcoin56m ago
BTC surged to $74,000 before falling back below $69,000, with the total market capitalization evaporating approximately $110 billion.
This week, the cryptocurrency industry received positive news from Wall Street, but Bitcoin's price fell from $74,000 to $69,000, with a market cap evaporating approximately $110 billion. The strength of the US dollar and macroeconomic factors are putting pressure on risk assets. Short-term holders are taking profits, increasing selling pressure, but the US spot Bitcoin ETF recorded net inflows, indicating an improvement in the funding environment.
GateNews4h ago
Today, the cryptocurrency Fear & Greed Index dropped to 12, indicating the market is in extreme fear.
Gate News Report, March 7th, according to Alternative.me data, today the cryptocurrency fear and greed index dropped to 12, indicating the market is in a state of "extreme fear." Yesterday, the index was 18, also in the "extreme fear" zone.
GateNews4h ago
Kaspa Tops CoinMarketCap Community Sentiment With 90% Bullish Votes – Here’s Why
Kaspa’s price hasn’t had the best year. The coin is currently trading around $0.03, and on the yearly chart it’s still down roughly 60%. That kind of drop usually hurts sentiment in most crypto
CaptainAltcoin5h ago
Will XRP Hold $1.33 or Extend Toward $1.30 Before Rebound?
XRP is currently trading at $1.35, experiencing a 1.3% decline. Key support is at $1.34, while resistance is at $1.40. The price is testing around the Fibonacci levels of $1.33 and $1.30, crucial for potential upward movement or deeper decline.
CryptoNewsLand9h ago