Due to the sluggish global trading financial market, Bitcoin spot investors have failed to provide the necessary volume. Last week, the price of Bitcoin briefly surged to around $93,300, before falling below $85,000 at the beginning of this week. Binance's “Bitcoin to stablecoin reserve ratio” has dropped to its lowest level since 2018, with a large amount of stablecoins flooding into the market ready to buy coins, but spot buyers are hesitant and may remain sideways ahead of the Federal Reserve (FED) FOMC meeting.
93,000 USD breakout failure: a dual setback of technical and psychological factors
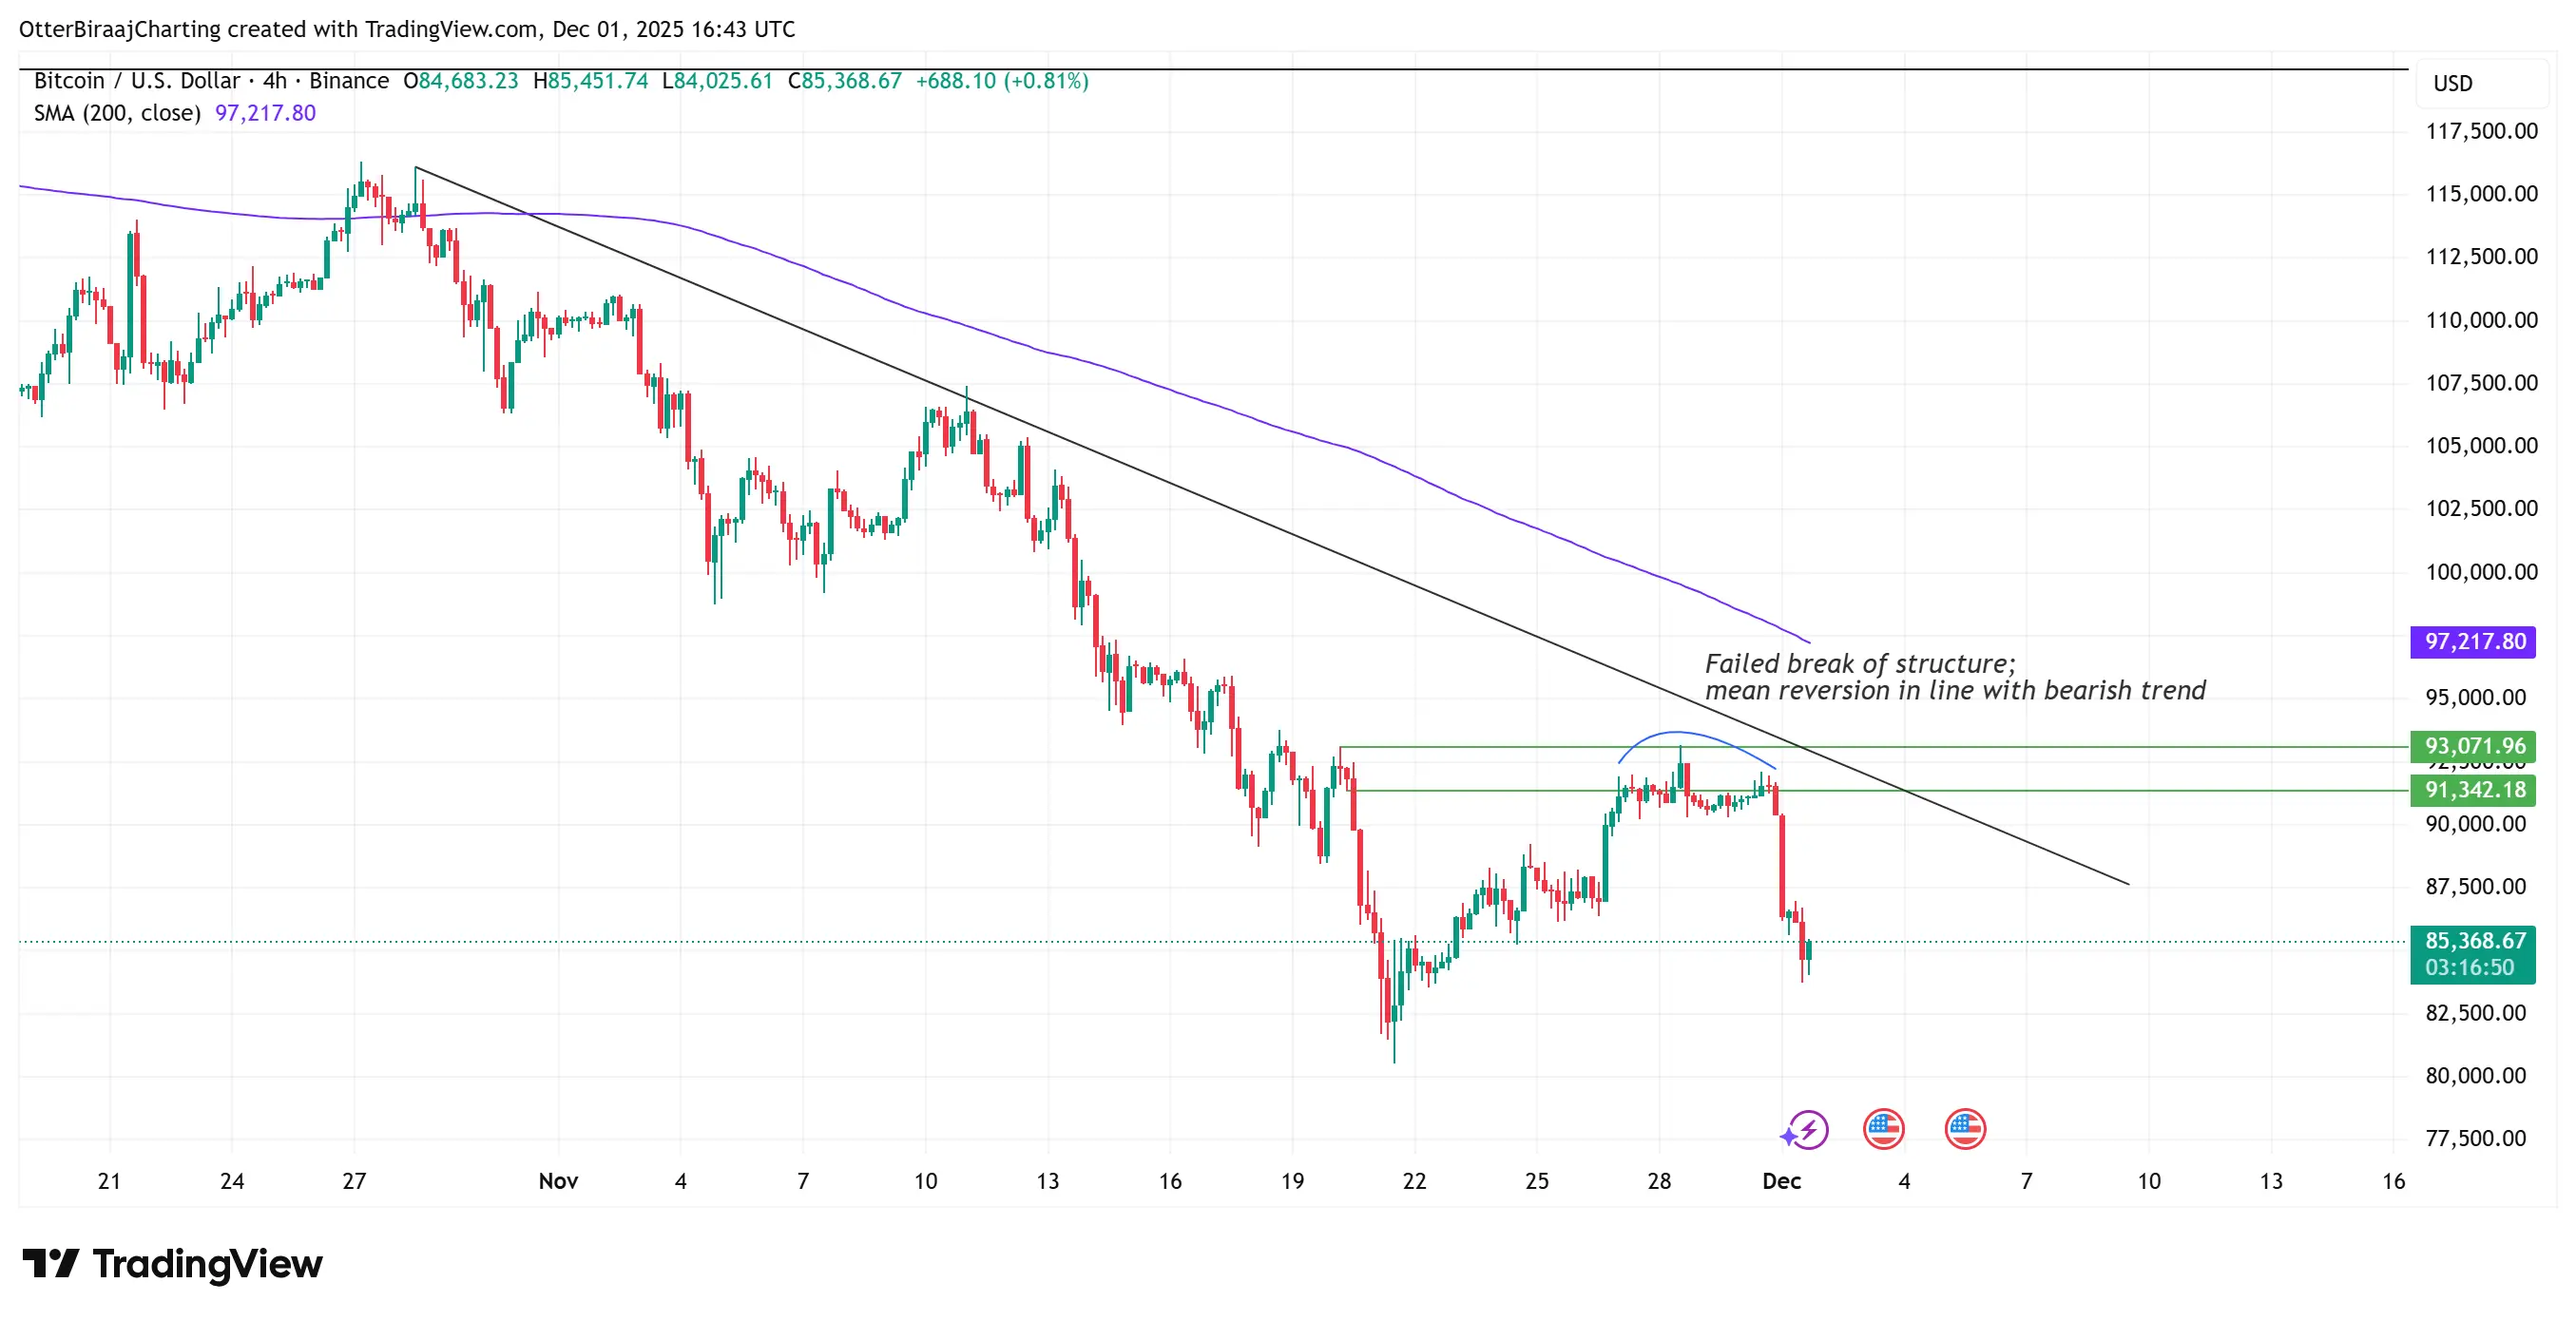
(Source: Trading View)
The core focus of today's Bitcoin news is the failed attempt to close above the key resistance zone after last week's brief surge in Bitcoin prices to around $93,300. However, Bitcoin could not prevent the mean reversion trend, with prices falling below $85,000 on Monday. The failure to close above $93,000 invalidates the confirmation of a bullish trend reversal. This breakout failure is not only a technical setback but also a significant blow to market sentiment.
Why is $93,000 so critical? This price level is the upper edge of the previous consolidation area and an important rebound target since the drop from the historical high of $126,000. Technical analysts generally view $93,000 as the dividing line between bulls and bears; breaking through and holding above it will confirm the end of the downtrend, while the opposite suggests that the bear market structure continues. When Bitcoin briefly touched $93,300 but failed to close above it, a large number of long stop losses and short positions were triggered, causing the price to quickly retrace.
From Friday's $93,300 to below $85,000 on Monday, Bitcoin experienced a drop of over 8% in just two trading days. This rapid reversal indicates that significant selling pressure has accumulated around the $93,000 mark. This selling pressure may stem from several sources: investors trapped at higher prices reducing their positions during the rebound, short-term traders taking profits, and short sellers opening positions at technical levels. Regardless of the source, the result is the same: the strength of spot buyers is insufficient to absorb this selling pressure.
If there is no new spot demand, the price of Bitcoin may fluctuate between $80,600 and $96,000 until one of the price points is tested again. This wide oscillation range provides opportunities for short-term traders, but it means ongoing uncertainty and anguish for long-term investors.
The bizarre phenomenon of stablecoins hitting new highs yet not being bought

(Source: CryptoQuant)
Despite the continued weakness in spot demand, the surplus of stablecoins indicates that the purchasing power driving price surges is already present, but currently remains idle. Data from CryptoQuant shows that Binance's “Bitcoin to Stablecoin Reserve Ratio” has dropped to its lowest level since 2018. This means that a large amount of stablecoins is flooding into the market, ready to buy Bitcoin, a trend that is unprecedented. Historically, such an extreme stablecoin/Bitcoin ratio in exchanges often signals a major rally.
This data point is extremely contradictory and striking. The stablecoin reserve ratio has dropped to a historical low, meaning that relative to the amount of Bitcoin, the number of stablecoins in exchanges has reached a historical high. Stablecoins are often seen as “sideline funds,” representing purchasing power ready to enter the market at any time. When a large influx of stablecoins enters exchanges, it typically indicates that investors are preparing to buy.
However, today's news on Bitcoin shows that despite stablecoins reaching new highs, the spot buying has yet to materialize. This phenomenon of “having money but not buying” reflects the deep hesitation among investors. They have converted their funds into stablecoins and deposited them in exchanges, indicating a willingness to buy, but have yet to take action, showing a lack of confidence in the current prices and market outlook. Possible reasons include: waiting for lower buying prices, concerns that the falling trend has not yet ended, or waiting for clear signals from key events such as the FOMC meeting.
Insufficient spot liquidity and inadequate order book depth are the main reasons why Bitcoin is currently struggling to break through the $93,000 mark. Although there is a dense cost basis cluster around $84,000, the over 400,000 Bitcoins purchased within this range have actually formed an on-chain bottom. These 400,000 Bitcoins represent investors who bought around $84,000 and are motivated to defend when the price falls near their cost.
However, despite the strong historical accumulation momentum, the price range of $84,000 to $90,000 lacks positive buying pressure. At the same time, many short-term holders still have funds below their average purchase price of $104,600, resulting in insufficient market liquidity. These investors who bought at high prices are currently in a loss position, unwilling to cut losses and exit, nor do they have funds to increase their positions and average down costs, forming a “zombie position” that locks up a significant amount of liquidity.
Liquidity trap in the range of 80,600-96,000 USD

(Source: Trading View)
Bitcoin is currently trapped between $96,000 (recent range top) and $80,600 to $84,000 (on-chain cost basis lower limit). Liquidity is concentrated at both ends of these two ranges, which means that a breakout in either direction could trigger significant price volatility. This liquidity distribution characteristic is referred to in technical analysis as a “liquidity trap,” with prices oscillating in the vacuum zone between the two liquidity concentration areas.
From a bullish perspective, the re-testing of Bitcoin prices near the lower band of $80,600 to $84,000 could be a positive signal. This would allow Bitcoin to absorb liquidity during the decline and rebuild a base before a rebound. When the price touches $80,600, a large number of limit buy orders will be triggered, representing genuine demand for buying on dips. After absorbing this liquidity, the price will gain firmer support, laying the groundwork for subsequent upward movements.
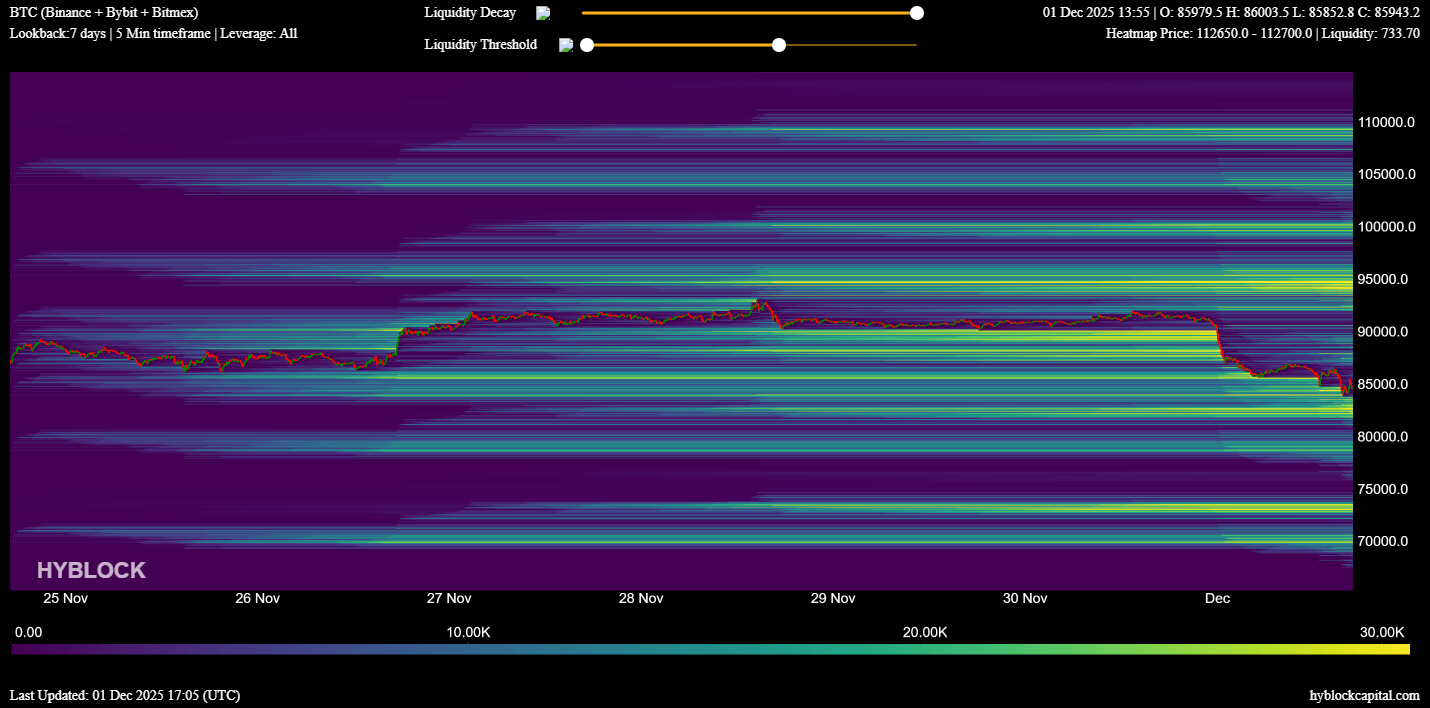
(Source: Hyblock Capital)
On the contrary, if there is an immediate retest of $93,000 to $96,000 without first accumulating liquidity below, it may backfire, as sellers might re-enter the market, leading to further price corrections in line with the overall downtrend. Forcing an upward attack without clearing liquidity below is like building a castle on the beach; the foundation is unstable and can easily be toppled.
The Current Bidirectional Liquidity Trap Facing Bitcoin
Upper Trap (93,000-96,000 USD): A large number of trapped positions and profit-taking orders are waiting to exit here, making the breakthrough resistance substantial.
Lower Trap (80,600-84,000 USD): The dense cost basis provides support, but it is also the last line of defense; a fall below may trigger panic.
Middle Vacuum (84,000-93,000 USD): Lack of aggressive buying and selling, the price lacks direction in this range.
The most bizarre phenomenon in today's Bitcoin news is: stablecoin reserves have reached an all-time high, indicating ample purchasing power, yet actual buying interest is extremely scarce. This state of “plenty of ammunition but no one is firing” could either be the calm before the storm (large funds waiting for the best moment to enter the market) or a false prosperity (stablecoins are just parked at exchanges, ready to withdraw at any time).
The market is dominated by cautious sentiment before the FOMC meeting
In light of the current situation, the market is likely to experience a period of sideways consolidation ahead of the Federal Reserve (FOMC) meeting scheduled for December 9th to 10th. As the market closely watches for signals regarding U.S. interest rate policy, traders may choose to remain on the sidelines rather than chase market fluctuations. This pre-FOMC cautious sentiment is very common in financial markets and is referred to as “event-driven risk aversion.”
The FOMC meeting is one of the most important regular events in the global financial markets. The Federal Reserve's interest rate decisions and policy statements will directly affect USD liquidity, risk appetite, and asset prices. The market currently widely expects the Federal Reserve to cut rates by 25 basis points in December, but more importantly, the policy statement after the meeting and Chairman Powell's press conference. If the Federal Reserve hints at continuing to cut rates in 2026, it will provide support for risk assets. Conversely, if the Federal Reserve expresses concerns about inflation and hints at pausing rate cuts, it may trigger a sell-off of risk assets.
In this uncertainty, professional traders and institutional investors often choose to reduce their positions or remain on the sidelines, waiting for clear signals from the FOMC meeting before making decisions. This behavior pattern explains the current lack of liquidity and unclear direction in the Bitcoin market. A large reserve of stablecoins represents potential purchasing power, but the holders of these funds are waiting for signals released by the FOMC meeting.
If the FOMC meeting results are dovish (with interest rate cuts and hints at further cuts), it may trigger a concentrated entry of stablecoins, pushing Bitcoin to quickly break through $93,000 and even challenge $96,000. Conversely, if the results are hawkish, these stablecoins may remain on the sidelines or even withdraw, leading to Bitcoin testing the support below $80,600. Therefore, the FOMC meeting on December 9-10 could become a key moment in determining Bitcoin's short-term direction.
For investors, the current strategy choices depend on risk tolerance and investment time frame. Aggressive traders may try to buy the dip in the range of $80,600 to $84,000, targeting $93,000, but must set strict stop-loss orders. Conservative investors should wait for a clear direction after the FOMC meeting or wait to enter after Bitcoin effectively breaks through $96,000. In the current uncertain environment, maintaining patience and discipline is more important than blindly chasing highs and selling lows.